
Reports
Reports
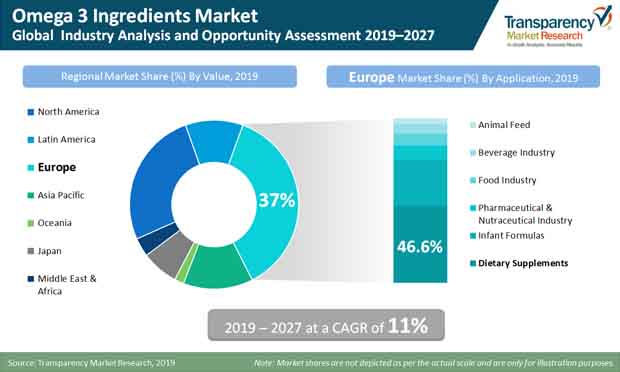
Future shines bright for the omega 3 industry, after the EPA and DHA made first cut in obtaining the regulatory approval. TMR’s research finds that the demand for omega 3 foods is surging at an unprecedented pace, having garnered significant consumer appeal since 2014, and global sales of omega 3 ingredients were upward of US$ 4,500 Mn in 2018. Growing consumer inclination towards improving their immunity and overall wellbeing continues to be a broader influential aspect, however, slower regulatory approval is expected to stymie growth to a significant extent.
The paradigm shift towards healthy food consumption, driven by rising chronic disease prevalence led by poor dietary habits. These technology-induced ingredients continue to gain popularity as effective food quality enhancers, thereby attracting the widening health-conscious demographic.
A slew of aspects including the emergence of new combination products, and the newfound appreciation of scientific evidence for omega 3 ingredients among consumers and healthcare professionals, has meant that the prebiotic ingredients market will witness sheer proliferation in the upcoming years. Although development and sales of omega 3 ingredients positioned specifically for dietary supplements lag behind variants such as amino acids, studies that back benefits of fatty acids for athletes are likely to advocate adoption. The study finds that demand for Eicosapentaenoic acid (EPA) and Docosahexaenoic acid (DHA) remains strong in omega 3 oil and seafood industry.
Omega 3 ingredients are becoming an indispensable part of the dietary supplements pyramid. While the growing consumer awareness continues to reap profits in the omega 3 ingredients market, suppliers are formulating strategies that highlight the preventive role of polyunsaturated fatty acids (PUFAs) in thwarting prevalence of chronic diseases. Numerous government initiatives to promote adequate intake of omega 3 ingredients are complementing the marketing efforts of stakeholders in the omega 3 ingredients market.
The focus of suppliers on maintaining a steady product supply continues to be a recuperative influencer of demand-side trends in the omega 3 ingredients market. The fish oil derived omega 3 ingredients continue to govern sales in the landscape – accounting for 90% sales approximately according to our research. Whereas, plant-derived omega 3 ingredients are likely to take the center stage abreast remarkable growth in the vegan trend, which consequentially propels the demand for vegan supplements.
Studies have attested the effectiveness of fish oil in alleviating symptoms of ADHD in children while improving their cognitive skills. Additionally, the two most popular omega 3 ingredients, namely, Eicosapentaenoic acid (EPA) and Docosahexaenoic acid (DHA) sourced from fish oil are linked with improving cognitive functions in infants and aging demographic alike. Such favorable researches continue to trigger higher adoption of omega 3 ingredients among the rapidly-growing health-conscious consumers.
Consumers in developed markets have already embraced the health & wellness trends, and relevant consumption practices have been on an upsurge recently. As awareness of health benefits of omega 3 ingredients picks pace, such as consumption of PUFAs in regular diet, prospects of the omega 3 ingredients market in these economies remain bullish. Economic vigor of consumers backed by their willingness to spend more on health supplements, coupled with the advocacy of evident benefits associated with fish oil-derived omega 3 ingredients among leading regional regulators, continue to favor sales of omega 3 ingredients in these regions.
Global omega 3 ingredients market is primarily characterized by essence of a large number of multinational and regional companies. Multinational players with their extensive product portfolios hold significant share in the omega 3 ingredients market, while they aim in reaping profits by targeting of the large pool of health-conscious consumers in Europe and North America. The leverage of innovative technologies, such as PureMax, to strip impurities in oil and ensure the provision of quality products to consumers, remain key growth strategies of the omega 3 ingredients industry leaders.
The companies operating in the omega 3 ingredients market, as profiled in the study, include Marine Ingredients, LLC., Omega Protein Corporation, Copeinca ASA, Cargill Incorporated, GC Rieber Oils AS, POLARIS Nutritional Lipids, Croda International plc, Luhua Biomarine (Shandong) Co., Ltd, Koninklijke DSM N.V., Denomega Nutritional Oils, and NU-MEGA Ingredients Pty Ltd. (Clover Corporation).
Omega 3 Ingredients Market is estimated to rise at a CAGR of 11% during forecast period
Europe and North America are more attractive for vendors in the Omega 3 Ingredients Market
Continued research for the potential health benefits of omega 3 ingredients in the growth and development of toddlers is promising for the growth of omega 3 ingredients market.
The companies operating in the omega 3 ingredients market, as profiled in the study, include Marine Ingredients, LLC., Omega Protein Corporation, Copeinca ASA, Cargill Incorporated, GC Rieber Oils AS, POLARIS Nutritional Lipids, Croda International plc, Luhua Biomarine (Shandong) Co., Ltd, Koninklijke DSM N.V., Denomega Nutritional Oils, and NU-MEGA Ingredients Pty Ltd. (Clover Corporation).
The forecast period considered for the Omega 3 Ingredients Market is 2019-2027
1. Global Omega 3 Ingredients Market - Executive Summary
1.1. Global Omega 3 Ingredients Market Country Analysis
1.2. Vertical Specific Market Penetration
1.3. Application – Product Mapping
1.4. Competition Blueprint
1.5. Technology Time Line Mapping
1.6. TMR Analysis and Recommendations
2. Market Overview
2.1. Market Introduction
2.2. Market Definition
2.3. Market Taxonomy
3. Market Trends
3.1. Key Trends Impacting the Market
3.1.1. Marketers Reach Out to Millennial
3.1.2. Leveraging New Health Claims (by Brand Owners and Nutraceutical Supplement Manufacturers)
3.2. Desirable Health Claims by Manufacturers and Brand Owners
3.3. Shortened M&A Activity
3.4. Heightened Product Launch Frequency
4. Product Innovation / Development Trends
4.1. Cultural Customization to Target Specific Population and Ethnic Group
4.2. Creating New Delivery Mechanisms
4.3. Indication Specific / Targeted Supplement Formulation
4.4. Shift Toward Natural Ingredients
4.5. Preferential Inclination towards Non-Modified Functional Ingredients
4.6. Transformed Packaging to Suit Customer Orientation
4.7. Brand Differentiation through Packaging
5. Market Background and Associated Industry Indicators
5.1. Transformed Nutraceuticals Market (Industry Proposition Then and Now)
5.2. Varying Definition and Regulation for Omega 3 Supplement across the Globe
5.3. Rising Cost of Healthcare and Role of Omega 3 Supplements
5.4. Preventive Healthcare is Getting Traction then Treatment
5.5. Consumer Out of Pocket Healthcare Expenditure
5.6. Per Capita Health Food and Supplement Spending
5.7. Nutraceutical Supplement Spending (as a percentage of total Health Food and Supplement Spending)
5.8. Convergence of Food and Pharmaceuticals
5.9. Nutraceutical Supplement and Omega 3 Product Hotspot - Pipeline Analysis
5.10. Macro-Economic Factors - Relevance & Impact
5.10.1. Healthcare Sector GVA and Growth
5.10.2. Retail Sector GVA and Growth
5.10.3. Per Capita Disposable Income
5.10.4. Organized Retail Penetration
5.10.5. Middle Income Population Group
5.10.6. Global GDP Growth Outlook
5.11. Forecast Factors - Relevance & Impact
5.11.1. Top Companies Historical Growth
5.11.2. Target Incidence Occurrence Rate
5.11.3. Functional Food Industry Growth
5.11.4. Out of Pocket Healthcare Expenditure Trend
6. Market Dynamics
6.1. Drivers
6.1.1. Affluence of Working Population
6.1.2. Changing Lifestyle and Dietary Pattern
6.1.3. Increased Awareness
6.1.4. Omni-Channel Product Offering by Brand Owners
6.1.5. Ageing Population
6.2. Restraints and Market Risks
6.2.1. Slower Regulatory Approval for Health Claims
6.2.2. Cluttered Market Behavior
6.2.3. High Associated Cost of Product Development
6.3. Opportunity Analysis
6.3.1. Total Addressable Opportunity
6.3.2. Innovation Hub and Test Markets
7. Policy and Regulatory Landscape
7.1. Dietary Supplement Health and Education Act (DSHEA)
7.2. Federal Food & Cosmetics Act
7.3. Europe Food & Safety Authority
7.4. State Food and Drug Administration (SFDA)
7.5. Foods for Specified Health Uses
7.6. FSSAI
7.7. Food Packaging Claims
7.8. Labeling and Claims
8. Risk & Opportunities Market Tendencies & Latest Buzz
8.1. Intrinsic Opportunities
8.1.1. Technology enhancements
8.1.2. In operational excellence
8.2. Extrinsic Opportunities
8.2.1. Partnerships with key food & beverages giants
8.2.2. Licensing opportunities
8.2.3. In clusters, countries and regions
8.3. Associated Risks
8.3.1. Pertaining to regulatory framework and approvals
8.3.2. Related to standards and certifications
8.3.3. Change in consumer preferences
8.3.4. Threat of alternatives
9. Key Success Factors
9.1. Leveraging Personalized Healthcare Delivery
9.2. Powerful Portfolio of Formulation and Brands
9.3. Nuanced Marketing Campaigns
9.4. Exploiting Economies of Scale
9.5. Establishing Flexible Supply Chain to Optimize on Miracle Ingredients
9.6. Working in Close Vicinity of Policy Formulators
9.7. Strategic Promotional Activity
10. Supply Chain Analysis
10.1. Profitability and Gross Margin Analysis By Competition
10.2. List of Active Participants- By Region
10.2.1. Raw Material Suppliers
10.2.2. Key Manufacturers
10.2.3. Key Distributor/Retailers
10.2.4. Operating Margins
11. Global Omega 3 Ingredients Market Pricing Analysis
11.1. Price Point Assessment by Product Type
11.2. Regional Average Pricing Analysis
11.2.1. North America
11.2.2. Latin America
11.2.3. Europe
11.2.4. Asia Pacific Ex. Japan (APEJ)
11.2.5. Japan
11.2.6. Oceania
11.2.7. Middle East and Africa
11.3. Price Forecast till 2027
11.4. Factors Influencing Pricing
12. Global Omega 3 Ingredients Market Analysis and Forecast
12.1. Market Size Analysis (2014-2018) and Forecast (2019-2027)
12.1.1. Market Value (US$ Mn) and Volume (Tons) and Y-o-Y Growth
12.1.2. Absolute $ Opportunity
12.2. Global Omega 3 Ingredients Market Scenario Forecast (Optimistic, Likely and Conservative Market Conditions)
12.2.1. Forecast Factors and Relevance of Impact
12.2.2. Regional Omega 3 Ingredients Market Business Performance Summary
13. Global Omega 3 Ingredients Market Analysis By Product Type
13.1. Introduction
13.1.1. Y-o-Y Growth Comparison By Product Type
13.1.2. Basis Point Share (BPS) Analysis By Product Type
13.2. Omega 3 Ingredients Market Size (US$ Mn) and Volume (MT) Analysis (2014-2018) & Forecast (2019-2027) By Product Type
13.2.1. Alpha-Linolenic Acid (ALA)
13.2.2. Eicosapentaenoic Acid (EPA)
13.2.3. Docosahexaneoic Acid (DHA)
13.3. Market Attractiveness Analysis By Product Type
14. Global Omega 3 Ingredients Market Analysis By Source
14.1. Introduction
14.1.1. Y-o-Y Growth Comparison By Source
14.1.2. Basis Point Share (BPS) Analysis By Source
14.2. Omega 3 Ingredients Market Size (US$ Mn) and Volume (MT) Analysis (2014-2018) & Forecast (2019-2027) By Source
14.2.1. Plant
14.2.1.1. Corn Oils
14.2.1.2. Safflower Oil
14.2.1.3. Sunflower Oil
14.2.1.4. Soybean Oil
14.2.1.5. Canola Oil
14.2.1.6. Flax Seed
14.2.1.7. Chia Seed
14.2.1.8. Nuts and Seeds
14.2.1.9. Others
14.2.2. Animal
14.2.2.1. Meat
14.2.2.2. Eggs
14.2.2.3. Dairy
14.2.2.4. Fish Oil
14.3. Market Attractiveness Analysis By Source
15. Global Omega 3 Ingredients Market Analysis By Application
15.1. Introduction
15.1.1. Y-o-Y Growth Comparison By Application
15.1.2. Basis Point Share (BPS) Analysis By Application
15.2. Omega 3 Ingredients Market Size (US$ Mn) and Volume (MT) Analysis (2014-2018) & Forecast (2019-2027) By Application
15.2.1. Food and beverage
15.2.1.1. Food Industry
15.2.1.1.1. Dairy & dessert
15.2.1.1.2. Bakery & Confectionary
15.2.1.1.3. Savory Snacks
15.2.1.1.4. Breakfast Cereals
15.2.1.1.5. Others
15.2.1.2. Beverage industry
15.2.1.2.1. Functional Drinks
15.2.1.2.2. Juices
15.2.1.2.3. Others
15.2.2. Pharmaceutical and Nutraceutical industry
15.2.3. Infant Formula
15.2.4. Animal Feed
15.3. Market Attractiveness Analysis By Application
16. Global Omega 3 Ingredients Market Analysis and Forecast, By Region
16.1. Introduction
16.1.1. Basis Point Share (BPS) Analysis By Region
16.1.2. Y-o-Y Growth Projections By Region
16.2. Omega 3 Ingredients Market Size (US$ Mn) and Volume (MT) & Forecast (2019-2027) Analysis By Region
16.2.1. North America
16.2.2. Europe
16.2.3. APEJ
16.2.4. Japan
16.2.5. Oceania
16.2.6. Latin America
16.2.7. Middle East and Africa
16.3. Market Attractiveness Analysis By Region
17. North America Omega 3 Ingredients Market Analysis and Forecast
17.1. Introduction
17.1.1. Basis Point Share (BPS) Analysis By Country
17.1.2. Y-o-Y Growth Projections By Country
17.2. Omega 3 Ingredients Market Size (Value (US$) and Volume (MT) Analysis (2013-2018) and Forecast (2019-2027)
17.2.1. Market Attractiveness By Country
17.2.1.1. U.S.
17.2.1.2. Canada
17.2.2. By Product Type
17.2.3. By Source
17.2.4. By Application
17.3. Market Attractiveness Analysis
17.3.1. By Country
17.3.2. By Product Type
17.3.3. By Source
17.3.4. By Application
17.4. Drivers and Restraints: Impact Analysis
18. Latin America Omega 3 Ingredients Market Analysis and Forecast
18.1. Introduction
18.1.1. Basis Point Share (BPS) Analysis By Country
18.1.2. Y-o-Y Growth Projections By Country
18.1.3. Key Regulations
18.2. Omega 3 Ingredients Market Size (Value (US$) and Volume (MT) Analysis (2013-2018) and Forecast (2019-2027)
18.2.1. By Country
18.2.1.1. Brazil
18.2.1.2. Mexico
18.2.1.3. Chile
18.2.1.4. Peru
18.2.1.5. Argentina
18.2.1.6. Rest of Latin America
18.2.2. By Product Type
18.2.3. By Source
18.2.4. By Application
18.3. Market Attractiveness Analysis
18.3.1. By Product Type
18.3.2. By Source
18.3.3. By Application
18.4. Drivers and Restraints: Impact Analysis
19. Europe Omega 3 Ingredients Market Analysis and Forecast
19.1. Introduction
19.1.1. Basis Point Share (BPS) Analysis By Country
19.1.2. Y-o-Y Growth Projections By Country
19.1.3. Key Regulations
19.2. Omega 3 Ingredients Market Size (Value (US$) and Volume (MT) Analysis (2013-2018) and Forecast (2019-2027)
19.2.1. By Country
19.2.1.1. EU-4 (Germany, France, Italy, Spain)
19.2.1.2. U.K.
19.2.1.3. BENELUX
19.2.1.4. Nordic
19.2.1.5. Russia
19.2.1.6. Poland
19.2.1.7. Rest of Europe
19.2.2. By Product Type
19.2.3. By Source
19.2.4. By Application
19.3. Market Attractiveness Analysis
19.3.1. By Product Type
19.3.2. By Source
19.3.3. By Application
19.4. Drivers and Restraints: Impact Analysis
20. APEJ Omega 3 Ingredients Market Analysis and Forecast
20.1. Introduction
20.1.1. Basis Point Share (BPS) Analysis By Country
20.1.2. Y-o-Y Growth Projections By Country
20.1.3. Key Regulations
20.2. Omega 3 Ingredients Market Size (Value (US$) and Volume (MT) Analysis (2013-2018) and Forecast (2019-2027)
20.2.1. By Country
20.2.1.1. China
20.2.1.2. India
20.2.1.3. South Korea
20.2.1.4. ASEAN
20.2.2. By Product Type
20.2.3. By Source
20.2.4. By Application
20.3. Market Attractiveness Analysis
20.3.1. By Product Type
20.3.2. By Source
20.3.3. By Application
20.4. Drivers and Restraints: Impact Analysis
21. Japan Omega 3 Ingredients Market Analysis and Forecast
21.1. Introduction
21.1.1. Basis Point Share (BPS) Analysis By Country
21.1.2. Y-o-Y Growth Projections By Country
21.1.3. Key Regulations
21.2. Omega 3 Ingredients Market Size (Value (US$) and Volume (MT) Analysis (2013-2018) and Forecast (2019-2027)
21.2.1. By Product Type
21.2.2. By Source
21.2.3. By Application
21.3. Market Attractiveness Analysis
21.3.1. By Product Type
21.3.2. By Source
21.3.3. By Application
21.4. Drivers and Restraints: Impact Analysis
22. Oceania Omega 3 Ingredients Market Analysis and Forecast
22.1. Introduction
22.1.1. Basis Point Share (BPS) Analysis By Country
22.1.2. Y-o-Y Growth Projections By Country
22.1.3. Key Regulations
22.2. Omega 3 Ingredients Market Size (Value (US$) and Volume (MT) Analysis (2013-2018) and Forecast (2019-2027)
22.2.1. By Product Type
22.2.2. By Source
22.2.3. By Application
22.3. Market Attractiveness Analysis
22.3.1. By Product Type
22.3.2. By Source
22.3.3. By Application
22.4. Drivers and Restraints: Impact Analysis
23. Middle East and Africa (MEA) Omega 3 Ingredients Market Analysis and Forecast
23.1. Introduction
23.1.1. Basis Point Share (BPS) Analysis By Country
23.1.2. Y-o-Y Growth Projections By Country
23.1.3. Key Regulations
23.2. Omega 3 Ingredients Market Size (Value (US$) and Volume (MT) Analysis (2013-2018) and Forecast (2019-2027)
23.2.1. By Country
23.2.1.1. GCC Countries
23.2.1.2. South Africa
23.2.1.3. North Africa
23.2.1.4. Rest of MEA
23.2.2. By Product Type
23.2.3. By Source
23.2.4. By Application
23.3. Market Attractiveness Analysis
23.3.1. By Product Type
23.3.2. By Source
23.3.3. By Application
23.4. Drivers and Restraints: Impact Analysis
24. Global Omega 3 Supplements Market Outlook
24.1. Global Omega 3 Supplements Market Analysis and Forecast
24.1.1. Market Size Analysis (2014-2018) and Forecast (2019-2027)
24.1.1.1. Market Value (US$ Mn) and Volume (Tons) and Y-o-Y Growth
24.1.1.2. Absolute $ Opportunity
24.1.2. Global Omega 3 Supplements Market Scenario Forecast (Optimistic, Likely and Conservative Market Conditions)
24.1.2.1. Forecast Factors and Relevance of Impact
24.1.2.2. Regional Omega 3 Supplements Market Business Performance Summary
24.2. Global Omega 3 Supplements Market Analysis By Product Type
24.2.1. Introduction
24.2.1.1. Y-o-Y Growth Comparison By Form Type
24.2.1.2. Basis Point Share (BPS) Analysis By Form Type
24.2.2. Omega 3 Supplements Market Size (US$ Mn) and Volume (MT) Analysis (2014-2018) & Forecast (2019-2027) By Form Type
24.2.2.1. Powder
24.2.2.2. Capsules
24.2.2.3. Others
24.2.3. Market Attractiveness Analysis By Form Type
24.3. Global Omega 3 Supplements Market Analysis By Distribution Channel
24.3.1. Introduction
24.3.1.1. Y-o-Y Growth Comparison By Distribution Channel
24.3.1.2. Basis Point Share (BPS) Analysis By Distribution Channel
24.3.2. Omega 3 Supplements Market Size (US$ Mn) and Volume (MT) Analysis (2014-2018) & Forecast (2019-2027) By Distribution Channel
24.3.2.1. Modern Trade
24.3.2.2. Convenience Store
24.3.2.3. Departmental Store
24.3.2.4. Drug Store
24.3.2.5. Online Stores
24.3.2.6. Other Sales Channel
24.3.3. Market Attractiveness Analysis By Distribution Channel
24.4. Global Omega 3 Supplements Market Analysis By Price Range
24.4.1. Introduction
24.4.1.1. Y-o-Y Growth Comparison By Price Range
24.4.1.2. Basis Point Share (BPS) Analysis By Price Range
24.4.2. Omega 3 Supplements Market Size (US$ Mn) and Volume (MT) Analysis (2014-2018) & Forecast (2019-2027) By Price Range
24.4.2.1. Below $10
24.4.2.2. $10 - $20
24.4.2.3. $20 - $50
24.4.2.4. $50 - $100
24.4.2.5. $250 - $500
24.4.2.6. $500 - $750
24.4.3. Market Attractiveness Analysis By Price Range
25. Competition Assessment
25.1. Global Omega 3 Ingredients Market Competition - a Dashboard View
25.2. Global Omega 3 Ingredients Market Structure Analysis
25.3. Global Omega 3 Ingredients Market Company Share Analysis
25.3.1. For Tier 1 Market Players, 2018
25.3.2. Company Market Share Analysis of Top 10 Players, By Region
25.4. Key Participants Market Presence (Intensity Mapping) by Region
26. Brand Assessment
26.1. Brand Identity (Brand as Product, Brand as Organization, Brand as Person, Brand as Symbol)
26.2. Omega 3 Ingredients Audience and Positioning (Demographic Segmentation, Geographic Segmentation, Psychographic Segmentation, Situational Segmentation)
26.3. Brand Strategy
27. Competition Deep-dive
27.1. Omega 3 Ingedient Companies
27.1.1. Croda International plc
27.1.2. BIOPROCESS ALGAE, LLC
27.1.3. Omega Protein Corporation
27.1.4. Pelagia AS (Epax Norway AS)
27.1.5. GC Rieber Oils AS
27.1.6. Pharma Marine AS
27.1.7. Copeinca ASA
27.1.8. Arista Industries Inc
27.1.9. NU-MEGA Ingredients Pty Ltd. (Clover Corporation)
27.1.10. Marine Ingredients, LLC.
27.1.11. Luhua Biomarine (Shandong) Co., Ltd
27.1.12. POLARIS Nutritional Lipids
27.1.13. Algaecytes
27.1.14. Qualitas Health
27.1.15. Barleans Organic Oils
27.1.16. Denomega Nutritional Oils
27.1.17. Qponics Limited
27.1.18. Cellana Inc.
27.1.19. Koninklijke DSM N.V.
27.1.20. Cargill Incorporated
27.1.21. Others (On Request)
27.2. Omega 3 Supplement Companies
27.2.1. QuattroMega Inc. (WHC)
27.2.2. Viva Naturals Inc.
27.2.3. Innovix Pharma Inc.
27.2.4. NutriGold Inc.
27.2.5. Omax Health, Inc.
27.2.6. Sancilio & Company, Inc.
27.2.7. Innovix Pharma Inc.
27.2.8. Nordic Naturals, Inc.
27.2.9. Life & Food Inc.
27.2.10. NOW Health Group, Inc.
27.2.11. DTI GmbH
27.2.12. Axis Labs, Inc.
27.2.13. General Nutrition Centers, Inc.
27.2.14. RB LLC.
27.2.15. Twinlab Corp.
27.2.16. Solgar Inc.
27.2.17. Carlson Laboratories, Inc.
27.2.18. Met-Rx Substrate Technology, Inc. Optimum Nutrition, Inc.
27.2.19. Others (On Request
27.3. Key Brands
27.3.1. Spring Valley
27.3.2. Nature's Bounty
27.3.3. Nature Made
27.3.4. MegaRed
27.3.5. Alfa
27.3.6. Carlson Labs
27.3.7. Sundown Naturals
27.3.8. L'il Critters
27.3.9. Vitafusion
27.3.10. Equate
27.3.11. NutriFlair
27.3.12. Great HealthWorks
27.3.13. TheraTears
27.3.14. Best Naturals
27.3.15. ChildLife
27.3.16. Nordic Naturals
27.3.17. Source Naturals
27.3.18. Others (On Request
27.4. Key Inclusions In Company Profiles
27.4.1. Overview
27.4.2. Product Portfolio
27.4.3. Sales Footprint
27.4.4. Channel Footprint
27.4.4.1. Distributors List
27.4.4.2. Sales Channel (Clients)
27.4.5. Strategy Overview
27.4.5.1. Marketing Strategy
27.4.5.2. Culture Strategy
27.4.5.3. Channel Strategy
27.4.6. SWOT Analysis
27.4.7. Financial Analysis
27.4.8. Revenue Share
27.4.8.1. By Product Type
27.4.8.2. By Region
27.4.9. Key Clients
27.4.10. Analyst Comments
28. Recommendation- Critical Success Factors
29. Research Methodology, Assumptions & Acronyms Used
List of Tables
Table 1: Global Omega 3 Ingredients Market Value (US$ Mn) Analysis and Forecast by Region, 2014-2027
Table 2: Global Omega 3 Ingredients Market Volume (MT) Analysis and Forecast by Region, 2014-2027
Table 3: Global Omega 3 Ingredients Market Value (US$ Mn) Analysis and Forecast by Ingredients, 2014-2027
Table 4: Global Omega 3 Ingredients Market Volume (MT) Analysis and Forecast by Ingredients, 2014-2027
Table 5: Global Omega 3 Ingredients Market Value (US$ Mn) Analysis and Forecast by Source, 2014-2027
Table 6: Global Omega 3 Ingredients Market Volume (MT) Analysis and Forecast by Source, 2014-2027
Table 7: Global Omega 3 Ingredients Market Value (US$ Mn) Analysis and Forecast by Application, 2014-2027
Table 8: Global Omega 3 Ingredients Market Value (US$ Mn) Analysis and Forecast by Application, 2014-2027
Table 9: Global Omega 3 Ingredients Market Volume (MT) Analysis and Forecast by Application, 2014-2027
Table 10: Global Omega 3 Ingredients Market Volume (MT) Analysis and Forecast by Application, 2014-2027
Table 11: North America Omega 3 Ingredients Market Value (US$ Mn) Analysis and Forecast by Country, 2014-2027
Table 12: North America Omega 3 Ingredients Market Volume (MT) Analysis and Forecast by Country, 2014-2027
Table 13: North America Omega 3 Ingredients Market Value (US$ Mn) Analysis and Forecast by End User, 2014-2027
Table 14: North America Omega 3 Ingredients Market Volume (MT) Analysis and Forecast by End User, 2014-2027
Table 15: North America Omega 3 Ingredients Market Value (US$ Mn) Analysis and Forecast by Source, 2014-2027
Table 16: North America Omega 3 Ingredients Market Volume (MT) Analysis and Forecast by Source, 2014-2027
Table 17: North America Omega 3 Ingredients Market Value (US$ Mn) Analysis and Forecast by Application, 2014-2027
Table 18: North America Omega 3 Ingredients Market Value (US$ Mn) Analysis and Forecast by Application, 2014-2027
Table 19: North America Omega 3 Ingredients Market Volume (MT) Analysis and Forecast by Application, 2014-2027
Table 20: North America Omega 3 Ingredients Market Volume (MT) Analysis and Forecast by Application, 2014-2027
Table 21: Europe Omega 3 Ingredients Market Value (US$ Mn) Analysis and Forecast by Country, 2014-2027
Table 22: Europe Omega 3 Ingredients Market Volume (MT) Analysis and Forecast by Country, 2014-2027
Table 23: Europe Omega 3 Ingredients Market Value (US$ Mn) Analysis and Forecast by Ingredients, 2014-2027
Table 24: Europe Omega 3 Ingredients Market Volume (MT) Analysis and Forecast by Ingredients, 2014-2027
Table 25: Europe Omega 3 Ingredients Market Value (US$ Mn) Analysis and Forecast by Source, 2014-2027
Table 26: Europe Omega 3 Ingredients Market Volume (MT) Analysis and Forecast by Source, 2014-2027
Table 27: Europe Omega 3 Ingredients Market Value (US$ Mn) Analysis and Forecast by Application, 2014-2027
Table 28: Europe Omega 3 Ingredients Market Value (US$ Mn) Analysis and Forecast by Application, 2014-2027
Table 29: Europe Omega 3 Ingredients Market Volume (MT) Analysis and Forecast by Application, 2014-2027
Table 30: Europe Omega 3 Ingredients Market Volume (MT) Analysis and Forecast by Application, 2014-2027
Table 31: Latin America Omega 3 Ingredients Market Value (US$ Mn) Analysis and Forecast by Country, 2014-2027
Table 32: Latin America Omega 3 Ingredients Market Volume (MT) Analysis and Forecast by Country, 2014-2027
Table 33: Latin America Omega 3 Ingredients Market Value (US$ Mn) Analysis and Forecast by Ingredients, 2014-2027
Table 34: Latin America Omega 3 Ingredients Market Volume (MT) Analysis and Forecast by Ingredients, 2014-2027
Table 35: Latin America Omega 3 Ingredients Market Value (US$ Mn) Analysis and Forecast by Source, 2014-2027
Table 36: Latin America Omega 3 Ingredients Market Volume (MT) Analysis and Forecast by Source, 2014-2027
Table 37: Latin America Omega 3 Ingredients Market Value (US$ Mn) Analysis and Forecast by Application, 2014-2027
Table 38: Latin America Omega 3 Ingredients Market Value (US$ Mn) Analysis and Forecast by Application, 2014-2027
Table 39: Latin America Omega 3 Ingredients Market Volume (MT) Analysis and Forecast by Application, 2014-2027
Table 40: Latin America Omega 3 Ingredients Market Volume (MT) Analysis and Forecast by Application, 2014-2027
Table 41: Asia Pacific Omega 3 Ingredients Market Value (US$ Mn) Analysis and Forecast by Country, 2014-2027
Table 42: Asia Pacific Omega 3 Ingredients Market Volume (MT) Analysis and Forecast by Country, 2014-2027
Table 43: Asia Pacific Omega 3 Ingredients Market Value (US$ Mn) Analysis and Forecast by Ingredients, 2014-2027
Table 44: Asia Pacific Omega 3 Ingredients Market Volume (MT) Analysis and Forecast by Ingredients, 2014-2027
Table 45: Asia Pacific Omega 3 Ingredients Market Value (US$ Mn) Analysis and Forecast by Source, 2014-2027
Table 46: Asia Pacific Omega 3 Ingredients Market Volume (MT) Analysis and Forecast by Source, 2014-2027
Table 47: Asia Pacific Omega 3 Ingredients Market Value (US$ Mn) Analysis and Forecast by Application, 2014-2027
Table 48: Asia Pacific Omega 3 Ingredients Market Value (US$ Mn) Analysis and Forecast by Application, 2014-2027
Table 49: Asia Pacific Omega 3 Ingredients Market Volume (MT) Analysis and Forecast by Application, 2014-2027
Table 50: Asia Pacific Omega 3 Ingredients Market Volume (MT) Analysis and Forecast by Application, 2014-2027
Table 51: Oceania Omega 3 Ingredients Market Value (US$ Mn) Analysis and Forecast by Ingredients, 2014-2027
Table 52: Oceania Omega 3 Ingredients Market Volume (MT) Analysis and Forecast by Ingredients, 2014-2027
Table 53: Oceania Omega 3 Ingredients Market Value (US$ Mn) Analysis and Forecast by Source, 2014-2027
Table 54: Oceania Omega 3 Ingredients Market Volume (MT) Analysis and Forecast by Source, 2014-2027
Table 55: Oceania Omega 3 Ingredients Market Value (US$ Mn) Analysis and Forecast by Application, 2014-2027
Table 56: Oceania Omega 3 Ingredients Market Value (US$ Mn) Analysis and Forecast by Application, 2014-2027
Table 57: Oceania Omega 3 Ingredients Market Volume (MT) Analysis and Forecast by Application, 2014-2027
Table 58: Oceania Omega 3 Ingredients Market Volume (MT) Analysis and Forecast by Application, 2014-2027
Table 59: Japan Omega 3 Ingredients Market Value (US$ Mn) Analysis and Forecast by Ingredients, 2014-2027
Table 60: Japan Omega 3 Ingredients Market Volume (MT) Analysis and Forecast by Ingredients, 2014-2027
Table 61: Japan Omega 3 Ingredients Market Value (US$ Mn) Analysis and Forecast by Source, 2014-2027
Table 62: Japan Omega 3 Ingredients Market Volume (MT) Analysis and Forecast by Source, 2014-2027
Table 63: Japan Omega 3 Ingredients Market Value (US$ Mn) Analysis and Forecast by Application, 2014-2027
Table 64: Japan Omega 3 Ingredients Market Value (US$ Mn) Analysis and Forecast by Application, 2014-2027
Table 65: Japan Omega 3 Ingredients Market Volume (MT) Analysis and Forecast by Application, 2014-2027
Table 66: Japan Omega 3 Ingredients Market Volume (MT) Analysis and Forecast by Application, 2014-2027
Table 67: MEA Omega 3 Ingredients Market Value (US$ Mn) Analysis and Forecast by Country, 2014-2027
Table 68: MEA Omega 3 Ingredients Market Volume (MT) Analysis and Forecast by Country, 2014-2027
Table 69: MEA Omega 3 Ingredients Market Value (US$ Mn) Analysis and Forecast by Ingredients, 2014-2027
Table 70: MEA Omega 3 Ingredients Market Volume (MT) Analysis and Forecast by Ingredients, 2014-2027
Table 71: MEA Omega 3 Ingredients Market Value (US$ Mn) Analysis and Forecast by Source, 2014-2027
Table 72: MEA Omega 3 Ingredients Market Volume (MT) Analysis and Forecast by Source, 2014-2027
Table 73: MEA Omega 3 Ingredients Market Value (US$ Mn) Analysis and Forecast by Application, 2014-2027
Table 74: MEA Omega 3 Ingredients Market Value (US$ Mn) Analysis and Forecast by Application, 2014-2027
Table 75: MEA Omega 3 Ingredients Market Volume (MT) Analysis and Forecast by Application, 2014-2027
Table 76: MEA Omega 3 Ingredients Market Volume (MT) Analysis and Forecast by Application, 2014-2027
List of Figures:
Figure 1: Global Omega 3 Ingredients Market Value (US$ Mn) and Volume (MT) Forecast, 2019–2027
Figure 2: Global Omega 3 Ingredients Market Absolute $ Opportunity (US$ Mn), 2019–2027
Figure 3: Global Omega 3 Ingredients Market Share (%) & BPS Analysis by Region, 2019 & 2027
Figure 4: Global Omega 3 Ingredients Market Y-o-Y Growth Rate (%) by Region, 2019-2027
Figure 5: Global Omega 3 Ingredients Market Value (US$ Mn) Analysis & Forecast by Region, 2019–2027
Figure 6: Global Omega 3 Ingredients Market Attractiveness Index by Region, 2019-2027
Figure 7: Global Omega 3 Ingredients Market Share (%) & BPS Analysis by Ingredients, 2019 & 2027
Figure 8: Global Omega 3 Ingredients Market Y-o-Y Growth Rate (%) by Ingredients, 2019-2027
Figure 9: Global Omega 3 Ingredients Market Value (US$ Mn) Analysis & Forecast by Ingredients, 2019–2027
Figure 10: Global Omega 3 Ingredients Market Attractiveness Index by Ingredients, 2019-2027
Figure 11: Global Omega 3 Ingredients Market Share (%) & BPS Analysis by Source, 2019 & 2027
Figure 12: Global Omega 3 Ingredients Market Y-o-Y Growth Rate (%) by Source, 2019-2027
Figure 13: Global Omega 3 Ingredients Market Value (US$ Mn) Analysis & Forecast by Source, 2019–2027
Figure 14: Global Omega 3 Ingredients Market Attractiveness Index by Source, 2019-2027
Figure 15: Global Omega 3 Ingredients Market Share (%) & BPS Analysis by Application, 2019 & 2027
Figure 16: Global Omega 3 Ingredients Market Y-o-Y Growth Rate (%) by Application, 2019-2027
Figure 17: Global Omega 3 Ingredients Market Value (US$ Mn) Analysis & Forecast by Application, 2019–2027
Figure 18: Global Omega 3 Ingredients Market Attractiveness Index by Application, 2019-2027
Figure 19: North America Omega 3 Ingredients Market Share (%) & BPS Analysis by Country, 2019 & 2027
Figure 20: North America Omega 3 Ingredients Market Y-o-Y Growth Rate (%) by Country, 2019-2027
Figure 21: North America Omega 3 Ingredients Market Attractiveness Index by Country, 2019-2027
Figure 22: North America Omega 3 Ingredients Market Share (%) & BPS Analysis by Ingredients, 2019 & 2027
Figure 23: North America Omega 3 Ingredients Market Y-o-Y Growth Rate (%) by Ingredients, 2019-2027
Figure 24: North America Omega 3 Ingredients Market Attractiveness Index by Ingredients, 2019-2027
Figure 25: North America Omega 3 Ingredients Market Share (%) & BPS Analysis by Source, 2019 & 2027
Figure 26: North America Omega 3 Ingredients Market Y-o-Y Growth Rate (%) by Source, 2019-2027
Figure 27: North America Omega 3 Ingredients Market Attractiveness Index by Source, 2019-2027
Figure 28: North America Omega 3 Ingredients Market Share (%) & BPS Analysis by Application, 2019 & 2027
Figure 29: North America Omega 3 Ingredients Market Y-o-Y Growth Rate (%) by Application, 2019-2027
Figure 30: North America Omega 3 Ingredients Market Attractiveness Index by Application, 2019-2027
Figure 31: Europe Omega 3 Ingredients Market Share (%) & BPS Analysis by Country, 2019 & 2027
Figure 32: Europe Omega 3 Ingredients Market Y-o-Y Growth Rate (%) by Country, 2019-2027
Figure 33: Europe Omega 3 Ingredients Market Attractiveness Index by Country, 2019-2027
Figure 34: Europe Omega 3 Ingredients Market Share (%) & BPS Analysis by Ingredients, 2019 & 2027
Figure 35: Europe Omega 3 Ingredients Market Y-o-Y Growth Rate (%) by Ingredients, 2019-2027
Figure 36: Europe Omega 3 Ingredients Market Attractiveness Index by Ingredients, 2019-2027
Figure 37: Europe Omega 3 Ingredients Market Share (%) & BPS Analysis by Source, 2019 & 2027
Figure 38: Europe Omega 3 Ingredients Market Y-o-Y Growth Rate (%) by Source, 2019-2027
Figure 39: Europe Omega 3 Ingredients Market Attractiveness Index by Source, 2019-2027
Figure 40: Europe Omega 3 Ingredients Market Share (%) & BPS Analysis by Application, 2019 & 2027
Figure 41: Europe Omega 3 Ingredients Market Y-o-Y Growth Rate (%) by Application, 2019-2027
Figure 42: Europe Omega 3 Ingredients Market Attractiveness Index by Application, 2019-2027
Figure 43: Latin America Omega 3 Ingredients Market Share (%) & BPS Analysis by Country, 2019 & 2027
Figure 44: Latin America Omega 3 Ingredients Market Y-o-Y Growth Rate (%) by Country, 2019-2027
Figure 45: Latin America Omega 3 Ingredients Market Attractiveness Index by Country, 2019-2027
Figure 46: Latin America Omega 3 Ingredients Market Share (%) & BPS Analysis by Ingredients, 2019 & 2027
Figure 47: Latin America Omega 3 Ingredients Market Y-o-Y Growth Rate (%) by Ingredients, 2019-2027
Figure 48: Latin America Omega 3 Ingredients Market Attractiveness Index by Ingredients, 2019-2027
Figure 49: Latin America Omega 3 Ingredients Market Share (%) & BPS Analysis by Source, 2019 & 2027
Figure 50: Latin America Omega 3 Ingredients Market Y-o-Y Growth Rate (%) by Source, 2019-2027
Figure 51: Latin America Omega 3 Ingredients Market Attractiveness Index by Source, 2019-2027
Figure 52: Latin America Omega 3 Ingredients Market Share (%) & BPS Analysis by Application, 2019 & 2027
Figure 53: Latin America Omega 3 Ingredients Market Y-o-Y Growth Rate (%) by Application, 2019-2027
Figure 54: Latin America Omega 3 Ingredients Market Attractiveness Index by Application, 2019-2027
Figure 55: Asia Pacific Omega 3 Ingredients Market Share (%) & BPS Analysis by Country, 2019 & 2027
Figure 56: Asia Pacific Omega 3 Ingredients Market Y-o-Y Growth Rate (%) by Country, 2019-2027
Figure 57: Asia Pacific Omega 3 Ingredients Market Attractiveness Index by Country, 2019-2027
Figure 58: Asia Pacific Omega 3 Ingredients Market Share (%) & BPS Analysis by Ingredients, 2019 & 2027
Figure 59: Asia Pacific Omega 3 Ingredients Market Y-o-Y Growth Rate (%) by Ingredients, 2019-2027
Figure 60: Asia Pacific Omega 3 Ingredients Market Attractiveness Index by Ingredients, 2019-2027
Figure 61: Asia Pacific Omega 3 Ingredients Market Share (%) & BPS Analysis by Source, 2019 & 2027
Figure 62: Asia Pacific Omega 3 Ingredients Market Y-o-Y Growth Rate (%) by Source, 2019-2027
Figure 63: Asia Pacific Omega 3 Ingredients Market Attractiveness Index by Source, 2019-2027
Figure 64: Asia Pacific Omega 3 Ingredients Market Share (%) & BPS Analysis by Application, 2019 & 2027
Figure 65: Asia Pacific Omega 3 Ingredients Market Y-o-Y Growth Rate (%) by Application, 2019-2027
Figure 66: Asia Pacific Omega 3 Ingredients Market Attractiveness Index by Application, 2019-2027
Figure 67: Oceania Omega 3 Ingredients Market Share (%) & BPS Analysis by Ingredients, 2019 & 2027
Figure 68: Oceania Omega 3 Ingredients Market Y-o-Y Growth Rate (%) by Ingredients, 2019-2027
Figure 69: Oceania Omega 3 Ingredients Market Attractiveness Index by Ingredients, 2019-2027
Figure 70: Oceania Omega 3 Ingredients Market Share (%) & BPS Analysis by Source, 2019 & 2027
Figure 71: Oceania Omega 3 Ingredients Market Y-o-Y Growth Rate (%) by Source, 2019-2027
Figure 72: Oceania Omega 3 Ingredients Market Attractiveness Index by Source, 2019-2027
Figure 73: Oceania Omega 3 Ingredients Market Share (%) & BPS Analysis by Application, 2019 & 2027
Figure 74: Oceania Omega 3 Ingredients Market Y-o-Y Growth Rate (%) by Application, 2019-2027
Figure 75: Oceania Omega 3 Ingredients Market Attractiveness Index by Application, 2019-2027
Figure 76: Japan Omega 3 Ingredients Market Share (%) & BPS Analysis by Ingredients, 2019 & 2027
Figure 77: Japan Omega 3 Ingredients Market Y-o-Y Growth Rate (%) by Ingredients, 2019-2027
Figure 78: Japan Omega 3 Ingredients Market Attractiveness Index by Ingredients, 2019-2027
Figure 79: Japan Omega 3 Ingredients Market Share (%) & BPS Analysis by Source, 2019 & 2027
Figure 80: Japan Omega 3 Ingredients Market Y-o-Y Growth Rate (%) by Source, 2019-2027
Figure 81: Japan Omega 3 Ingredients Market Attractiveness Index by Source, 2019-2027
Figure 82: Japan Omega 3 Ingredients Market Share (%) & BPS Analysis by Application, 2019 & 2027
Figure 83: Japan Omega 3 Ingredients Market Y-o-Y Growth Rate (%) by Application, 2019-2027
Figure 84: Japan Omega 3 Ingredients Market Attractiveness Index by Application, 2019-2027
Figure 85: MEA Omega 3 Ingredients Market Share (%) & BPS Analysis by Country, 2019 & 2027
Figure 86: MEA Omega 3 Ingredients Market Y-o-Y Growth Rate (%) by Country, 2019-2027
Figure 87: MEA Omega 3 Ingredients Market Attractiveness Index by Country, 2019-2027
Figure 88: MEA Omega 3 Ingredients Market Share (%) & BPS Analysis by Ingredients, 2019 & 2027
Figure 89: MEA Omega 3 Ingredients Market Y-o-Y Growth Rate (%) by Ingredients, 2019-2027
Figure 90: MEA Omega 3 Ingredients Market Attractiveness Index by Ingredients, 2019-2027
Figure 91: MEA Omega 3 Ingredients Market Share (%) & BPS Analysis by Source, 2019 & 2027
Figure 92: MEA Omega 3 Ingredients Market Y-o-Y Growth Rate (%) by Source, 2019-2027
Figure 93: MEA Omega 3 Ingredients Market Attractiveness Index by Source, 2019-2027
Figure 94: MEA Omega 3 Ingredients Market Share (%) & BPS Analysis by Application, 2019 & 2027
Figure 95: MEA Omega 3 Ingredients Market Y-o-Y Growth Rate (%) by Application, 2019-2027
Figure 96: MEA Omega 3 Ingredients Market Attractiveness Index by Application, 2019-2027
Copyright © Transparency Market Research, Inc. All Rights reserved
Trust Online

Omega 3 Ingredients Market Outlook, 2019-2027