
Reports
Reports
The contrast enhanced digital mammography (CEDM) market is witnessing change with the introduction of software in mammography equipment. Advancements in mammography software are anticipated to create incremental opportunities for healthcare companies. Mammography software is boosting clinical confidence and bolstering the efficiency of mammography systems. Companies in the contrast enhanced digital mammography (CEDM) market are increasing R&D to development equipment that automatically detect breast density with the help of AI-powered image processing and computer-aided detection.
Companies in the contrast enhanced digital mammography (CEDM) market are taking keen interest in applications that offer shorter time for diagnosis. Specificity and sensitivity are setting benchmark for gold standard diagnosis for breast cancer. Since examinations are being performed in a matter of few minutes, growing awareness about breast cancer has encouraged women to undergo screening for early diagnosis of the condition. Hence, companies in the market for contrast enhanced digital mammography (CEDM) are advancing to make improvements in image acquisition processes in order to virtually prevent the issue of artifacts caused due to patient motion.
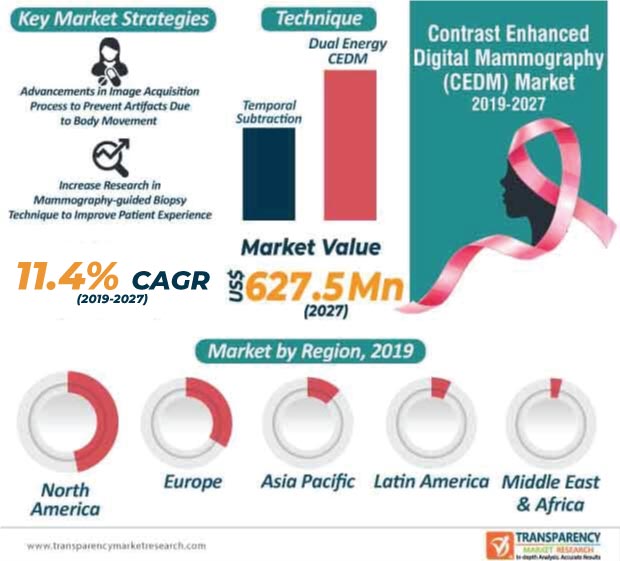
Interventional and biopsy procedures play a crucial role in the diagnosis of breast cancer. Hence, companies are increasing efforts in mammography-guided biopsy techniques. For instance, in November 2019, the U.S. provider of diagnostic imaging agents, GE Healthcare, announced the launch of first-of-its-kind contrast-enhanced mammography solution Serena Bright™ for biopsy.
Mammography-guided biopsy techniques are pervasively replacing conventional mammography and ultrasound in the contrast enhanced digital mammography (CEDM) market. Since breast MR is more time consuming, costly, and uncomfortable for patients, contrast-enhanced mammography solutions are gaining popularity in the market for contrast enhanced digital mammography.
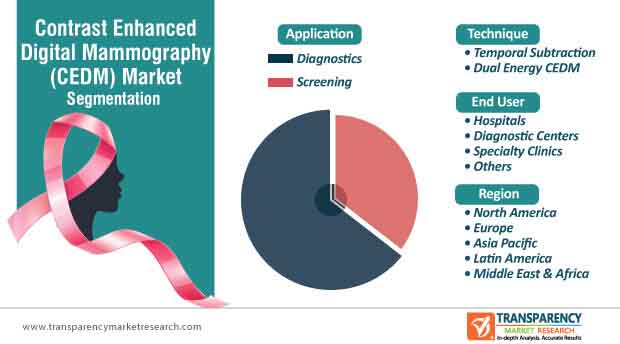
Contrast-enhanced mammography solutions are anticipated to become mainstream in the market for contrast enhanced digital mammography to diagnose lesions. This is justified since in 2018, diagnostics held a leading share of the contrast enhanced digital mammography (CEDM) market. Mammography-guided biopsy techniques are being highly publicized for their cost and time efficiency. Such novel techniques are anticipated to improve patient experience and outcomes. Thus, the mammography-guided biopsy technique is a potential alternative solution to traditional MR-guided breast biopsy.
Innovations in breast imaging are emerging in the market for contrast enhanced digital mammography (CEDM) for diagnostic evaluation of symptomatic cancer patients. On the other hand, contrast-enhanced mammography solutions are creating a significant impact on breast imaging capabilities. This is evident since the contrast enhanced digital mammography (CEDM) market is anticipated to grow at a striking CAGR of 11.4% during the forecast period. However, healthcare companies in the market landscape are facing tough competition due to the advancement in technology used in dedicated cone beam breast computed tomography (CBBCT).
CBBCT is found to eliminate painful compression and manipulation of the breast. This phenomena is common in digital mammography. Hence, companies in the contrast enhanced digital mammography (CEDM) market are focusing on technical improvements in mammography equipment. They are harnessing the advantages of AI to improve the image acquisition process. Market players are increasing are experimenting with advanced reconstruction algorithms in order to enhance micro-calcifications.
Early breast cancer detection is one of the key drivers for the contrast enhanced digital mammography (CEDM) market. Thus, companies are increasing their efficacy in dual-energy CEDM, owing to its advantages in contrast-to-noise ratio (CNR) and spatial resolution as compared to traditional CEDM approaches. Dual energy-based two-material decomposition approach is being highly publicized in the market for contrast enhanced digital mammography (CEDM). As such, dual energy CEDM technique segment is expected to lead the contrast enhanced digital mammography (CEDM) market and is estimated for aggressive growth during the forecast period.
Healthcare providers are adopting dual energy-based two-material decomposition method for iodine image calculation for better quantification of iodine contrast agent. In order to contribute toward better image quality, companies in the market for contrast enhanced digital mammography (CEDM) are increasing awareness about the combination of Munich Compact Light Source (MuCLS) with dual energy CEDM. Thus, novel combination is clinically outperforming techniques of traditional CEDM approaches, thus creating a scope for increased revenue opportunities for healthcare companies.
Analysts’ Viewpoint
The contrast enhanced digital mammography (CEDM) market is anticipated to grow exponentially and reach a value of US$ 627.5 Mn by the end of 2027. Companies in the market are increasing efforts to innovate in HD contrast enhanced spectral mammography tools to detect malignant lesions that are otherwise uncertain to detect in conventional mammography or ultrasound.
AI is emerging as a key tool for improving the image acquisition process. However, low sensitivity in mammography acts as a challenge for healthcare companies. Hence, companies are increasing R&D to enhance image quality with deep learning and advanced reconstruction algorithms. Companies should make investments to expand in Asia Pacific, since the region is projected for exponential growth during the forecast period.
Contrast enhanced digital mammography market to reach a value of US$ 627.5 Mn by the end of 2027
Contrast enhanced digital mammography market is projected to expand at a CAGR of 11.4% from 2019 to 2027
Contrast enhanced digital mammography market is driven by rise in prevalence of breast cancer
The dual energy CEDM segment dominated the global contrast enhanced digital mammography market in 2018 and the trend is projected to continue to during the forecast period
Key players in the global contrast enhanced digital mammography market include Hologic, Inc., Planmed Oy, General Electric Company, Siemens Healthineers, Allengers
1. Preface
1.1. Market Definition and Scope
1.2. Market Segmentation
1.3. Key Research Objectives
1.4. Research Highlights
2. Assumptions and Research Methodology
3. Executive Summary: Global Contrast Enhanced Digital Mammography Market
4. Market Overview
4.1. Introduction
4.2. Overview
4.3. Market Dynamics
4.3.1. Drivers
4.3.2. Restraints
4.3.3. Opportunities
4.4. Global Contrast Enhanced Digital Mammography Market Analysis and Forecast, 2017–2027
5. Market Outlook
5.1. Disease Epidemiology
5.2. Regulatory Scenario, by Region/globally
5.3. Technological Advancements
5.4. CEDM Image Acquisition Protocol
5.5. Screening Mammography Recommendations
5.6. Potential Clinical Application of CEDM
5.7. Economic Considerations for Contrast-Enhanced Mammography Implementation
6. Global Contrast Enhanced Digital Mammography Market Value (US$ Mn) Forecast, by Technique
6.1. Introduction
6.2. Global Contrast Enhanced Digital Mammography Market Value Forecast, by Technique, 2017–2027
6.2.1. Temporal Subtraction
6.2.2. Dual Energy CEDM
6.3. Global Contrast Enhanced Digital Mammography Market Attractiveness, by Technique
7. Global Contrast Enhanced Digital Mammography Market Value (US$ Mn) Forecast, by Application
7.1. Introduction
7.2. Global Contrast Enhanced Digital Mammography Market Value Forecast, by Application, 2017–2027
7.2.1. Screening
7.2.2. Diagnostics
7.3. Global Contrast Enhanced Digital Mammography Market Attractiveness, by Application
8. Global Contrast Enhanced Digital Mammography Market Value (US$ Mn) Forecast, by End-user
8.1. Introduction
8.2. Global Contrast Enhanced Digital Mammography Market Value Forecast, by End-user, 2017–2027
8.2.1. Hospitals
8.2.2. Diagnostic Centers
8.2.3. Specialty Clinics
8.2.4. Others
8.3. Global Contrast Enhanced Digital Mammography Market Attractiveness, by End-user
9. Global Contrast Enhanced Digital Mammography Market Value (US$ Mn) Forecast, by Region
9.1. Introduction
9.2. Contrast Enhanced Digital Mammography Market Value Forecast, by Region, 2017–2027
9.2.1. North America
9.2.2. Europe
9.2.3. Asia Pacific
9.2.4. Latin America
9.2.5. Middle East & Africa
9.3. Global Contrast Enhanced Digital Mammography Market Attractiveness, by Region
10. North America Contrast Enhanced Digital Mammography Market Analysis and Forecast
10.1. Introduction
10.2. North America Contrast Enhanced Digital Mammography Market Value Forecast, by Technique, 2017–2027
10.2.1. Temporal Subtraction
10.2.2. Dual Energy CEDM
10.3. North America Contrast Enhanced Digital Mammography Market Value Forecast, by Application, 2017–2027
10.3.1. Screening
10.3.2. Diagnostics
10.4. North America Contrast Enhanced Digital Mammography Market Value Forecast, by End-user, 2017–2027
10.4.1. Hospitals
10.4.2. Diagnostic Centers
10.4.3. Specialty Clinics
10.4.4. Others
10.5. North America Contrast Enhanced Digital Mammography Market Value Forecast, by Country, 2017–2027
10.5.1. U.S.
10.5.2. Canada
10.6. North America Contrast Enhanced Digital Mammography Market Attractiveness Analysis
10.6.1. By Technique
10.6.2. By Application
10.6.3. By End-user
10.6.4. By Country
11. Europe Contrast Enhanced Digital Mammography Market Analysis and Forecast
11.1. Introduction
11.2. Europe Contrast Enhanced Digital Mammography Market Value Forecast, by Technique, 2017–2027
11.2.1. Temporal Subtraction
11.2.2. Dual Energy CEDM
11.3. Europe Contrast Enhanced Digital Mammography Market Value Forecast, by Application, 2017–2027
11.3.1. Screening
11.3.2. Diagnostics
11.4. Europe Contrast Enhanced Digital Mammography Market Value Forecast, by End-user, 2017–2027
11.4.1. Hospitals
11.4.2. Diagnostic Centers
11.4.3. Specialty Clinics
11.4.4. Others
11.5. Europe Contrast Enhanced Digital Mammography Market Value Forecast, by Country/Sub-region, 2017–2027
11.5.1. Germany
11.5.2. U.K.
11.5.3. France
11.5.4. Spain
11.5.5. Italy
11.5.6. Rest of Europe
11.6. Europe Contrast Enhanced Digital Mammography Market Attractiveness Analysis
11.6.1. By Technique
11.6.2. By Application
11.6.3. By End-user
11.6.4. By Country/Sub-region
12. Asia Pacific Contrast Enhanced Digital Mammography Market Analysis and Forecast
12.1. Introduction
12.2. Asia Pacific Contrast Enhanced Digital Mammography Market Value Forecast, by Technique, 2017–2027
12.2.1. Temporal Subtraction
12.2.2. Dual Energy CEDM
12.3. Asia Pacific Contrast Enhanced Digital Mammography Market Value Forecast, by Application, 2017–2027
12.3.1. Screening
12.3.2. Diagnostics
12.4. Asia Pacific Contrast Enhanced Digital Mammography Market Value Forecast, by End-user, 2017–2027
12.4.1. Hospitals
12.4.2. Diagnostic Centers
12.4.3. Specialty Clinics
12.4.4. Others
12.5. Asia Pacific Contrast Enhanced Digital Mammography Market Value Forecast, by Country/Sub-region, 2017–2027
12.5.1. Japan
12.5.2. China
12.5.3. India
12.5.4. Australia & New Zealand
12.5.5. Rest of Asia Pacific
12.6. Asia Pacific Contrast Enhanced Digital Mammography Market Attractiveness Analysis
12.6.1. By Technique
12.6.2. By Application
12.6.3. By End-user
12.6.4. By Country/Sub-region
13. Latin America Contrast Enhanced Digital Mammography Market Analysis and Forecast
13.1. Introduction
13.2. Latin America Contrast Enhanced Digital Mammography Market Value Forecast, by Technique, 2017–2027
13.2.1. Temporal Subtraction
13.2.2. Dual Energy CEDM
13.3. Latin America Contrast Enhanced Digital Mammography Market Value Forecast, by Application, 2017–2027
13.3.1. Screening
13.3.2. Diagnostics
13.4. Latin America Contrast Enhanced Digital Mammography Market Value Forecast, by End-user, 2017–2027
13.4.1. Hospitals
13.4.2. Diagnostic Centers
13.4.3. Specialty Clinics
13.4.4. Others
13.5. Latin America Contrast Enhanced Digital Mammography Market Value Forecast, by Country/Sub-region, 2017–2027
13.5.1. Brazil
13.5.2. Mexico
13.5.3. Rest of Latin America
13.6. Latin America Contrast Enhanced Digital Mammography Market Attractiveness Analysis
13.6.1. By Technique
13.6.2. By Application
13.6.3. By End-user
13.6.4. By Country/Sub-region
14. Middle East & Africa Contrast Enhanced Digital Mammography Market Analysis and Forecast
14.1. Introduction
14.2. Middle East & Africa Contrast Enhanced Digital Mammography Market Value Forecast, by Technique, 2017–2027
14.2.1. Temporal Subtraction
14.2.2. Dual Energy CEDM
14.3. Middle East & Africa Contrast Enhanced Digital Mammography Market Value Forecast, by Application, 2017–2027
14.3.1. Screening
14.3.2. Diagnostics
14.4. Middle East & Africa Contrast Enhanced Digital Mammography Market Value Forecast, by End-user, 2017–2027
14.4.1. Hospitals
14.4.2. Diagnostic Centers
14.4.3. Specialty Clinics
14.4.4. Others
14.5. Middle East & Africa Contrast Enhanced Digital Mammography Market Value Forecast, by Country/Sub-region, 2017–2027
14.5.1. GCC Countries
14.5.2. South Africa
14.5.3. Rest of Middle East & Africa
14.6. Middle East & Africa Contrast Enhanced Digital Mammography Market Attractiveness Analysis
14.6.1. By Technique
14.6.2. By Application
14.6.3. By End-user
14.6.4. By Country/Sub-region
15. Competition Landscape
15.1. Global Contrast Enhanced Digital Mammography Market Share Analysis, by Company, 2018
15.2. Company Profiles
15.2.1. GE Healthcare
15.2.1.1. Company Description
15.2.1.2. Business Overview
15.2.1.3. Financial Overview
15.2.1.4. Strategic Overview
15.2.1.5. SWOT Analysis
15.2.2. Siemens Healthineers (Siemens AG)
15.2.2.1. Company Description
15.2.2.2. Business Overview
15.2.2.3. Financial Overview
15.2.2.4. Strategic Overview
15.2.2.5. SWOT Analysis
15.2.3. Allengers Medical Systems Limited
15.2.3.1. Company Description
15.2.3.2. Business Overview
15.2.3.3. Strategic Overview
15.2.3.4. SWOT Analysis
15.2.4. Planmed Oy
15.2.4.1. Company Description
15.2.4.2. Business Overview
15.2.4.3. Strategic Overview
15.2.4.4. SWOT Analysis
15.2.5. Hologic, Inc.
15.2.5.1. Company Description
15.2.5.2. Business Overview
15.2.5.3. Strategic Overview
15.2.5.4. SWOT Analysis
List of Tables
Table 01: Global Contrast Enhanced Digital Mammography (CEDM) Market Value (US$ Mn) Forecast, by Technique, 2017–2027
Table 02: Global Contrast Enhanced Digital Mammography (CEDM) Market Value (US$ Mn) Forecast, by Application, 2017–2027
Table 03: Global Contrast Enhanced Digital Mammography (CEDM) Market Value (US$ Mn) Forecast, by End-user, 2017–2027
Table 04: Global Contrast Enhanced Digital Mammography (CEDM) Market Value (US$ Mn) Forecast, by Region, 2017–2027
Table 05: North America Contrast Enhanced Digital Mammography (CEDM) Market Value (US$ Mn) Forecast, by Country, 2017–2027
Table 06: North America Contrast Enhanced Digital Mammography (CEDM) Market Value (US$ Mn) Forecast, by Technique, 2017–2027
Table 07: North America Contrast Enhanced Digital Mammography (CEDM) Market Value (US$ Mn) Forecast, by Application, 2017–2027
Table 08: North America Contrast Enhanced Digital Mammography (CEDM) Market Value (US$ Mn) Forecast, by End-user, 2017–2027
Table 09: Europe Contrast Enhanced Digital Mammography (CEDM) Market Value (US$ Mn) Forecast, by Country/Sub-region, 2017–2027
Table 10: Europe Contrast Enhanced Digital Mammography (CEDM) Market Value (US$ Mn) Forecast, by Technique, 2017–2027
Table 11: Europe Contrast Enhanced Digital Mammography (CEDM) Market Value (US$ Mn) Forecast, by Application, 2017–2027
Table 12: Europe Contrast Enhanced Digital Mammography (CEDM) Market Value (US$ Mn) Forecast, by End-user, 2017–2027
Table 13: Asia Pacific Contrast Enhanced Digital Mammography (CEDM) Market Value (US$ Mn) Forecast, by Country/Sub-region, 2017–2027
Table 14: Asia Pacific Contrast Enhanced Digital Mammography (CEDM) Market Value (US$ Mn) Forecast, by Technique, 2017–2027
Table 15: Asia Pacific Contrast Enhanced Digital Mammography (CEDM) Market Value (US$ Mn) Forecast, by Application, 2017–2027
Table 16: Asia Pacific Contrast Enhanced Digital Mammography (CEDM) Market Value (US$ Mn) Forecast, by End-user, 2017–2027
Table 17: Latin America Contrast Enhanced Digital Mammography (CEDM) Market Value (US$ Mn) Forecast, by Country/Sub-region, 2017–2027
Table 18: Latin America Contrast Enhanced Digital Mammography (CEDM) Market Value (US$ Mn) Forecast, by Technique, 2017–2027
Table 19: Latin America Contrast Enhanced Digital Mammography (CEDM) Market Value (US$ Mn) Forecast, by Application, 2017–2027
Table 20: Latin America Contrast Enhanced Digital Mammography (CEDM) Market Value (US$ Mn) Forecast, by End-user, 2017–2027
Table 21: Middle East & Africa Contrast Enhanced Digital Mammography (CEDM) Market Value (US$ Mn) Forecast, by Country/Sub-region, 2017–2027
Table 22: Middle East & Africa Contrast Enhanced Digital Mammography (CEDM) Market Value (US$ Mn) Forecast, by Technique, 2017–2027
Table 23: Middle East & Africa Contrast Enhanced Digital Mammography (CEDM) Market Value (US$ Mn) Forecast, by Application, 2017–2027
Table 24: Middle East & Africa Contrast Enhanced Digital Mammography (CEDM) Market Value (US$ Mn) Forecast, by End-user, 2017–2027
List of Figures
Figure 01: Global Contrast Enhanced Digital Mammography (CEDM) Market Value (US$ Mn) and Distribution, by Region, 2018 and 2027
Figure 02: Global contrast Enhanced Digital Mammography (CEDM) Market Revenue (US$ Mn), by Technique, 2018
Figure 03: Global contrast Enhanced Digital Mammography (CEDM) Market Revenue (US$ Mn), by Application, 2018
Figure 04: Global contrast Enhanced Digital Mammography (CEDM) Market Revenue, by End-user (US$ Mn), 2018
Figure 05: Global Contrast Enhanced Digital Mammography Market Value (US$ Mn) Forecast, 2017–2027
Figure 06: Global Contrast Enhanced Digital Mammography Market Value Share, by End-user, 2018
Figure 07: Global Contrast Enhanced Digital Mammography Market Value Share, by Technique, 2018
Figure 08: Global Contrast Enhanced Digital Mammography Market Value Share, by Application, 2018
Figure 09: Global Contrast Enhanced Digital Mammography Market Value Share, by Region, 2018
Figure 10: Global Contrast Enhanced Digital Mammography (CEDM) Market Value Share Analysis, by Technique, 2018 and 2027
Figure 11: Global Contrast Enhanced Digital Mammography (CEDM) Market Value (US$ Mn) Forecast and Y-o-Y Growth (%), by Temporal Subtraction, 2017–2027
Figure 12: Global Contrast Enhanced Digital Mammography (CEDM) Market Value (US$ Mn) Forecast and Y-o-Y Growth (%), by Dual Energy CEDM, 2017–2027
Figure 13: Global Contrast Enhanced Digital Mammography (CEDM) Market Attractiveness, by Technique, 2019–2027
Figure 14: Global Contrast Enhanced Digital Mammography (CEDM) Market Value Share (%), by Application, 2018 and 2027
Figure 15: Global Contrast Enhanced Digital Mammography (CEDM) Market Value (US$ Mn) Forecast and Y-o-Y Growth (%), by Screening, 2017–2027
Figure 16: Global Contrast Enhanced Digital Mammography (CEDM) Market Value (US$ Mn) Forecast and Y-o-Y Growth (%), by Diagnostics, 2017–2027
Figure 17: Global Contrast Enhanced Digital Mammography (CEDM) Market Attractiveness, by Application, 2019–2027
Figure 18: Global Contrast Enhanced Digital Mammography (CEDM) Market Value Share (%), by End-user, 2018 and 2027
Figure 19: Global Contrast Enhanced Digital Mammography (CEDM) Market Revenue (US$ Mn) Forecast and Y-o-Y Growth (%), by Hospitals, 2017–2027
Figure 20: Global Contrast Enhanced Digital Mammography (CEDM) Market Revenue (US$ Mn) Forecast and Y-o-Y Growth (%), by Diagnostic Centers, 2017–2027
Figure 21: Global Contrast Enhanced Digital Mammography (CEDM) Market Revenue (US$ Mn) Forecast and Y-o-Y Growth (%), by Specialty Clinics, 2017–2027
Figure 22: Global Contrast Enhanced Digital Mammography (CEDM) Market Revenue (US$ Mn) Forecast and Y-o-Y Growth (%), by Others, 2017–2027
Figure 23: Global Contrast Enhanced Digital Mammography (CEDM) Market Attractiveness, by End-user, 2019–2027
Figure 24: Global Contrast Enhanced Digital Mammography (CEDM) Market Value Share Analysis, by Region, 2018 and 2027
Figure 25: Global Contrast Enhanced Digital Mammography (CEDM) Market Attractiveness, by Region, 2019–2027
Figure 26: North America Contrast Enhanced Digital Mammography (CEDM) Market Value (US$ Mn) Forecast and Y-o-Y Growth (%) Projection, 2017–2027
Figure 27: North America Contrast Enhanced Digital Mammography (CEDM) Market Value Share (%) Analysis, by Country, 2018 and 2027
Figure 28: North America Contrast Enhanced Digital Mammography (CEDM) Market Attractiveness Analysis, by Country, 2019?2027
Figure 29: North America Contrast Enhanced Digital Mammography (CEDM) Market Value Share (%) Analysis, by Technique, 2018 and 2027
Figure 30: North America Contrast Enhanced Digital Mammography (CEDM) Market Attractiveness Analysis, by Technique, 2019–2027
Figure 31: North America Contrast Enhanced Digital Mammography (CEDM) Market Value Share (%) Analysis, by Application, 2018 and 2027
Figure 32: North America Contrast Enhanced Digital Mammography (CEDM) Market Attractiveness Analysis, by Application, 2019–2027
Figure 33: North America Contrast Enhanced Digital Mammography (CEDM) Market Value Share (%) Analysis, by End-user, 2018 and 2027
Figure 34: North America Contrast Enhanced Digital Mammography (CEDM) Market Attractiveness Analysis, by End-user, 2019–2027
Figure 35: Europe Contrast Enhanced Digital Mammography (CEDM) Market Value (US$ Mn) Forecast and Y-o-Y Growth (%) Projection, 2017–2027
Figure 36: Europe Contrast Enhanced Digital Mammography (CEDM) Market Value Share Analysis, by Country/Sub-region, 2018 and 2027
Figure 37: Europe Contrast Enhanced Digital Mammography (CEDM) Market Attractiveness Analysis, by Country/Sub-region, 2019?2027
Figure 38: Europe Contrast Enhanced Digital Mammography (CEDM) Market Value Share (%) Analysis, by Technique, 2018 and 2027
Figure 39: Europe Contrast Enhanced Digital Mammography (CEDM) Market Attractiveness Analysis, by Technique, 2019–2027
Figure 40: Europe Contrast Enhanced Digital Mammography (CEDM) Market Value Share (%) Analysis, by Application, 2018 and 2027
Figure 41: Europe Contrast Enhanced Digital Mammography (CEDM) Market Attractiveness Analysis, by Application, 2019–2027
Figure 42: Europe Contrast Enhanced Digital Mammography (CEDM) Market Value Share (%) Analysis, by End-user, 2018 and 2027
Figure 43: Europe Contrast Enhanced Digital Mammography (CEDM) Market Attractiveness Analysis, by End-user, 2019–2027
Figure 44: Asia Pacific Contrast Enhanced Digital Mammography (CEDM) Market Value (US$ Mn) Forecast and Y-o-Y Growth (%) Projection, 2017–2027
Figure 45: Asia Pacific Contrast Enhanced Digital Mammography (CEDM) Market Value Share Analysis, by Country/Sub-region, 2018 and 2027
Figure 46: Asia Pacific Contrast Enhanced Digital Mammography (CEDM) Market Attractiveness Analysis, by Country/Sub-region, 2019–2027
Figure 47: Asia Pacific Contrast Enhanced Digital Mammography (CEDM) Market Value Share (%) Analysis, by Technique, 2018 and 2027
Figure 48: Asia Pacific Contrast Enhanced Digital Mammography (CEDM) Market Attractiveness Analysis, by Technique, 2019–2027
Figure 49: Asia Pacific Contrast Enhanced Digital Mammography (CEDM) Market Value Share (%) Analysis, by Application, 2018 and 2027
Figure 50: Asia Pacific Contrast Enhanced Digital Mammography (CEDM) Market Attractiveness Analysis, by Application, 2019–2027
Figure 51: Asia Pacific Contrast Enhanced Digital Mammography (CEDM) Market Value Share (%) Analysis, by End-user, 2018 and 2027
Figure 52: Asia Pacific Contrast Enhanced Digital Mammography (CEDM) Market Attractiveness Analysis, by End-user, 2019–2027
Figure 53: highlight value share and attractiveness analyzes of the contrast enhanced digital mammography (CEDM) market in Asia Pacific, by End-user, from 2018 to 2027
Figure 54: Latin America Contrast Enhanced Digital Mammography (CEDM) Market Value (US$ Mn) Forecast and Y-o-Y Growth (%) Projection, 2017–2027
Figure 55: Latin America Contrast Enhanced Digital Mammography (CEDM) Market Value Share Analysis, by Country/Sub-region, 2018 and 2027
Figure 56: Latin America Contrast Enhanced Digital Mammography (CEDM) Market Attractiveness Analysis, by Country/Sub-region, 2019–2027
Figure 57: Latin America Contrast Enhanced Digital Mammography (CEDM) Market Value Share (%) Analysis, by Technique, 2018 and 2027
Figure 58: Latin America Contrast Enhanced Digital Mammography (CEDM) Market Attractiveness Analysis, by Technique, 2019–2027
Figure 59: Latin America Contrast Enhanced Digital Mammography (CEDM) Market Value Share (%) Analysis, by Application, 2018 and 2027
Figure 60: Latin America Contrast Enhanced Digital Mammography (CEDM) Market Attractiveness Analysis, by Application, 2019–2027
Figure 61: Latin America Contrast Enhanced Digital Mammography (CEDM) Market Value Share (%) Analysis, by End-user, 2018 and 2027
Figure 62: Latin America Contrast Enhanced Digital Mammography (CEDM) Market Attractiveness Analysis, by End-user, 2019–2027
Figure 63: Middle East & Africa Contrast Enhanced Digital Mammography (CEDM) Market Value (US$ Mn) Forecast and Y-o-Y Growth (%) Projection, 2017–2027
Figure 64: Middle East & Africa Contrast Enhanced Digital Mammography (CEDM) Market Value Share Analysis, by Country/Sub-region, 2018 and 2027
Figure 65: Middle East & Africa Contrast Enhanced Digital Mammography (CEDM) Market Attractiveness Analysis, by Country/Sub-region, 2019-2027
Figure 66: Middle East & Africa Contrast Enhanced Digital Mammography (CEDM) Market Value Share (%) Analysis, by Technique, 2018 and 2027
Figure 67: Middle East & Africa Contrast Enhanced Digital Mammography (CEDM) Market Attractiveness Analysis, by Technique, 2019–2027
Figure 68: Middle East & Africa Contrast Enhanced Digital Mammography (CEDM) Market Value Share (%) Analysis, by Application, 2018 and 2027
Figure 69: Middle East & Africa Contrast Enhanced Digital Mammography (CEDM) Market Attractiveness Analysis, by Application, 2019–2027
Figure 70: Middle East & Africa Contrast Enhanced Digital Mammography (CEDM) Market Value Share (%) Analysis, by End-user, 2018 and 2027
Figure 71: Middle East & Africa Contrast Enhanced Digital Mammography (CEDM) Market Attractiveness Analysis, by End-user, 2019–2027
Copyright © Transparency Market Research, Inc. All Rights reserved
Trust Online

Contrast Enhanced Digital Mammography (CEDM) Market