

Reports
Reports
The global gas turbine MRO market size was valued at USD 23.3 Billion in 2025 and is projected to reach USD 41.4 Billion by 2036, expanding at a CAGR of 5.5% from 2026 to 2036. Market growth is primarily driven by growing demand for reliable and flexible power generation and increasing integration of variable renewable power.
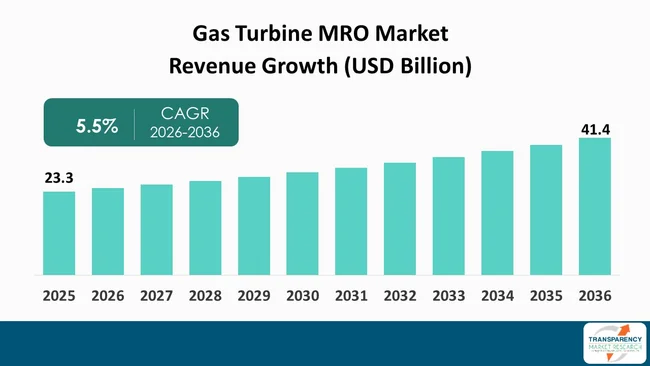
The global gas turbine MRO market is closely linked to the need to maintain turbine assets in a safe, reliable, efficient, and regulatory-compliant operating condition. MRO work covers checks, repair, full overhaul, parts swaps, performance tracking, and on-site support. This happens in power generation, aviation, oil and gas, and other industrial uses. Because of that, the market follows how the turbine fleet is used and how its equipment is doing over time.
In 2025, the International Energy Agency said gas-fired power output worldwide was set to rise by 1.3% and reach a record level. In this kind of setting, teams must keep a close eye on turbine condition and plan upkeep ahead of time. The focus is strong when gas plants provide power that can be called on when needed. Gas turbine MRO providers support both planned maintenance and corrective interventions to reduce unplanned downtime and maintain equipment availability. This can cut the chance of downtime tied to equipment, guard key parts, and help plants keep running well even when demand shifts.
The market is also shaped by how power systems are changing. Flexible generation remains important as power grids incorporate increasing volumes of variable renewable energy. That means maintenance plans have to account for how units start and stop, how load swings, how parts wear down, how well combustion works, and what must be inspected. As a result, maintenance strategies are increasingly shifting beyond fixed calendar-based intervals toward condition-based approaches.
Overall, gas turbine MRO demand is linked to asset reliability, safety, operating efficiency, regulatory compliance, and the economics of extending equipment service life. Service providers that combine field expertise, component repair, diagnostics, and planned overhaul capabilities can address different maintenance requirements across turbine applications and operating environments. Maintenance planning remains important here.
Gas turbine MRO encompasses maintenance, repair, inspection, refurbishment, and overhaul activities required to maintain turbine reliability and performance throughout the equipment lifecycle. The scope can include turbine parts, support systems, control elements, combustion hardware, compressors, hot section parts, and other related components. Work is often scheduled for planned shutdowns. Certain maintenance activities are performed based on equipment condition and operating data. Other tasks are done when a problem is found and a fix is required. The timing depends on the turbine state and on what the operation needs.
Gas Turbine MRO is used in many places. Common settings are power plants that produce electricity. It is also used in aviation, oil and gas operations, marine fleets, and industrial sites. The exact needs shift with turbine type and design. They also depend on how often the unit runs, the operating environment, and the fuel being burned. Maintenance choices, local rules, and how fast spare parts or components can be sourced all play a role.
The market includes original equipment manufacturers, independent service providers, component-repair specialists, and in-house maintenance organizations. Maintenance organizations are part of the mix as well. Maintenance practices are evolving with the adoption of digital monitoring, remote diagnostics, advanced inspection techniques, and improved repair technologies. Together, these changes help teams plan jobs with more care. They also help operators keep units dependable and available. Safety is a key goal, too. Lifecycle cost control is another major driver for how the work is carried out.
| Attribute | Detail |
|---|---|
| Global Gas Turbine MRO Market Drivers |
|
Growing demand for reliable and flexible electricity generation is supporting gas turbine MRO activity across both aging and newer power-generation fleets. Gas turbines can run when needed and can also help when wind and solar output swings. When demand and supply shift, frequent cycling and variable loading can increase thermal and mechanical stress on turbine components. That is why upkeep plans matter. They help manage wear, heat stress, combustion problems, compressor fouling, and parts that slowly degrade
In 2025, the U.S. Energy Information Administration said natural gas made up about 41% of U.S. utility scale electricity. This number is not a worldwide view. Still, it shows how important gas fired generation is in a large market. That level of use means there is a steady need for inspection, repair, overhaul, and performance-restoration services that support plant output.
Gas turbine MRO is also driven by how plants are run. More wind and solar on the grid can force dispatchable plants to change their output more often. That can affect loading, start stop cycles, and what maintenance is required. Because of this, operators look for maintenance steps that fit the way the unit runs and the history of the machine.
For Gas Turbine MRO providers, this environment creates demand for planned outages, field services, component repair, hot-section inspection, borescope inspection, combustion-system work, and performance restoration. Providers with capabilities across maintenance stages can support plant owners in reducing unplanned interruptions and maintaining equipment availability. The continuing role of gas-fired generation therefore remains an important structural driver for Gas Turbine MRO activity. This is particularly relevant for facilities where dependable generation is required to support grid stability, industrial loads, and essential services during periods of changing electricity demand. Maintenance planning remains important.
Increasing penetration of variable renewable energy is changing the operating profiles of dispatchable gas-fired power plants. When wind or solar output swings, gas turbines may be used to balance fluctuations in electricity supply. That shift affects maintenance because crews have to plan for changing loads, more starts and stops, and different operating heat levels. As a result, there is more need for Gas Turbine MRO work that centers on checking condition, inspecting parts, fixing issues, and managing how well units perform.
In 2026, the International Renewable Energy Agency said global power systems will need about three times more flexibility by 2030 than they had at the end of the prior decade. The point is that the whole system will face greater variability in daily electricity supply and demand as renewable share rises. Gas Turbine MRO can support this by keeping turbine units reliable and ready to meet dispatch changes.
MRO programs can also reduce the technical strain that comes from cycling and uneven loading. Maintenance staff may look at combustion parts, turbine blades, coatings, bearings, compressors, control equipment, and other key items based on what the unit has done over time. Monitoring and inspection tools can add useful data, which helps plan maintenance and prepare for outages. The changing generation mix creates an opportunity for service providers to expand beyond traditional overhaul work. Gas Turbine MRO companies can develop remote monitoring, predictive maintenance, digital inspection, field repair, component refurbishment, and lifecycle support services. These capabilities can help operators coordinate maintenance with grid requirements while reducing downtime. As power systems continue to incorporate variable renewable generation, the maintenance needs of flexible gas turbine fleets are expected to remain an important market consideration. Maintenance planning remains important.
Digital and condition-based maintenance represents a significant opportunity for the gas turbine MRO market. Many operators want maintenance choices that match how the equipment is actually performing. Operators are increasingly seeking maintenance strategies based on actual asset condition rather than fixed service intervals alone. With digital tools, companies can bring together operating readings, inspection results, vibration signals, combustion metrics, and prior work history. This can help identify potential faults at an earlier stage instead of waiting for a scheduled check.
In 2026, the International Civil Aviation Organization pointed to the ongoing push for electronic aircraft maintenance records. It also noted more support from digital maintenance information for aircraft, engines, propellers, and related parts. Even if that note is aimed at aviation, the same shift matters for turbine service groups. Clear and traceable technical data can help teams plan work, write better documentation, handle certification tasks, and manage equipment over their full life.
Another opportunity is the expansion of lifecycle support. Instead of focusing only on major overhaul events, service companies can provide inspection, repair, monitoring, parts support, technical advisory services, and performance restoration throughout the operating period. This broader model can create recurring engagement with turbine owners and operators. As turbine fleets face changing operating requirements, digital and condition-based Gas Turbine MRO services can become an important part of maintenance planning.
| Attribute | Detail |
|---|---|
| Dominant Segment |
|
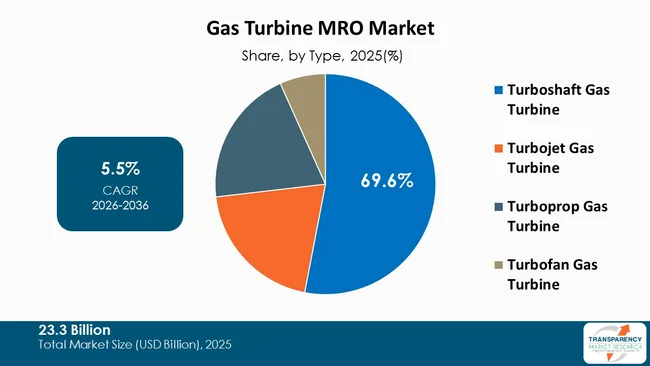
The Global Gas Turbine MRO Market covers maintenance requirements across turbojet gas turbine, turboprop gas turbine, turbofan gas turbine, and turboshaft gas turbine applications. Each segment has different operating characteristics, duty cycles, and service requirements. Turbojet and turbofan systems are strongly associated with aviation applications, while turboprop systems serve aircraft requiring propeller-based propulsion. Turboshaft systems are used where turbine power is transferred through a shaft for helicopters, marine propulsion, and industrial equipment.
Within the market segmentation supplied for this report, Turboshaft Gas Turbine is identified as the dominant segment with 69.6% of the market share. This figure should be treated as the provided market dataset value because an equivalent current market-share figure could not be independently verified by an official government, international organization, or industry-association source.
The global gas turbine MRO market across these segments requires specialized inspection, component repair, overhaul, testing, and technical support. Service requirements can differ according to turbine architecture, operating environment, load profile, and maintenance regulations. Gas turbine MRO providers therefore need segment-specific technical capabilities, qualified personnel, repair expertise, component access, and maintenance documentation. Digital monitoring and condition-based maintenance can further support Gas Turbine MRO planning across the four turbine categories.
| Attribute | Detail |
|---|---|
| Leading Region |
|
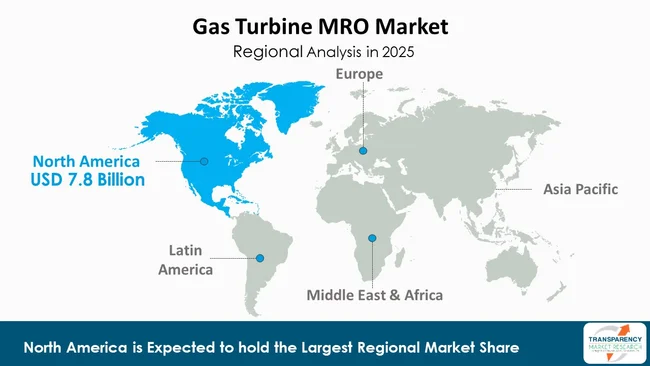
The global gas turbine MRO market is segmented into North America, Europe, Asia Pacific, Latin America, and the Middle East and Africa. Local demand is shaped by several factors. They are the installed turbine fleet, power needs, air travel, oil and gas work, industrial sites, maintenance rules, and the presence of service support.
North America dominated the global gas turbine MRO market in 2025, accounting for approximately 33.7% of total market revenue. It comes from the market data provided. It is not backed by a clear check from an official government body, a global organization, or a named industry group. Official energy reporting also points to the value of gas fired electricity in North America.
Gas turbine MRO in North America covers upkeep for power generation turbines, aircraft engines, and industrial units. Europe is known for strong technical skills and rule-based controls. Asia Pacific has a wide mix of power generation assets, aviation needs, and industrial operations. Latin America plus the Middle East and Africa still need Gas Turbine MRO for power and other energy related uses. Regional demand is influenced by installed turbine capacity, utilization rates, technical standards, local service capabilities, operating environments, and maintenance strategies.
GE Vernova, Siemens Energy, Mitsubishi Power, MTU Aero Engines, EthosEnergy, Kawasaki Heavy Industries, Ansaldo Energia, Solar Turbines, Baker Hughes, Sulzer, Rolls-Royce, RWG (Rolls-Wood Group), Patria, Harbin Electric International, Bharat Heavy Electricals Limited (BHEL), MAN Energy Solutions, Pratt & Whitney, Vericor Power Systems, Wood Group, Taqa Arabia Services are among the prominent companies profiled in the global gas turbine MRO market report.
Each of these companies has been profiled in the gas turbine MRO market report based on parameters such as company overview, business strategies, financial overview, business segments, product portfolio, and recent developments.
| Attribute | Detail |
|---|---|
| Market Size Value in 2025 (Base Year) | USD 23.3 Billion |
| Market Forecast Value in 2036 | USD 41.4 Billion |
| Growth Rate (CAGR 2026 to 2036) | 5.5% |
| Forecast Period | 2026-2036 |
| Historical data Available for | 2021-2025 |
| Quantitative Units | USD Billion for Value |
| Gas Turbine MRO Market Analysis | Global qualitative analysis includes drivers, restraints, opportunities, key trends, key market indicators, Porter’s Five Forces analysis, value chain analysis, SWOT analysis, etc. At the regional level, qualitative analysis includes key trends, price trends, and key supplier analysis. |
| Competition Landscape |
|
| Format | Electronic (PDF) + Excel |
| Market Segmentations | By Type
|
| Regions Covered |
|
| Countries Covered |
|
| Companies Profiled |
|
| Customization Scope | Available upon request |
| Pricing | Available upon request |
The global gas turbine MRO market was valued at USD 23.3 Billion in 2025.
The global gas turbine MRO industry is projected to reach USD 41.4 Billion by 2036.
Key drivers include growing demand for reliable and flexible power generation and increasing integration of variable renewable power.
The global gas turbine MRO market is anticipated to expand at a CAGR of 5.5% from 2026 to 2036.
GE Vernova, Siemens Energy, Mitsubishi Power, MTU Aero Engines, EthosEnergy, Kawasaki Heavy Industries, Ansaldo Energia, Solar Turbines, Baker Hughes, Sulzer, Rolls-Royce, RWG (Rolls-Wood Group), Patria, Harbin Electric International, Bharat Heavy Electricals Limited (BHEL), MAN Energy Solutions, Pratt & Whitney, Vericor Power Systems, Wood Group, and Taqa Arabia Services are among the prominent companies profiled in the global gas turbine MRO market report.
Table 01: Global Gas Turbine MRO Market Value (USD Billion) Projection, By Type 2021 to 2036
Table 02: Global Gas Turbine MRO Market Value (USD Billion) Projection, By Capacity 2021 to 2036
Table 03: Global Gas Turbine MRO Market Value (USD Billion) Projection, By Service Type 2021 to 2036
Table 04: Global Gas Turbine MRO Market Value (USD Billion) Projection, By Component Type 2021 to 2036
Table 05: Global Gas Turbine MRO Market Value (USD Billion) Projection, By Application 2021 to 2036
Table 06: Global Gas Turbine MRO Market Value (USD Billion) Projection, By End-use Industry 2021 to 2036
Table 07: Global Gas Turbine MRO Market Value (USD Billion) Projection, By Service Provider 2021 to 2036
Table 08: Global Gas Turbine MRO Market Value (USD Billion) Projection, By Region 2021 to 2036
Table 09: North America Gas Turbine MRO Market Value (USD Billion) Projection, By Type 2021 to 2036
Table 10: North America Gas Turbine MRO Market Value (USD Billion) Projection, By Capacity 2021 to 2036
Table 11: North America Gas Turbine MRO Market Value (USD Billion) Projection, By Service Type 2021 to 2036
Table 12: North America Gas Turbine MRO Market Value (USD Billion) Projection, By Component Type 2021 to 2036
Table 13: North America Gas Turbine MRO Market Value (USD Billion) Projection, By Application 2021 to 2036
Table 14: North America Gas Turbine MRO Market Value (USD Billion) Projection, By End-use Industry 2021 to 2036
Table 15: North America Gas Turbine MRO Market Value (USD Billion) Projection, By Service Provider 2021 to 2036
Table 16: North America Gas Turbine MRO Market Value (USD Billion) Projection, By Country 2021 to 2036
Table 17: U.S. Gas Turbine MRO Market Value (USD Billion) Projection, By Type 2021 to 2036
Table 18: U.S. Gas Turbine MRO Market Value (USD Billion) Projection, By Capacity 2021 to 2036
Table 19: U.S. Gas Turbine MRO Market Value (USD Billion) Projection, By Service Type 2021 to 2036
Table 20: U.S. Gas Turbine MRO Market Value (USD Billion) Projection, By Component Type 2021 to 2036
Table 21: U.S. Gas Turbine MRO Market Value (USD Billion) Projection, By Application 2021 to 2036
Table 22: U.S. Gas Turbine MRO Market Value (USD Billion) Projection, By End-use Industry 2021 to 2036
Table 23: U.S. Gas Turbine MRO Market Value (USD Billion) Projection, By Service Provider 2021 to 2036
Table 24: Canada Gas Turbine MRO Market Value (USD Billion) Projection, By Type 2021 to 2036
Table 25: Canada Gas Turbine MRO Market Value (USD Billion) Projection, By Capacity 2021 to 2036
Table 26: Canada Gas Turbine MRO Market Value (USD Billion) Projection, By Service Type 2021 to 2036
Table 27: Canada Gas Turbine MRO Market Value (USD Billion) Projection, By Component Type 2021 to 2036
Table 28: Canada Gas Turbine MRO Market Value (USD Billion) Projection, By Application 2021 to 2036
Table 29: Canada Gas Turbine MRO Market Value (USD Billion) Projection, By End-use Industry 2021 to 2036
Table 30: Canada Gas Turbine MRO Market Value (USD Billion) Projection, By Service Provider 2021 to 2036
Table 31: Europe Gas Turbine MRO Market Value (USD Billion) Projection, By Type 2021 to 2036
Table 32: Europe Gas Turbine MRO Market Value (USD Billion) Projection, By Capacity 2021 to 2036
Table 33: Europe Gas Turbine MRO Market Value (USD Billion) Projection, By Service Type 2021 to 2036
Table 34: Europe Gas Turbine MRO Market Value (USD Billion) Projection, By Component Type 2021 to 2036
Table 35: Europe Gas Turbine MRO Market Value (USD Billion) Projection, By Application 2021 to 2036
Table 36: Europe Gas Turbine MRO Market Value (USD Billion) Projection, By End-use Industry 2021 to 2036
Table 37: Europe Gas Turbine MRO Market Value (USD Billion) Projection, By Service Provider 2021 to 2036
Table 38: Europe Gas Turbine MRO Market Value (USD Billion) Projection, By Country 2021 to 2036
Table 39: U.K. Gas Turbine MRO Market Value (USD Billion) Projection, By Type 2021 to 2036
Table 40: U.K. Gas Turbine MRO Market Value (USD Billion) Projection, By Capacity 2021 to 2036
Table 41: U.K. Gas Turbine MRO Market Value (USD Billion) Projection, By Service Type 2021 to 2036
Table 42: U.K. Gas Turbine MRO Market Value (USD Billion) Projection, By Component Type 2021 to 2036
Table 43: U.K. Gas Turbine MRO Market Value (USD Billion) Projection, By Application 2021 to 2036
Table 44: U.K. Gas Turbine MRO Market Value (USD Billion) Projection, By End-use Industry 2021 to 2036
Table 45: U.K. Gas Turbine MRO Market Value (USD Billion) Projection, By Service Provider 2021 to 2036
Table 46: Germany Gas Turbine MRO Market Value (USD Billion) Projection, By Type 2021 to 2036
Table 47: Germany Gas Turbine MRO Market Value (USD Billion) Projection, By Capacity 2021 to 2036
Table 48: Germany Gas Turbine MRO Market Value (USD Billion) Projection, By Service Type 2021 to 2036
Table 49: Germany Gas Turbine MRO Market Value (USD Billion) Projection, By Component Type 2021 to 2036
Table 50: Germany Gas Turbine MRO Market Value (USD Billion) Projection, By Application 2021 to 2036
Table 51: Germany Gas Turbine MRO Market Value (USD Billion) Projection, By End-use Industry 2021 to 2036
Table 52: Germany Gas Turbine MRO Market Value (USD Billion) Projection, By Service Provider 2021 to 2036
Table 53: France Gas Turbine MRO Market Value (USD Billion) Projection, By Type 2021 to 2036
Table 54: France Gas Turbine MRO Market Value (USD Billion) Projection, By Capacity 2021 to 2036
Table 55: France Gas Turbine MRO Market Value (USD Billion) Projection, By Service Type 2021 to 2036
Table 56: France Gas Turbine MRO Market Value (USD Billion) Projection, By Component Type 2021 to 2036
Table 57: France Gas Turbine MRO Market Value (USD Billion) Projection, By Application 2021 to 2036
Table 58: France Gas Turbine MRO Market Value (USD Billion) Projection, By End-use Industry 2021 to 2036
Table 59: France Gas Turbine MRO Market Value (USD Billion) Projection, By Service Provider 2021 to 2036
Table 60: Italy Gas Turbine MRO Market Value (USD Billion) Projection, By Type 2021 to 2036
Table 61: Italy Gas Turbine MRO Market Value (USD Billion) Projection, By Capacity 2021 to 2036
Table 62: Italy Gas Turbine MRO Market Value (USD Billion) Projection, By Service Type 2021 to 2036
Table 63: Italy Gas Turbine MRO Market Value (USD Billion) Projection, By Component Type 2021 to 2036
Table 64: Italy Gas Turbine MRO Market Value (USD Billion) Projection, By Application 2021 to 2036
Table 65: Italy Gas Turbine MRO Market Value (USD Billion) Projection, By End-use Industry 2021 to 2036
Table 66: Italy Gas Turbine MRO Market Value (USD Billion) Projection, By Service Provider 2021 to 2036
Table 67: Spain Gas Turbine MRO Market Value (USD Billion) Projection, By Type 2021 to 2036
Table 68: Spain Gas Turbine MRO Market Value (USD Billion) Projection, By Capacity 2021 to 2036
Table 69: Spain Gas Turbine MRO Market Value (USD Billion) Projection, By Service Type 2021 to 2036
Table 70: Spain Gas Turbine MRO Market Value (USD Billion) Projection, By Component Type 2021 to 2036
Table 71: Spain Gas Turbine MRO Market Value (USD Billion) Projection, By Application 2021 to 2036
Table 72: Spain Gas Turbine MRO Market Value (USD Billion) Projection, By End-use Industry 2021 to 2036
Table 73: Spain Gas Turbine MRO Market Value (USD Billion) Projection, By Service Provider 2021 to 2036
Table 74: The Netherlands Gas Turbine MRO Market Value (USD Billion) Projection, By Type 2021 to 2036
Table 75: The Netherlands Gas Turbine MRO Market Value (USD Billion) Projection, By Capacity 2021 to 2036
Table 76: The Netherlands Gas Turbine MRO Market Value (USD Billion) Projection, By Service Type 2021 to 2036
Table 77: The Netherlands Gas Turbine MRO Market Value (USD Billion) Projection, By Component Type 2021 to 2036
Table 78: The Netherlands Gas Turbine MRO Market Value (USD Billion) Projection, By Application 2021 to 2036
Table 79: The Netherlands Gas Turbine MRO Market Value (USD Billion) Projection, By End-use Industry 2021 to 2036
Table 80: The Netherlands Gas Turbine MRO Market Value (USD Billion) Projection, By Service Provider 2021 to 2036
Table 81: Asia Pacific Gas Turbine MRO Market Value (USD Billion) Projection, By Type 2021 to 2036
Table 82: Asia Pacific Gas Turbine MRO Market Value (USD Billion) Projection, By Capacity 2021 to 2036
Table 83: Asia Pacific Gas Turbine MRO Market Value (USD Billion) Projection, By Service Type 2021 to 2036
Table 84: Asia Pacific Gas Turbine MRO Market Value (USD Billion) Projection, By Component Type 2021 to 2036
Table 85: Asia Pacific Gas Turbine MRO Market Value (USD Billion) Projection, By Application 2021 to 2036
Table 86: Asia Pacific Gas Turbine MRO Market Value (USD Billion) Projection, By End-use Industry 2021 to 2036
Table 87: Asia Pacific Gas Turbine MRO Market Value (USD Billion) Projection, By Service Provider 2021 to 2036
Table 88: Asia Pacific Gas Turbine MRO Market Value (USD Billion) Projection, By Country 2021 to 2036
Table 89: China Gas Turbine MRO Market Value (USD Billion) Projection, By Type 2021 to 2036
Table 90: China Gas Turbine MRO Market Value (USD Billion) Projection, By Capacity 2021 to 2036
Table 91: China Gas Turbine MRO Market Value (USD Billion) Projection, By Service Type 2021 to 2036
Table 92: China Gas Turbine MRO Market Value (USD Billion) Projection, By Component Type 2021 to 2036
Table 93: China Gas Turbine MRO Market Value (USD Billion) Projection, By Application 2021 to 2036
Table 94: China Gas Turbine MRO Market Value (USD Billion) Projection, By End-use Industry 2021 to 2036
Table 95: China Gas Turbine MRO Market Value (USD Billion) Projection, By Service Provider 2021 to 2036
Table 96: India Gas Turbine MRO Market Value (USD Billion) Projection, By Type 2021 to 2036
Table 97: India Gas Turbine MRO Market Value (USD Billion) Projection, By Capacity 2021 to 2036
Table 98: India Gas Turbine MRO Market Value (USD Billion) Projection, By Service Type 2021 to 2036
Table 99: India Gas Turbine MRO Market Value (USD Billion) Projection, By Component Type 2021 to 2036
Table 100: India Gas Turbine MRO Market Value (USD Billion) Projection, By Application 2021 to 2036
Table 101: India Gas Turbine MRO Market Value (USD Billion) Projection, By End-use Industry 2021 to 2036
Table 102: India Gas Turbine MRO Market Value (USD Billion) Projection, By Service Provider 2021 to 2036
Table 103: Japan Gas Turbine MRO Market Value (USD Billion) Projection, By Type 2021 to 2036
Table 104: Japan Gas Turbine MRO Market Value (USD Billion) Projection, By Capacity 2021 to 2036
Table 105: Japan Gas Turbine MRO Market Value (USD Billion) Projection, By Service Type 2021 to 2036
Table 106: Japan Gas Turbine MRO Market Value (USD Billion) Projection, By Component Type 2021 to 2036
Table 107: Japan Gas Turbine MRO Market Value (USD Billion) Projection, By Application 2021 to 2036
Table 108: Japan Gas Turbine MRO Market Value (USD Billion) Projection, By End-use Industry 2021 to 2036
Table 109: Japan Gas Turbine MRO Market Value (USD Billion) Projection, By Service Provider 2021 to 2036
Table 110: Australia Gas Turbine MRO Market Value (USD Billion) Projection, By Type 2021 to 2036
Table 111: Australia Gas Turbine MRO Market Value (USD Billion) Projection, By Capacity 2021 to 2036
Table 112: Australia Gas Turbine MRO Market Value (USD Billion) Projection, By Service Type 2021 to 2036
Table 113: Australia Gas Turbine MRO Market Value (USD Billion) Projection, By Component Type 2021 to 2036
Table 114: Australia Gas Turbine MRO Market Value (USD Billion) Projection, By Application 2021 to 2036
Table 115: Australia Gas Turbine MRO Market Value (USD Billion) Projection, By End-use Industry 2021 to 2036
Table 116: Australia Gas Turbine MRO Market Value (USD Billion) Projection, By Service Provider 2021 to 2036
Table 117: South Korea Gas Turbine MRO Market Value (USD Billion) Projection, By Type 2021 to 2036
Table 118: South Korea Gas Turbine MRO Market Value (USD Billion) Projection, By Capacity 2021 to 2036
Table 119: South Korea Gas Turbine MRO Market Value (USD Billion) Projection, By Service Type 2021 to 2036
Table 120: South Korea Gas Turbine MRO Market Value (USD Billion) Projection, By Component Type 2021 to 2036
Table 121: South Korea Gas Turbine MRO Market Value (USD Billion) Projection, By Application 2021 to 2036
Table 122: South Korea Gas Turbine MRO Market Value (USD Billion) Projection, By End-use Industry 2021 to 2036
Table 123: South Korea Gas Turbine MRO Market Value (USD Billion) Projection, By Service Provider 2021 to 2036
Table 124: ASEAN Gas Turbine MRO Market Value (USD Billion) Projection, By Type 2021 to 2036
Table 125: ASEAN Gas Turbine MRO Market Value (USD Billion) Projection, By Capacity 2021 to 2036
Table 126: ASEAN Gas Turbine MRO Market Value (USD Billion) Projection, By Service Type 2021 to 2036
Table 127: ASEAN Gas Turbine MRO Market Value (USD Billion) Projection, By Component Type 2021 to 2036
Table 128: ASEAN Gas Turbine MRO Market Value (USD Billion) Projection, By Application 2021 to 2036
Table 129: ASEAN Gas Turbine MRO Market Value (USD Billion) Projection, By End-use Industry 2021 to 2036
Table 130: ASEAN Gas Turbine MRO Market Value (USD Billion) Projection, By Service Provider 2021 to 2036
Table 131: Middle East & Africa Gas Turbine MRO Market Value (USD Billion) Projection, By Type 2021 to 2036
Table 132: Middle East & Africa Gas Turbine MRO Market Value (USD Billion) Projection, By Capacity 2021 to 2036
Table 133: Middle East & Africa Gas Turbine MRO Market Value (USD Billion) Projection, By Service Type 2021 to 2036
Table 134: Middle East & Africa Gas Turbine MRO Market Value (USD Billion) Projection, By Component Type 2021 to 2036
Table 135: Middle East & Africa Gas Turbine MRO Market Value (USD Billion) Projection, By Application 2021 to 2036
Table 136: Middle East & Africa Gas Turbine MRO Market Value (USD Billion) Projection, By End-use Industry 2021 to 2036
Table 137: Middle East & Africa Gas Turbine MRO Market Value (USD Billion) Projection, By Service Provider 2021 to 2036
Table 138: Middle East & Africa Gas Turbine MRO Market Value (USD Billion) Projection, By Country 2021 to 2036
Table 139: GCC Countries Gas Turbine MRO Market Value (USD Billion) Projection, By Type 2021 to 2036
Table 140: GCC Countries Gas Turbine MRO Market Value (USD Billion) Projection, By Capacity 2021 to 2036
Table 141: GCC Countries Gas Turbine MRO Market Value (USD Billion) Projection, By Service Type 2021 to 2036
Table 142: GCC Countries Gas Turbine MRO Market Value (USD Billion) Projection, By Component Type 2021 to 2036
Table 143: GCC Countries Gas Turbine MRO Market Value (USD Billion) Projection, By Application 2021 to 2036
Table 144: GCC Countries Gas Turbine MRO Market Value (USD Billion) Projection, By End-use Industry 2021 to 2036
Table 145: GCC Countries Gas Turbine MRO Market Value (USD Billion) Projection, By Service Provider 2021 to 2036
Table 146: South Africa Gas Turbine MRO Market Value (USD Billion) Projection, By Type 2021 to 2036
Table 147: South Africa Gas Turbine MRO Market Value (USD Billion) Projection, By Capacity 2021 to 2036
Table 148: South Africa Gas Turbine MRO Market Value (USD Billion) Projection, By Service Type 2021 to 2036
Table 149: South Africa Gas Turbine MRO Market Value (USD Billion) Projection, By Component Type 2021 to 2036
Table 150: South Africa Gas Turbine MRO Market Value (USD Billion) Projection, By Application 2021 to 2036
Table 151: South Africa Gas Turbine MRO Market Value (USD Billion) Projection, By End-use Industry 2021 to 2036
Table 152: South Africa Gas Turbine MRO Market Value (USD Billion) Projection, By Service Provider 2021 to 2036
Table 153: Latin America Gas Turbine MRO Market Value (USD Billion) Projection, By Type 2021 to 2036
Table 154: Latin America Gas Turbine MRO Market Value (USD Billion) Projection, By Capacity 2021 to 2036
Table 155: Latin America Gas Turbine MRO Market Value (USD Billion) Projection, By Service Type 2021 to 2036
Table 156: Latin America Gas Turbine MRO Market Value (USD Billion) Projection, By Component Type 2021 to 2036
Table 157: Latin America Gas Turbine MRO Market Value (USD Billion) Projection, By Application 2021 to 2036
Table 158: Latin America Gas Turbine MRO Market Value (USD Billion) Projection, By End-use Industry 2021 to 2036
Table 159: Latin America Gas Turbine MRO Market Value (USD Billion) Projection, By Service Provider 2021 to 2036
Table 160: Latin America Gas Turbine MRO Market Value (USD Billion) Projection, By Country 2021 to 2036
Table 161: Brazil Gas Turbine MRO Market Value (USD Billion) Projection, By Type 2021 to 2036
Table 162: Brazil Gas Turbine MRO Market Value (USD Billion) Projection, By Capacity 2021 to 2036
Table 163: Brazil Gas Turbine MRO Market Value (USD Billion) Projection, By Service Type 2021 to 2036
Table 164: Brazil Gas Turbine MRO Market Value (USD Billion) Projection, By Component Type 2021 to 2036
Table 165: Brazil Gas Turbine MRO Market Value (USD Billion) Projection, By Application 2021 to 2036
Table 166: Brazil Gas Turbine MRO Market Value (USD Billion) Projection, By End-use Industry 2021 to 2036
Table 167: Brazil Gas Turbine MRO Market Value (USD Billion) Projection, By Service Provider 2021 to 2036
Table 168: Mexico Gas Turbine MRO Market Value (USD Billion) Projection, By Type 2021 to 2036
Table 169: Mexico Gas Turbine MRO Market Value (USD Billion) Projection, By Capacity 2021 to 2036
Table 170: Mexico Gas Turbine MRO Market Value (USD Billion) Projection, By Service Type 2021 to 2036
Table 171: Mexico Gas Turbine MRO Market Value (USD Billion) Projection, By Component Type 2021 to 2036
Table 172: Mexico Gas Turbine MRO Market Value (USD Billion) Projection, By Application 2021 to 2036
Table 173: Mexico Gas Turbine MRO Market Value (USD Billion) Projection, By End-use Industry 2021 to 2036
Table 174: Mexico Gas Turbine MRO Market Value (USD Billion) Projection, By Service Provider 2021 to 2036
Table 175: Argentina Gas Turbine MRO Market Value (USD Billion) Projection, By Type 2021 to 2036
Table 176: Argentina Gas Turbine MRO Market Value (USD Billion) Projection, By Capacity 2021 to 2036
Table 177: Argentina Gas Turbine MRO Market Value (USD Billion) Projection, By Service Type 2021 to 2036
Table 178: Argentina Gas Turbine MRO Market Value (USD Billion) Projection, By Component Type 2021 to 2036
Table 179: Argentina Gas Turbine MRO Market Value (USD Billion) Projection, By Application 2021 to 2036
Table 180: Argentina Gas Turbine MRO Market Value (USD Billion) Projection, By End-use Industry 2021 to 2036
Table 181: Argentina Gas Turbine MRO Market Value (USD Billion) Projection, By Service Provider 2021 to 2036
Figure 01: Global Gas Turbine MRO Market Value (USD Billion) Projection, By Type 2021 to 2036
Figure 02: Global Gas Turbine MRO Market Incremental Opportunities (USD Billion) Forecast, By Type 2026 to 2036
Figure 03: Global Gas Turbine MRO Market Value (USD Billion) Projection, By Capacity 2021 to 2036
Figure 04: Global Gas Turbine MRO Market Incremental Opportunities (USD Billion) Forecast, By Capacity 2026 to 2036
Figure 05: Global Gas Turbine MRO Market Value (USD Billion) Projection, By Service Type 2021 to 2036
Figure 06: Global Gas Turbine MRO Market Incremental Opportunities (USD Billion) Forecast, By Service Type 2026 to 2036
Figure 07: Global Gas Turbine MRO Market Value (USD Billion) Projection, By Component Type 2021 to 2036
Figure 08: Global Gas Turbine MRO Market Incremental Opportunities (USD Billion) Forecast, By Component Type 2026 to 2036
Figure 09: Global Gas Turbine MRO Market Value (USD Billion) Projection, By Application 2021 to 2036
Figure 10: Global Gas Turbine MRO Market Incremental Opportunities (USD Billion) Forecast, By Application 2026 to 2036
Figure 11: Global Gas Turbine MRO Market Value (USD Billion) Projection, By End-use Industry 2021 to 2036
Figure 12: Global Gas Turbine MRO Market Incremental Opportunities (USD Billion) Forecast, By End-use Industry 2026 to 2036
Figure 13: Global Gas Turbine MRO Market Value (USD Billion) Projection, By Service Provider 2021 to 2036
Figure 14: Global Gas Turbine MRO Market Incremental Opportunities (USD Billion) Forecast, By Service Provider 2026 to 2036
Figure 15: Global Gas Turbine MRO Market Value (USD Billion) Projection, By Region 2021 to 2036
Figure 16: Global Gas Turbine MRO Market Incremental Opportunities (USD Billion) Forecast, By Region 2026 to 2036
Figure 17: North America Gas Turbine MRO Market Value (USD Billion) Projection, By Type 2021 to 2036
Figure 18: North America Gas Turbine MRO Market Incremental Opportunities (USD Billion) Forecast, By Type 2026 to 2036
Figure 19: North America Gas Turbine MRO Market Value (USD Billion) Projection, By Capacity 2021 to 2036
Figure 20: North America Gas Turbine MRO Market Incremental Opportunities (USD Billion) Forecast, By Capacity 2026 to 2036
Figure 21: North America Gas Turbine MRO Market Value (USD Billion) Projection, By Service Type 2021 to 2036
Figure 22: North America Gas Turbine MRO Market Incremental Opportunities (USD Billion) Forecast, By Service Type 2026 to 2036
Figure 23: North America Gas Turbine MRO Market Value (USD Billion) Projection, By Component Type 2021 to 2036
Figure 24: North America Gas Turbine MRO Market Incremental Opportunities (USD Billion) Forecast, By Component Type 2026 to 2036
Figure 25: North America Gas Turbine MRO Market Value (USD Billion) Projection, By Application 2021 to 2036
Figure 26: North America Gas Turbine MRO Market Incremental Opportunities (USD Billion) Forecast, By Application 2026 to 2036
Figure 27: North America Gas Turbine MRO Market Value (USD Billion) Projection, By End-use Industry 2021 to 2036
Figure 28: North America Gas Turbine MRO Market Incremental Opportunities (USD Billion) Forecast, By End-use Industry 2026 to 2036
Figure 29: North America Gas Turbine MRO Market Value (USD Billion) Projection, By Service Provider 2021 to 2036
Figure 30: North America Gas Turbine MRO Market Incremental Opportunities (USD Billion) Forecast, By Service Provider 2026 to 2036
Figure 31: North America Gas Turbine MRO Market Value (USD Billion) Projection, By Country 2021 to 2036
Figure 32: North America Gas Turbine MRO Market Incremental Opportunities (USD Billion) Forecast, By Country 2026 to 2036
Figure 33: U.S. Gas Turbine MRO Market Value (USD Billion) Projection, By Type 2021 to 2036
Figure 34: U.S. Gas Turbine MRO Market Incremental Opportunities (USD Billion) Forecast, By Type 2026 to 2036
Figure 35: U.S. Gas Turbine MRO Market Value (USD Billion) Projection, By Capacity 2021 to 2036
Figure 36: U.S. Gas Turbine MRO Market Incremental Opportunities (USD Billion) Forecast, By Capacity 2026 to 2036
Figure 37: U.S. Gas Turbine MRO Market Value (USD Billion) Projection, By Service Type 2021 to 2036
Figure 38: U.S. Gas Turbine MRO Market Incremental Opportunities (USD Billion) Forecast, By Service Type 2026 to 2036
Figure 39: U.S. Gas Turbine MRO Market Value (USD Billion) Projection, By Component Type 2021 to 2036
Figure 40: U.S. Gas Turbine MRO Market Incremental Opportunities (USD Billion) Forecast, By Component Type 2026 to 2036
Figure 41: U.S. Gas Turbine MRO Market Value (USD Billion) Projection, By Application 2021 to 2036
Figure 42: U.S. Gas Turbine MRO Market Incremental Opportunities (USD Billion) Forecast, By Application 2026 to 2036
Figure 43: U.S. Gas Turbine MRO Market Value (USD Billion) Projection, By End-use Industry 2021 to 2036
Figure 44: U.S. Gas Turbine MRO Market Incremental Opportunities (USD Billion) Forecast, By End-use Industry 2026 to 2036
Figure 45: U.S. Gas Turbine MRO Market Value (USD Billion) Projection, By Service Provider 2021 to 2036
Figure 46: U.S. Gas Turbine MRO Market Incremental Opportunities (USD Billion) Forecast, By Service Provider 2026 to 2036
Figure 47: Canada Gas Turbine MRO Market Value (USD Billion) Projection, By Type 2021 to 2036
Figure 48: Canada Gas Turbine MRO Market Incremental Opportunities (USD Billion) Forecast, By Type 2026 to 2036
Figure 49: Canada Gas Turbine MRO Market Value (USD Billion) Projection, By Capacity 2021 to 2036
Figure 50: Canada Gas Turbine MRO Market Incremental Opportunities (USD Billion) Forecast, By Capacity 2026 to 2036
Figure 51: Canada Gas Turbine MRO Market Value (USD Billion) Projection, By Service Type 2021 to 2036
Figure 52: Canada Gas Turbine MRO Market Incremental Opportunities (USD Billion) Forecast, By Service Type 2026 to 2036
Figure 53: Canada Gas Turbine MRO Market Value (USD Billion) Projection, By Component Type 2021 to 2036
Figure 54: Canada Gas Turbine MRO Market Incremental Opportunities (USD Billion) Forecast, By Component Type 2026 to 2036
Figure 55: Canada Gas Turbine MRO Market Value (USD Billion) Projection, By Application 2021 to 2036
Figure 56: Canada Gas Turbine MRO Market Incremental Opportunities (USD Billion) Forecast, By Application 2026 to 2036
Figure 57: Canada Gas Turbine MRO Market Value (USD Billion) Projection, By End-use Industry 2021 to 2036
Figure 58: Canada Gas Turbine MRO Market Incremental Opportunities (USD Billion) Forecast, By End-use Industry 2026 to 2036
Figure 59: Canada Gas Turbine MRO Market Value (USD Billion) Projection, By Service Provider 2021 to 2036
Figure 60: Canada Gas Turbine MRO Market Incremental Opportunities (USD Billion) Forecast, By Service Provider 2026 to 2036
Figure 61: Europe Gas Turbine MRO Market Value (USD Billion) Projection, By Type 2021 to 2036
Figure 62: Europe Gas Turbine MRO Market Incremental Opportunities (USD Billion) Forecast, By Type 2026 to 2036
Figure 63: Europe Gas Turbine MRO Market Value (USD Billion) Projection, By Capacity 2021 to 2036
Figure 64: Europe Gas Turbine MRO Market Incremental Opportunities (USD Billion) Forecast, By Capacity 2026 to 2036
Figure 65: Europe Gas Turbine MRO Market Value (USD Billion) Projection, By Service Type 2021 to 2036
Figure 66: Europe Gas Turbine MRO Market Incremental Opportunities (USD Billion) Forecast, By Service Type 2026 to 2036
Figure 67: Europe Gas Turbine MRO Market Value (USD Billion) Projection, By Component Type 2021 to 2036
Figure 68: Europe Gas Turbine MRO Market Incremental Opportunities (USD Billion) Forecast, By Component Type 2026 to 2036
Figure 69: Europe Gas Turbine MRO Market Value (USD Billion) Projection, By Application 2021 to 2036
Figure 70: Europe Gas Turbine MRO Market Incremental Opportunities (USD Billion) Forecast, By Application 2026 to 2036
Figure 71: Europe Gas Turbine MRO Market Value (USD Billion) Projection, By End-use Industry 2021 to 2036
Figure 72: Europe Gas Turbine MRO Market Incremental Opportunities (USD Billion) Forecast, By End-use Industry 2026 to 2036
Figure 73: Europe Gas Turbine MRO Market Value (USD Billion) Projection, By Service Provider 2021 to 2036
Figure 74: Europe Gas Turbine MRO Market Incremental Opportunities (USD Billion) Forecast, By Service Provider 2026 to 2036
Figure 75: Europe Gas Turbine MRO Market Value (USD Billion) Projection, By Country 2021 to 2036
Figure 76: Europe Gas Turbine MRO Market Incremental Opportunities (USD Billion) Forecast, By Country 2026 to 2036
Figure 77: U.K. Gas Turbine MRO Market Value (USD Billion) Projection, By Type 2021 to 2036
Figure 78: U.K. Gas Turbine MRO Market Incremental Opportunities (USD Billion) Forecast, By Type 2026 to 2036
Figure 79: U.K. Gas Turbine MRO Market Value (USD Billion) Projection, By Capacity 2021 to 2036
Figure 80: U.K. Gas Turbine MRO Market Incremental Opportunities (USD Billion) Forecast, By Capacity 2026 to 2036
Figure 81: U.K. Gas Turbine MRO Market Value (USD Billion) Projection, By Service Type 2021 to 2036
Figure 82: U.K. Gas Turbine MRO Market Incremental Opportunities (USD Billion) Forecast, By Service Type 2026 to 2036
Figure 83: U.K. Gas Turbine MRO Market Value (USD Billion) Projection, By Component Type 2021 to 2036
Figure 84: U.K. Gas Turbine MRO Market Incremental Opportunities (USD Billion) Forecast, By Component Type 2026 to 2036
Figure 85: U.K. Gas Turbine MRO Market Value (USD Billion) Projection, By Application 2021 to 2036
Figure 86: U.K. Gas Turbine MRO Market Incremental Opportunities (USD Billion) Forecast, By Application 2026 to 2036
Figure 87: U.K. Gas Turbine MRO Market Value (USD Billion) Projection, By End-use Industry 2021 to 2036
Figure 88: U.K. Gas Turbine MRO Market Incremental Opportunities (USD Billion) Forecast, By End-use Industry 2026 to 2036
Figure 89: U.K. Gas Turbine MRO Market Value (USD Billion) Projection, By Service Provider 2021 to 2036
Figure 90: U.K. Gas Turbine MRO Market Incremental Opportunities (USD Billion) Forecast, By Service Provider 2026 to 2036
Figure 91: Germany Gas Turbine MRO Market Value (USD Billion) Projection, By Type 2021 to 2036
Figure 92: Germany Gas Turbine MRO Market Incremental Opportunities (USD Billion) Forecast, By Type 2026 to 2036
Figure 93: Germany Gas Turbine MRO Market Value (USD Billion) Projection, By Capacity 2021 to 2036
Figure 94: Germany Gas Turbine MRO Market Incremental Opportunities (USD Billion) Forecast, By Capacity 2026 to 2036
Figure 95: Germany Gas Turbine MRO Market Value (USD Billion) Projection, By Service Type 2021 to 2036
Figure 96: Germany Gas Turbine MRO Market Incremental Opportunities (USD Billion) Forecast, By Service Type 2026 to 2036
Figure 97: Germany Gas Turbine MRO Market Value (USD Billion) Projection, By Component Type 2021 to 2036
Figure 98: Germany Gas Turbine MRO Market Incremental Opportunities (USD Billion) Forecast, By Component Type 2026 to 2036
Figure 99: Germany Gas Turbine MRO Market Value (USD Billion) Projection, By Application 2021 to 2036
Figure 100: Germany Gas Turbine MRO Market Incremental Opportunities (USD Billion) Forecast, By Application 2026 to 2036
Figure 101: Germany Gas Turbine MRO Market Value (USD Billion) Projection, By End-use Industry 2021 to 2036
Figure 102: Germany Gas Turbine MRO Market Incremental Opportunities (USD Billion) Forecast, By End-use Industry 2026 to 2036
Figure 103: Germany Gas Turbine MRO Market Value (USD Billion) Projection, By Service Provider 2021 to 2036
Figure 104: Germany Gas Turbine MRO Market Incremental Opportunities (USD Billion) Forecast, By Service Provider 2026 to 2036
Figure 105: France Gas Turbine MRO Market Value (USD Billion) Projection, By Type 2021 to 2036
Figure 106: France Gas Turbine MRO Market Incremental Opportunities (USD Billion) Forecast, By Type 2026 to 2036
Figure 107: France Gas Turbine MRO Market Value (USD Billion) Projection, By Capacity 2021 to 2036
Figure 108: France Gas Turbine MRO Market Incremental Opportunities (USD Billion) Forecast, By Capacity 2026 to 2036
Figure 109: France Gas Turbine MRO Market Value (USD Billion) Projection, By Service Type 2021 to 2036
Figure 110: France Gas Turbine MRO Market Incremental Opportunities (USD Billion) Forecast, By Service Type 2026 to 2036
Figure 111: France Gas Turbine MRO Market Value (USD Billion) Projection, By Component Type 2021 to 2036
Figure 112: France Gas Turbine MRO Market Incremental Opportunities (USD Billion) Forecast, By Component Type 2026 to 2036
Figure 113: France Gas Turbine MRO Market Value (USD Billion) Projection, By Application 2021 to 2036
Figure 114: France Gas Turbine MRO Market Incremental Opportunities (USD Billion) Forecast, By Application 2026 to 2036
Figure 115: France Gas Turbine MRO Market Value (USD Billion) Projection, By End-use Industry 2021 to 2036
Figure 116: France Gas Turbine MRO Market Incremental Opportunities (USD Billion) Forecast, By End-use Industry 2026 to 2036
Figure 117: France Gas Turbine MRO Market Value (USD Billion) Projection, By Service Provider 2021 to 2036
Figure 118: France Gas Turbine MRO Market Incremental Opportunities (USD Billion) Forecast, By Service Provider 2026 to 2036
Figure 119: Italy Gas Turbine MRO Market Value (USD Billion) Projection, By Type 2021 to 2036
Figure 120: Italy Gas Turbine MRO Market Incremental Opportunities (USD Billion) Forecast, By Type 2026 to 2036
Figure 121: Italy Gas Turbine MRO Market Value (USD Billion) Projection, By Capacity 2021 to 2036
Figure 122: Italy Gas Turbine MRO Market Incremental Opportunities (USD Billion) Forecast, By Capacity 2026 to 2036
Figure 123: Italy Gas Turbine MRO Market Value (USD Billion) Projection, By Service Type 2021 to 2036
Figure 124: Italy Gas Turbine MRO Market Incremental Opportunities (USD Billion) Forecast, By Service Type 2026 to 2036
Figure 125: Italy Gas Turbine MRO Market Value (USD Billion) Projection, By Component Type 2021 to 2036
Figure 126: Italy Gas Turbine MRO Market Incremental Opportunities (USD Billion) Forecast, By Component Type 2026 to 2036
Figure 127: Italy Gas Turbine MRO Market Value (USD Billion) Projection, By Application 2021 to 2036
Figure 128: Italy Gas Turbine MRO Market Incremental Opportunities (USD Billion) Forecast, By Application 2026 to 2036
Figure 129: Italy Gas Turbine MRO Market Value (USD Billion) Projection, By End-use Industry 2021 to 2036
Figure 130: Italy Gas Turbine MRO Market Incremental Opportunities (USD Billion) Forecast, By End-use Industry 2026 to 2036
Figure 131: Italy Gas Turbine MRO Market Value (USD Billion) Projection, By Service Provider 2021 to 2036
Figure 132: Italy Gas Turbine MRO Market Incremental Opportunities (USD Billion) Forecast, By Service Provider 2026 to 2036
Figure 133: Spain Gas Turbine MRO Market Value (USD Billion) Projection, By Type 2021 to 2036
Figure 134: Spain Gas Turbine MRO Market Incremental Opportunities (USD Billion) Forecast, By Type 2026 to 2036
Figure 135: Spain Gas Turbine MRO Market Value (USD Billion) Projection, By Capacity 2021 to 2036
Figure 136: Spain Gas Turbine MRO Market Incremental Opportunities (USD Billion) Forecast, By Capacity 2026 to 2036
Figure 137: Spain Gas Turbine MRO Market Value (USD Billion) Projection, By Service Type 2021 to 2036
Figure 138: Spain Gas Turbine MRO Market Incremental Opportunities (USD Billion) Forecast, By Service Type 2026 to 2036
Figure 139: Spain Gas Turbine MRO Market Value (USD Billion) Projection, By Component Type 2021 to 2036
Figure 140: Spain Gas Turbine MRO Market Incremental Opportunities (USD Billion) Forecast, By Component Type 2026 to 2036
Figure 141: Spain Gas Turbine MRO Market Value (USD Billion) Projection, By Application 2021 to 2036
Figure 142: Spain Gas Turbine MRO Market Incremental Opportunities (USD Billion) Forecast, By Application 2026 to 2036
Figure 143: Spain Gas Turbine MRO Market Value (USD Billion) Projection, By End-use Industry 2021 to 2036
Figure 144: Spain Gas Turbine MRO Market Incremental Opportunities (USD Billion) Forecast, By End-use Industry 2026 to 2036
Figure 145: Spain Gas Turbine MRO Market Value (USD Billion) Projection, By Service Provider 2021 to 2036
Figure 146: Spain Gas Turbine MRO Market Incremental Opportunities (USD Billion) Forecast, By Service Provider 2026 to 2036
Figure 147: The Netherlands Gas Turbine MRO Market Value (USD Billion) Projection, By Type 2021 to 2036
Figure 148: The Netherlands Gas Turbine MRO Market Incremental Opportunities (USD Billion) Forecast, By Type 2026 to 2036
Figure 149: The Netherlands Gas Turbine MRO Market Value (USD Billion) Projection, By Capacity 2021 to 2036
Figure 150: The Netherlands Gas Turbine MRO Market Incremental Opportunities (USD Billion) Forecast, By Capacity 2026 to 2036
Figure 151: The Netherlands Gas Turbine MRO Market Value (USD Billion) Projection, By Service Type 2021 to 2036
Figure 152: The Netherlands Gas Turbine MRO Market Incremental Opportunities (USD Billion) Forecast, By Service Type 2026 to 2036
Figure 153: The Netherlands Gas Turbine MRO Market Value (USD Billion) Projection, By Component Type 2021 to 2036
Figure 154: The Netherlands Gas Turbine MRO Market Incremental Opportunities (USD Billion) Forecast, By Component Type 2026 to 2036
Figure 155: The Netherlands Gas Turbine MRO Market Value (USD Billion) Projection, By Application 2021 to 2036
Figure 156: The Netherlands Gas Turbine MRO Market Incremental Opportunities (USD Billion) Forecast, By Application 2026 to 2036
Figure 157: The Netherlands Gas Turbine MRO Market Value (USD Billion) Projection, By End-use Industry 2021 to 2036
Figure 158: The Netherlands Gas Turbine MRO Market Incremental Opportunities (USD Billion) Forecast, By End-use Industry 2026 to 2036
Figure 159: The Netherlands Gas Turbine MRO Market Value (USD Billion) Projection, By Service Provider 2021 to 2036
Figure 160: The Netherlands Gas Turbine MRO Market Incremental Opportunities (USD Billion) Forecast, By Service Provider 2026 to 2036
Figure 161: Asia Pacific Gas Turbine MRO Market Value (USD Billion) Projection, By Type 2021 to 2036
Figure 162: Asia Pacific Gas Turbine MRO Market Incremental Opportunities (USD Billion) Forecast, By Type 2026 to 2036
Figure 163: Asia Pacific Gas Turbine MRO Market Value (USD Billion) Projection, By Capacity 2021 to 2036
Figure 164: Asia Pacific Gas Turbine MRO Market Incremental Opportunities (USD Billion) Forecast, By Capacity 2026 to 2036
Figure 165: Asia Pacific Gas Turbine MRO Market Value (USD Billion) Projection, By Service Type 2021 to 2036
Figure 166: Asia Pacific Gas Turbine MRO Market Incremental Opportunities (USD Billion) Forecast, By Service Type 2026 to 2036
Figure 167: Asia Pacific Gas Turbine MRO Market Value (USD Billion) Projection, By Component Type 2021 to 2036
Figure 168: Asia Pacific Gas Turbine MRO Market Incremental Opportunities (USD Billion) Forecast, By Component Type 2026 to 2036
Figure 169: Asia Pacific Gas Turbine MRO Market Value (USD Billion) Projection, By Application 2021 to 2036
Figure 170: Asia Pacific Gas Turbine MRO Market Incremental Opportunities (USD Billion) Forecast, By Application 2026 to 2036
Figure 171: Asia Pacific Gas Turbine MRO Market Value (USD Billion) Projection, By End-use Industry 2021 to 2036
Figure 172: Asia Pacific Gas Turbine MRO Market Incremental Opportunities (USD Billion) Forecast, By End-use Industry 2026 to 2036
Figure 173: Asia Pacific Gas Turbine MRO Market Value (USD Billion) Projection, By Service Provider 2021 to 2036
Figure 174: Asia Pacific Gas Turbine MRO Market Incremental Opportunities (USD Billion) Forecast, By Service Provider 2026 to 2036
Figure 175: Asia Pacific Gas Turbine MRO Market Value (USD Billion) Projection, By Country 2021 to 2036
Figure 176: Asia Pacific Gas Turbine MRO Market Incremental Opportunities (USD Billion) Forecast, By Country 2026 to 2036
Figure 177: China Gas Turbine MRO Market Value (USD Billion) Projection, By Type 2021 to 2036
Figure 178: China Gas Turbine MRO Market Incremental Opportunities (USD Billion) Forecast, By Type 2026 to 2036
Figure 179: China Gas Turbine MRO Market Value (USD Billion) Projection, By Capacity 2021 to 2036
Figure 180: China Gas Turbine MRO Market Incremental Opportunities (USD Billion) Forecast, By Capacity 2026 to 2036
Figure 181: China Gas Turbine MRO Market Value (USD Billion) Projection, By Service Type 2021 to 2036
Figure 182: China Gas Turbine MRO Market Incremental Opportunities (USD Billion) Forecast, By Service Type 2026 to 2036
Figure 183: China Gas Turbine MRO Market Value (USD Billion) Projection, By Component Type 2021 to 2036
Figure 184: China Gas Turbine MRO Market Incremental Opportunities (USD Billion) Forecast, By Component Type 2026 to 2036
Figure 185: China Gas Turbine MRO Market Value (USD Billion) Projection, By Application 2021 to 2036
Figure 186: China Gas Turbine MRO Market Incremental Opportunities (USD Billion) Forecast, By Application 2026 to 2036
Figure 187: China Gas Turbine MRO Market Value (USD Billion) Projection, By End-use Industry 2021 to 2036
Figure 188: China Gas Turbine MRO Market Incremental Opportunities (USD Billion) Forecast, By End-use Industry 2026 to 2036
Figure 189: China Gas Turbine MRO Market Value (USD Billion) Projection, By Service Provider 2021 to 2036
Figure 190: China Gas Turbine MRO Market Incremental Opportunities (USD Billion) Forecast, By Service Provider 2026 to 2036
Figure 191: India Gas Turbine MRO Market Value (USD Billion) Projection, By Type 2021 to 2036
Figure 192: India Gas Turbine MRO Market Incremental Opportunities (USD Billion) Forecast, By Type 2026 to 2036
Figure 193: India Gas Turbine MRO Market Value (USD Billion) Projection, By Capacity 2021 to 2036
Figure 194: India Gas Turbine MRO Market Incremental Opportunities (USD Billion) Forecast, By Capacity 2026 to 2036
Figure 195: India Gas Turbine MRO Market Value (USD Billion) Projection, By Service Type 2021 to 2036
Figure 196: India Gas Turbine MRO Market Incremental Opportunities (USD Billion) Forecast, By Service Type 2026 to 2036
Figure 197: India Gas Turbine MRO Market Value (USD Billion) Projection, By Component Type 2021 to 2036
Figure 198: India Gas Turbine MRO Market Incremental Opportunities (USD Billion) Forecast, By Component Type 2026 to 2036
Figure 199: India Gas Turbine MRO Market Value (USD Billion) Projection, By Application 2021 to 2036
Figure 200: India Gas Turbine MRO Market Incremental Opportunities (USD Billion) Forecast, By Application 2026 to 2036
Figure 201: India Gas Turbine MRO Market Value (USD Billion) Projection, By End-use Industry 2021 to 2036
Figure 202: India Gas Turbine MRO Market Incremental Opportunities (USD Billion) Forecast, By End-use Industry 2026 to 2036
Figure 203: India Gas Turbine MRO Market Value (USD Billion) Projection, By Service Provider 2021 to 2036
Figure 204: India Gas Turbine MRO Market Incremental Opportunities (USD Billion) Forecast, By Service Provider 2026 to 2036
Figure 205: Japan Gas Turbine MRO Market Value (USD Billion) Projection, By Type 2021 to 2036
Figure 206: Japan Gas Turbine MRO Market Incremental Opportunities (USD Billion) Forecast, By Type 2026 to 2036
Figure 207: Japan Gas Turbine MRO Market Value (USD Billion) Projection, By Capacity 2021 to 2036
Figure 208: Japan Gas Turbine MRO Market Incremental Opportunities (USD Billion) Forecast, By Capacity 2026 to 2036
Figure 209: Japan Gas Turbine MRO Market Value (USD Billion) Projection, By Service Type 2021 to 2036
Figure 210: Japan Gas Turbine MRO Market Incremental Opportunities (USD Billion) Forecast, By Service Type 2026 to 2036
Figure 211: Japan Gas Turbine MRO Market Value (USD Billion) Projection, By Component Type 2021 to 2036
Figure 212: Japan Gas Turbine MRO Market Incremental Opportunities (USD Billion) Forecast, By Component Type 2026 to 2036
Figure 213: Japan Gas Turbine MRO Market Value (USD Billion) Projection, By Application 2021 to 2036
Figure 214: Japan Gas Turbine MRO Market Incremental Opportunities (USD Billion) Forecast, By Application 2026 to 2036
Figure 215: Japan Gas Turbine MRO Market Value (USD Billion) Projection, By End-use Industry 2021 to 2036
Figure 216: Japan Gas Turbine MRO Market Incremental Opportunities (USD Billion) Forecast, By End-use Industry 2026 to 2036
Figure 217: Japan Gas Turbine MRO Market Value (USD Billion) Projection, By Service Provider 2021 to 2036
Figure 218: Japan Gas Turbine MRO Market Incremental Opportunities (USD Billion) Forecast, By Service Provider 2026 to 2036
Figure 219: Australia Gas Turbine MRO Market Value (USD Billion) Projection, By Type 2021 to 2036
Figure 220: Australia Gas Turbine MRO Market Incremental Opportunities (USD Billion) Forecast, By Type 2026 to 2036
Figure 221: Australia Gas Turbine MRO Market Value (USD Billion) Projection, By Capacity 2021 to 2036
Figure 222: Australia Gas Turbine MRO Market Incremental Opportunities (USD Billion) Forecast, By Capacity 2026 to 2036
Figure 223: Australia Gas Turbine MRO Market Value (USD Billion) Projection, By Service Type 2021 to 2036
Figure 224: Australia Gas Turbine MRO Market Incremental Opportunities (USD Billion) Forecast, By Service Type 2026 to 2036
Figure 225: Australia Gas Turbine MRO Market Value (USD Billion) Projection, By Component Type 2021 to 2036
Figure 226: Australia Gas Turbine MRO Market Incremental Opportunities (USD Billion) Forecast, By Component Type 2026 to 2036
Figure 227: Australia Gas Turbine MRO Market Value (USD Billion) Projection, By Application 2021 to 2036
Figure 228: Australia Gas Turbine MRO Market Incremental Opportunities (USD Billion) Forecast, By Application 2026 to 2036
Figure 229: Australia Gas Turbine MRO Market Value (USD Billion) Projection, By End-use Industry 2021 to 2036
Figure 230: Australia Gas Turbine MRO Market Incremental Opportunities (USD Billion) Forecast, By End-use Industry 2026 to 2036
Figure 231: Australia Gas Turbine MRO Market Value (USD Billion) Projection, By Service Provider 2021 to 2036
Figure 232: Australia Gas Turbine MRO Market Incremental Opportunities (USD Billion) Forecast, By Service Provider 2026 to 2036
Figure 233: South Korea Gas Turbine MRO Market Value (USD Billion) Projection, By Type 2021 to 2036
Figure 234: South Korea Gas Turbine MRO Market Incremental Opportunities (USD Billion) Forecast, By Type 2026 to 2036
Figure 235: South Korea Gas Turbine MRO Market Value (USD Billion) Projection, By Capacity 2021 to 2036
Figure 236: South Korea Gas Turbine MRO Market Incremental Opportunities (USD Billion) Forecast, By Capacity 2026 to 2036
Figure 237: South Korea Gas Turbine MRO Market Value (USD Billion) Projection, By Service Type 2021 to 2036
Figure 238: South Korea Gas Turbine MRO Market Incremental Opportunities (USD Billion) Forecast, By Service Type 2026 to 2036
Figure 239: South Korea Gas Turbine MRO Market Value (USD Billion) Projection, By Component Type 2021 to 2036
Figure 240: South Korea Gas Turbine MRO Market Incremental Opportunities (USD Billion) Forecast, By Component Type 2026 to 2036
Figure 241: South Korea Gas Turbine MRO Market Value (USD Billion) Projection, By Application 2021 to 2036
Figure 242: South Korea Gas Turbine MRO Market Incremental Opportunities (USD Billion) Forecast, By Application 2026 to 2036
Figure 243: South Korea Gas Turbine MRO Market Value (USD Billion) Projection, By End-use Industry 2021 to 2036
Figure 244: South Korea Gas Turbine MRO Market Incremental Opportunities (USD Billion) Forecast, By End-use Industry 2026 to 2036
Figure 245: South Korea Gas Turbine MRO Market Value (USD Billion) Projection, By Service Provider 2021 to 2036
Figure 246: South Korea Gas Turbine MRO Market Incremental Opportunities (USD Billion) Forecast, By Service Provider 2026 to 2036
Figure 247: ASEAN Gas Turbine MRO Market Value (USD Billion) Projection, By Type 2021 to 2036
Figure 248: ASEAN Gas Turbine MRO Market Incremental Opportunities (USD Billion) Forecast, By Type 2026 to 2036
Figure 249: ASEAN Gas Turbine MRO Market Value (USD Billion) Projection, By Capacity 2021 to 2036
Figure 250: ASEAN Gas Turbine MRO Market Incremental Opportunities (USD Billion) Forecast, By Capacity 2026 to 2036
Figure 251: ASEAN Gas Turbine MRO Market Value (USD Billion) Projection, By Service Type 2021 to 2036
Figure 252: ASEAN Gas Turbine MRO Market Incremental Opportunities (USD Billion) Forecast, By Service Type 2026 to 2036
Figure 253: ASEAN Gas Turbine MRO Market Value (USD Billion) Projection, By Component Type 2021 to 2036
Figure 254: ASEAN Gas Turbine MRO Market Incremental Opportunities (USD Billion) Forecast, By Component Type 2026 to 2036
Figure 255: ASEAN Gas Turbine MRO Market Value (USD Billion) Projection, By Application 2021 to 2036
Figure 256: ASEAN Gas Turbine MRO Market Incremental Opportunities (USD Billion) Forecast, By Application 2026 to 2036
Figure 257: ASEAN Gas Turbine MRO Market Value (USD Billion) Projection, By End-use Industry 2021 to 2036
Figure 258: ASEAN Gas Turbine MRO Market Incremental Opportunities (USD Billion) Forecast, By End-use Industry 2026 to 2036
Figure 259: ASEAN Gas Turbine MRO Market Value (USD Billion) Projection, By Service Provider 2021 to 2036
Figure 260: ASEAN Gas Turbine MRO Market Incremental Opportunities (USD Billion) Forecast, By Service Provider 2026 to 2036
Figure 261: Middle East & Africa Gas Turbine MRO Market Value (USD Billion) Projection, By Type 2021 to 2036
Figure 262: Middle East & Africa Gas Turbine MRO Market Incremental Opportunities (USD Billion) Forecast, By Type 2026 to 2036
Figure 263: Middle East & Africa Gas Turbine MRO Market Value (USD Billion) Projection, By Capacity 2021 to 2036
Figure 264: Middle East & Africa Gas Turbine MRO Market Incremental Opportunities (USD Billion) Forecast, By Capacity 2026 to 2036
Figure 265: Middle East & Africa Gas Turbine MRO Market Value (USD Billion) Projection, By Service Type 2021 to 2036
Figure 266: Middle East & Africa Gas Turbine MRO Market Incremental Opportunities (USD Billion) Forecast, By Service Type 2026 to 2036
Figure 267: Middle East & Africa Gas Turbine MRO Market Value (USD Billion) Projection, By Component Type 2021 to 2036
Figure 268: Middle East & Africa Gas Turbine MRO Market Incremental Opportunities (USD Billion) Forecast, By Component Type 2026 to 2036
Figure 269: Middle East & Africa Gas Turbine MRO Market Value (USD Billion) Projection, By Application 2021 to 2036
Figure 270: Middle East & Africa Gas Turbine MRO Market Incremental Opportunities (USD Billion) Forecast, By Application 2026 to 2036
Figure 271: Middle East & Africa Gas Turbine MRO Market Value (USD Billion) Projection, By End-use Industry 2021 to 2036
Figure 272: Middle East & Africa Gas Turbine MRO Market Incremental Opportunities (USD Billion) Forecast, By End-use Industry 2026 to 2036
Figure 273: Middle East & Africa Gas Turbine MRO Market Value (USD Billion) Projection, By Service Provider 2021 to 2036
Figure 274: Middle East & Africa Gas Turbine MRO Market Incremental Opportunities (USD Billion) Forecast, By Service Provider 2026 to 2036
Figure 275: Middle East & Africa Gas Turbine MRO Market Value (USD Billion) Projection, By Country 2021 to 2036
Figure 276: Middle East & Africa Gas Turbine MRO Market Incremental Opportunities (USD Billion) Forecast, By Country 2026 to 2036
Figure 277: GCC Countries Gas Turbine MRO Market Value (USD Billion) Projection, By Type 2021 to 2036
Figure 278: GCC Countries Gas Turbine MRO Market Incremental Opportunities (USD Billion) Forecast, By Type 2026 to 2036
Figure 279: GCC Countries Gas Turbine MRO Market Value (USD Billion) Projection, By Capacity 2021 to 2036
Figure 280: GCC Countries Gas Turbine MRO Market Incremental Opportunities (USD Billion) Forecast, By Capacity 2026 to 2036
Figure 281: GCC Countries Gas Turbine MRO Market Value (USD Billion) Projection, By Service Type 2021 to 2036
Figure 282: GCC Countries Gas Turbine MRO Market Incremental Opportunities (USD Billion) Forecast, By Service Type 2026 to 2036
Figure 283: GCC Countries Gas Turbine MRO Market Value (USD Billion) Projection, By Component Type 2021 to 2036
Figure 284: GCC Countries Gas Turbine MRO Market Incremental Opportunities (USD Billion) Forecast, By Component Type 2026 to 2036
Figure 285: GCC Countries Gas Turbine MRO Market Value (USD Billion) Projection, By Application 2021 to 2036
Figure 286: GCC Countries Gas Turbine MRO Market Incremental Opportunities (USD Billion) Forecast, By Application 2026 to 2036
Figure 287: GCC Countries Gas Turbine MRO Market Value (USD Billion) Projection, By End-use Industry 2021 to 2036
Figure 288: GCC Countries Gas Turbine MRO Market Incremental Opportunities (USD Billion) Forecast, By End-use Industry 2026 to 2036
Figure 289: GCC Countries Gas Turbine MRO Market Value (USD Billion) Projection, By Service Provider 2021 to 2036
Figure 290: GCC Countries Gas Turbine MRO Market Incremental Opportunities (USD Billion) Forecast, By Service Provider 2026 to 2036
Figure 291: South Africa Gas Turbine MRO Market Value (USD Billion) Projection, By Type 2021 to 2036
Figure 292: South Africa Gas Turbine MRO Market Incremental Opportunities (USD Billion) Forecast, By Type 2026 to 2036
Figure 293: South Africa Gas Turbine MRO Market Value (USD Billion) Projection, By Capacity 2021 to 2036
Figure 294: South Africa Gas Turbine MRO Market Incremental Opportunities (USD Billion) Forecast, By Capacity 2026 to 2036
Figure 295: South Africa Gas Turbine MRO Market Value (USD Billion) Projection, By Service Type 2021 to 2036
Figure 296: South Africa Gas Turbine MRO Market Incremental Opportunities (USD Billion) Forecast, By Service Type 2026 to 2036
Figure 297: South Africa Gas Turbine MRO Market Value (USD Billion) Projection, By Component Type 2021 to 2036
Figure 298: South Africa Gas Turbine MRO Market Incremental Opportunities (USD Billion) Forecast, By Component Type 2026 to 2036
Figure 299: South Africa Gas Turbine MRO Market Value (USD Billion) Projection, By Application 2021 to 2036
Figure 300: South Africa Gas Turbine MRO Market Incremental Opportunities (USD Billion) Forecast, By Application 2026 to 2036
Figure 301: South Africa Gas Turbine MRO Market Value (USD Billion) Projection, By End-use Industry 2021 to 2036
Figure 302: South Africa Gas Turbine MRO Market Incremental Opportunities (USD Billion) Forecast, By End-use Industry 2026 to 2036
Figure 303: South Africa Gas Turbine MRO Market Value (USD Billion) Projection, By Service Provider 2021 to 2036
Figure 304: South Africa Gas Turbine MRO Market Incremental Opportunities (USD Billion) Forecast, By Service Provider 2026 to 2036
Figure 305: Latin America Gas Turbine MRO Market Value (USD Billion) Projection, By Type 2021 to 2036
Figure 306: Latin America Gas Turbine MRO Market Incremental Opportunities (USD Billion) Forecast, By Type 2026 to 2036
Figure 307: Latin America Gas Turbine MRO Market Value (USD Billion) Projection, By Capacity 2021 to 2036
Figure 308: Latin America Gas Turbine MRO Market Incremental Opportunities (USD Billion) Forecast, By Capacity 2026 to 2036
Figure 309: Latin America Gas Turbine MRO Market Value (USD Billion) Projection, By Service Type 2021 to 2036
Figure 310: Latin America Gas Turbine MRO Market Incremental Opportunities (USD Billion) Forecast, By Service Type 2026 to 2036
Figure 311: Latin America Gas Turbine MRO Market Value (USD Billion) Projection, By Component Type 2021 to 2036
Figure 312: Latin America Gas Turbine MRO Market Incremental Opportunities (USD Billion) Forecast, By Component Type 2026 to 2036
Figure 313: Latin America Gas Turbine MRO Market Value (USD Billion) Projection, By Application 2021 to 2036
Figure 314: Latin America Gas Turbine MRO Market Incremental Opportunities (USD Billion) Forecast, By Application 2026 to 2036
Figure 315: Latin America Gas Turbine MRO Market Value (USD Billion) Projection, By End-use Industry 2021 to 2036
Figure 316: Latin America Gas Turbine MRO Market Incremental Opportunities (USD Billion) Forecast, By End-use Industry 2026 to 2036
Figure 317: Latin America Gas Turbine MRO Market Value (USD Billion) Projection, By Service Provider 2021 to 2036
Figure 318: Latin America Gas Turbine MRO Market Incremental Opportunities (USD Billion) Forecast, By Service Provider 2026 to 2036
Figure 319: Latin America Gas Turbine MRO Market Value (USD Billion) Projection, By Country 2021 to 2036
Figure 320: Latin America Gas Turbine MRO Market Incremental Opportunities (USD Billion) Forecast, By Country 2026 to 2036
Figure 321: Brazil Gas Turbine MRO Market Value (USD Billion) Projection, By Type 2021 to 2036
Figure 322: Brazil Gas Turbine MRO Market Incremental Opportunities (USD Billion) Forecast, By Type 2026 to 2036
Figure 323: Brazil Gas Turbine MRO Market Value (USD Billion) Projection, By Capacity 2021 to 2036
Figure 324: Brazil Gas Turbine MRO Market Incremental Opportunities (USD Billion) Forecast, By Capacity 2026 to 2036
Figure 325: Brazil Gas Turbine MRO Market Value (USD Billion) Projection, By Service Type 2021 to 2036
Figure 326: Brazil Gas Turbine MRO Market Incremental Opportunities (USD Billion) Forecast, By Service Type 2026 to 2036
Figure 327: Brazil Gas Turbine MRO Market Value (USD Billion) Projection, By Component Type 2021 to 2036
Figure 328: Brazil Gas Turbine MRO Market Incremental Opportunities (USD Billion) Forecast, By Component Type 2026 to 2036
Figure 329: Brazil Gas Turbine MRO Market Value (USD Billion) Projection, By Application 2021 to 2036
Figure 330: Brazil Gas Turbine MRO Market Incremental Opportunities (USD Billion) Forecast, By Application 2026 to 2036
Figure 331: Brazil Gas Turbine MRO Market Value (USD Billion) Projection, By End-use Industry 2021 to 2036
Figure 332: Brazil Gas Turbine MRO Market Incremental Opportunities (USD Billion) Forecast, By End-use Industry 2026 to 2036
Figure 333: Brazil Gas Turbine MRO Market Value (USD Billion) Projection, By Service Provider 2021 to 2036
Figure 334: Brazil Gas Turbine MRO Market Incremental Opportunities (USD Billion) Forecast, By Service Provider 2026 to 2036
Figure 335: Mexico Gas Turbine MRO Market Value (USD Billion) Projection, By Type 2021 to 2036
Figure 336: Mexico Gas Turbine MRO Market Incremental Opportunities (USD Billion) Forecast, By Type 2026 to 2036
Figure 337: Mexico Gas Turbine MRO Market Value (USD Billion) Projection, By Capacity 2021 to 2036
Figure 338: Mexico Gas Turbine MRO Market Incremental Opportunities (USD Billion) Forecast, By Capacity 2026 to 2036
Figure 339: Mexico Gas Turbine MRO Market Value (USD Billion) Projection, By Service Type 2021 to 2036
Figure 340: Mexico Gas Turbine MRO Market Incremental Opportunities (USD Billion) Forecast, By Service Type 2026 to 2036
Figure 341: Mexico Gas Turbine MRO Market Value (USD Billion) Projection, By Component Type 2021 to 2036
Figure 342: Mexico Gas Turbine MRO Market Incremental Opportunities (USD Billion) Forecast, By Component Type 2026 to 2036
Figure 343: Mexico Gas Turbine MRO Market Value (USD Billion) Projection, By Application 2021 to 2036
Figure 344: Mexico Gas Turbine MRO Market Incremental Opportunities (USD Billion) Forecast, By Application 2026 to 2036
Figure 345: Mexico Gas Turbine MRO Market Value (USD Billion) Projection, By End-use Industry 2021 to 2036
Figure 346: Mexico Gas Turbine MRO Market Incremental Opportunities (USD Billion) Forecast, By End-use Industry 2026 to 2036
Figure 347: Mexico Gas Turbine MRO Market Value (USD Billion) Projection, By Service Provider 2021 to 2036
Figure 348: Mexico Gas Turbine MRO Market Incremental Opportunities (USD Billion) Forecast, By Service Provider 2026 to 2036
Figure 349: Argentina Gas Turbine MRO Market Value (USD Billion) Projection, By Type 2021 to 2036
Figure 350: Argentina Gas Turbine MRO Market Incremental Opportunities (USD Billion) Forecast, By Type 2026 to 2036
Figure 351: Argentina Gas Turbine MRO Market Value (USD Billion) Projection, By Capacity 2021 to 2036
Figure 352: Argentina Gas Turbine MRO Market Incremental Opportunities (USD Billion) Forecast, By Capacity 2026 to 2036
Figure 353: Argentina Gas Turbine MRO Market Value (USD Billion) Projection, By Service Type 2021 to 2036
Figure 354: Argentina Gas Turbine MRO Market Incremental Opportunities (USD Billion) Forecast, By Service Type 2026 to 2036
Figure 355: Argentina Gas Turbine MRO Market Value (USD Billion) Projection, By Component Type 2021 to 2036
Figure 356: Argentina Gas Turbine MRO Market Incremental Opportunities (USD Billion) Forecast, By Component Type 2026 to 2036
Figure 357: Argentina Gas Turbine MRO Market Value (USD Billion) Projection, By Application 2021 to 2036
Figure 358: Argentina Gas Turbine MRO Market Incremental Opportunities (USD Billion) Forecast, By Application 2026 to 2036
Figure 359: Argentina Gas Turbine MRO Market Value (USD Billion) Projection, By End-use Industry 2021 to 2036
Figure 360: Argentina Gas Turbine MRO Market Incremental Opportunities (USD Billion) Forecast, By End-use Industry 2026 to 2036
Figure 361: Argentina Gas Turbine MRO Market Value (USD Billion) Projection, By Service Provider 2021 to 2036
Figure 362: Argentina Gas Turbine MRO Market Incremental Opportunities (USD Billion) Forecast, By Service Provider 2026 to 2036
Copyright © Transparency Market Research, Inc. All Rights reserved
Trust Online


Gas Turbine MRO Market
