
Reports
Reports
Analysts’ Viewpoint
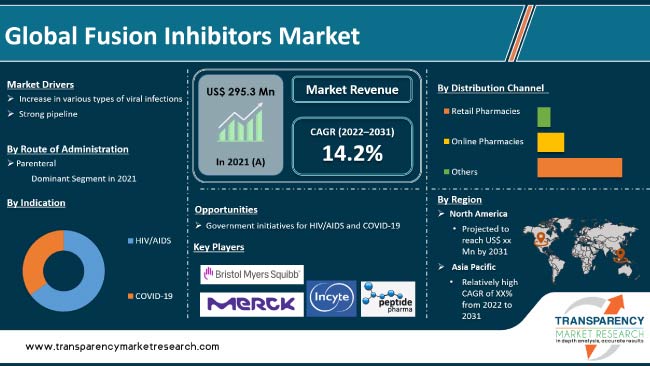
Increase in incidence and prevalence of human immunodeficiency virus (HIV) infections or acquired immunodeficiency syndrome (AIDS) is expected to drive the global fusion inhibitors market growth during the forecast period. The number of people living with HIV/AIDS across the globe has increased rapidly in the past few years. Surge in launch of fusion inhibitors drugs is also expected to propel the industry during the forecast period.
Rise in research & development activities in HIV fusion inhibitors and viral fusion inhibitors is likely to present significant opportunities for the fusion inhibitors market in the next few years. Manufacturers are focusing on developing drugs for the treatment of HIV and pre-exposure prophylaxis (prevention) of COVID-19.
Fusion inhibitors are also known as entry inhibitors. The initial two steps of the viral lifecycle are fusion and binding, which can be inhibited by fusion and entry inhibitors. These inhibitors work by binding to the attachment sites of the HIV virus, thereby inhibiting the fusion of HIV virus to the host cell membranes. These inhibitors disable the de novo virus infection and cell-to-cell transmission of the virus.
The prevalence of viral diseases has increased significantly across the globe in the past few years. Major viral diseases that require lifetime treatment include HIV/AIDS and chronic hepatitis virus. HIV is one of the key public health issues across the globe. An estimated 38.4 million people lived with HIV in 2021. The the global prevalence was projected to be around 1% of the adult population and about 1.5 million people became newly infected with HIV in the year.
According to UNAIDS, AIDS-related illnesses accounted for more than 650,000 deaths in 2021. Majority of the HIV infected people live in low and middle-income countries, with over 70% of them living in sub-Saharan Africa. Rise in prevalence of the disease and increase in awareness among the people have led to a rise in number of people receiving treatment. In 2018, more than 62% of the people living with HIV received treatment and over 53% of them were virally suppressed.
Governments and organizations are focusing on spreading awareness about the treatment for HIV through public education, vaccination, and effective medical support. This is likely to create demand for infusion inhibitor drugs for the effective treatment of HIV, thus accelerating market development.
In terms of route of administration, the global fusion inhibitors market has been bifurcated into parenteral and oral. The oral segment held the largest share in 2021 owing to the availability of drugs such as Maraviroc and Fostemsavir. However, parenteral is expected to be the dominant segment during the forecast period due the launch of drugs such as Evusheld for the treatment of COVID-19. The segment is projected to grow at a higher CAGR during the forecast period.
Based on indication, the global business has been split into HIV/AIDS and COVID-19. The COVID-19 segment is projected to account for dominant market share from 2022 to 2031. The segment is anticipated to expand at a higher CAGR during the forecast period. This is can be ascribed to increase in patient population with various infectious diseases such as COVID-19 infection.
Based on distribution channel, the global fusion inhibitors market has been segregated into retail pharmacies, online pharmacies, and others. The retail pharmacies segment is projected to account for dominant share from 2022 to 2031. This can be ascribed to the increase in sale of antiviral drugs through retail stores in developed countries such as the U.S. and Canada.
North America held more than 35% share in 2021. Well-established pharmaceutical & biopharmaceutical research industry and presence of the world’s leading companies engaged in research activities are the major factors driving market expansion in the region during the forecast period.
The market in Asia Pacific is expected to grow at a rapid pace during the forecast period. This can be ascribed to the increase in patient population living with HIV in the region. The market in Middle East & Africa is expected to grow at a moderate pace during the forecast period. According to a study published in a news article, currently, about 8.5 million people in South Africa are living with HIV as compared to 3.68 million in 2002. According to the study, South Africa has the most number of people enrolled on antiretroviral medications in the world.
The global fusion inhibitors market is consolidated, with the presence of international as well as local players. Top five or six players account for significant share of the industry. Leading companies are striving to increase their presence across the globe and establish strong distribution network through mergers & acquisitions, collaborations, and partnerships.
Key players operating in the global fusion inhibitors market are Bristol-Myers Squibb Company, PeptidePharma, Incyte, AstraZeneca, ViiV Healthcare Limited, Frontier Bio Corporation, Trimeris, Inc., Progenics Pharmaceuticals, Schering-Plough (Merck & Co.), Biogen, Vanderbilt University, and Genentech.
Leading players have been profiled in the fusion inhibitors market report based on parameters such as company overview, financial overview, strategies, portfolio, segments, and recent developments.
|
Attribute |
Detail |
|
Size in 2021 |
US$ 295.3 Mn |
|
Forecast (Value) in 2031 |
More than US$ 7.2 Bn |
|
Growth Rate (CAGR) |
14.2% |
|
Forecast Period |
2022–2031 |
|
Historical Data Available for |
2017–2020 |
|
Quantitative Units |
US$ Mn/Bn for Value |
|
Market Analysis |
It includes segment analysis as well as regional level analysis. Moreover, qualitative analysis includes drivers, restraints, opportunities, and key trend analysis. |
|
Competition Landscape |
|
|
Format |
Electronic (PDF) + Excel |
|
Segmentation |
|
|
Regions Covered |
|
|
Countries Covered |
|
|
Companies Profiled |
|
|
Customization Scope |
Available upon request |
|
Pricing |
Available upon request |
The industry was valued at US$ 295.3 Mn in 2021
It is projected to reach more than US$ 7.2 Bn by 2031
The CAGR was 18.7% from 2017 to 2031
The CAGR is anticipated to be 14.2% from 2022 to 2031
Increase in various types of viral infection and strong pipeline
North America is expected to account for the largest share during the forecast period.
Bristol-Myers Squibb Company, PeptidePharma, Incyte, AstraZeneca, ViiV Healthcare Limited, Frontier Bio Corporation, Trimeris, Inc., Progenics Pharmaceuticals, Schering-Plough (Merck & Co.), Biogen, Vanderbilt University, and Genentech
1. Preface
1.1. Market Definition and Scope
1.2. Market Segmentation
1.3. Key Research Objectives
1.4. Research Highlights
2. Assumptions and Research Methodology
3. Executive Summary: Global Fusion Inhibitors Market
4. Market Overview
4.1. Introduction
4.1.1. Definition
4.1.2. Industry Evolution / Developments
4.2. Overview
4.3. Market Dynamics
4.3.1. Drivers
4.3.2. Restraints
4.3.3. Opportunities
4.4. Global Fusion Inhibitors Market Analysis and Forecast, 2017–2031
4.4.1. Market Revenue Projections (US$ Mn)
5. Key Insights
5.1. Key Mergers & Acquisitions
5.2. Disease Prevalence & Incidence Rate Globally with Key Countries
5.3. Drug Pricing Analysis
5.4. Pipeline Analysis
5.5. Covid-19 Pandemic Impact on the Industry
6. Global Fusion Inhibitors Market Analysis and Forecast, by Route of Administration
6.1. Introduction & Definition
6.2. Key Findings / Developments
6.3. Market Value Forecast, by Route of Administration, 2017–2031
6.3.1. Oral
6.3.2. Parenteral
6.4. Market Attractiveness Analysis, by Route of Administration
7. Global Fusion Inhibitors Market Analysis and Forecast, by Indication
7.1. Introduction & Definition
7.2. Key Findings / Developments
7.3. Market Value Forecast, by Indication, 2017–2031
7.3.1. HIV/AIDS
7.3.2. COVID-19
7.4. Market Attractiveness Analysis, by Indication
8. Global Fusion Inhibitors Market Analysis and Forecast, by Distribution Channel
8.1. Introduction & Definition
8.2. Key Findings / Developments
8.3. Market Value Forecast, by Distribution Channel, 2017–2031
8.3.1. Retail Pharmacies
8.3.2. Online Pharmacies
8.3.3. Others
8.4. Market Attractiveness Analysis, by Distribution Channel
9. Global Fusion Inhibitors Market Analysis and Forecast, by Region
9.1. Key Findings
9.2. Market Value Forecast, by Region
9.2.1. North America
9.2.2. Europe
9.2.3. Asia Pacific
9.2.4. Latin America
9.2.5. Middle East & Africa
9.3. Market Attractiveness Analysis, by Region
10. North America Fusion Inhibitors Market Analysis and Forecast
10.1. Introduction
10.1.1. Key Findings
10.2. Market Value Forecast, by Route of Administration, 2017–2031
10.2.1. Oral
10.2.2. Parenteral
10.3. Market Value Forecast, by Indication, 2017–2031
10.3.1. HIV/AIDS
10.3.2. COVID-19
10.4. Market Value Forecast, by Distribution Channel, 2017–2031
10.4.1. Retail Pharmacies
10.4.2. Online Pharmacies
10.4.3. Others
10.5. Market Value Forecast, by Country, 2017–2031
10.5.1. U.S.
10.5.2. Canada
10.6. Market Attractiveness Analysis
10.6.1. By Route of Administration
10.6.2. By Indication
10.6.3. By Distribution Channel
10.6.4. By Country
11. Europe Fusion Inhibitors Market Analysis and Forecast
11.1. Introduction
11.1.1. Key Findings
11.2. Market Value Forecast, by Route of Administration, 2017–2031
11.2.1. Oral
11.2.2. Parenteral
11.3. Market Value Forecast, by Indication, 2017–2031
11.3.1. HIV/AIDS
11.3.2. COVID-19
11.4. Market Value Forecast, by Distribution Channel, 2017–2031
11.4.1. Retail Pharmacies
11.4.2. Online Pharmacies
11.4.3. Others
11.5. Market Value Forecast, by Country/Sub-region, 2017–2031
11.5.1. Germany
11.5.2. U.K.
11.5.3. France
11.5.4. Italy
11.5.5. Spain
11.5.6. Rest of Europe
11.6. Market Attractiveness Analysis
11.6.1. By Route of Administration
11.6.2. By Indication
11.6.3. By Distribution Channel
11.6.4. By Country/Sub-region
12. Asia Pacific Fusion Inhibitors Market Analysis and Forecast
12.1. Introduction
12.1.1. Key Findings
12.2. Market Value Forecast, by Route of Administration, 2017–2031
12.2.1. Oral
12.2.2. Parenteral
12.3. Market Value Forecast, by Indication, 2017–2031
12.3.1. HIV/AIDS
12.3.2. COVID-19
12.4. Market Value Forecast, by Distribution Channel, 2017–2031
12.4.1. Retail Pharmacies
12.4.2. Online Pharmacies
12.4.3. Others
12.5. Market Value Forecast, by Country/Sub-region, 2017–2031
12.5.1. China
12.5.2. Japan
12.5.3. India
12.5.4. Australia & New Zealand
12.5.5. Rest of Asia Pacific
12.6. Market Attractiveness Analysis
12.6.1. By Route of Administration
12.6.2. By Indication
12.6.3. By Distribution Channel
12.6.4. By Country/Sub-region
13. Latin America Fusion Inhibitors Market Analysis and Forecast
13.1. Introduction
13.1.1. Key Findings
13.2. Market Value Forecast, by Route of Administration, 2017–2031
13.2.1. Oral
13.2.2. Parenteral
13.3. Market Value Forecast, by Indication, 2017–2031
13.3.1. HIV/AIDS
13.3.2. COVID-19
13.4. Market Value Forecast, by Distribution Channel, 2017–2031
13.4.1. Retail Pharmacies
13.4.2. Online Pharmacies
13.4.3. Others
13.5. Market Value Forecast, by Country/Sub-region, 2017–2031
13.5.1. Brazil
13.5.2. Mexico
13.5.3. Rest of Latin America
13.6. Market Attractiveness Analysis
13.6.1. By Route of Administration
13.6.2. By Indication
13.6.3. By Distribution Channel
13.6.4. By Country/Sub-region
14. Middle East & Africa Fusion Inhibitors Market Analysis and Forecast
14.1. Introduction
14.1.1. Key Findings
14.2. Market Value Forecast, by Route of Administration, 2017–2031
14.2.1. Oral
14.2.2. Parenteral
14.3. Market Value Forecast, by Indication, 2017–2031
14.3.1. HIV/AIDS
14.3.2. COVID-19
14.4. Market Value Forecast, by Distribution Channel, 2017–2031
14.4.1. Retail Pharmacies
14.4.2. Online Pharmacies
14.4.3. Others
14.5. Market Value Forecast, by Country/Sub-region, 2017–2031
14.5.1. GCC Countries
14.5.2. South Africa
14.5.3. Rest of Middle East & Africa
14.6. Market Attractiveness Analysis
14.6.1. By Route of Administration
14.6.2. By Indication
14.6.3. By Distribution Channel
14.6.4. By Country/Sub-region
15. Competition Landscape
15.1. Market Player - Competition Matrix (by tier and size of companies)
15.2. Market Share/Ranking Analysis, by Company, 2021
15.3. Company Profiles
15.3.1. Bristol-Myers Squibb Company
15.3.1.1. Company Overview
15.3.1.2. Product Portfolio
15.3.1.3. SWOT Analysis
15.3.1.4. Strategic Overview
15.3.2. PeptidePharma
15.3.2.1. Company Overview
15.3.2.2. Product Portfolio
15.3.2.3. SWOT Analysis
15.3.2.4. Strategic Overview
15.3.3. Incyte
15.3.3.1. Company Overview
15.3.3.2. Product Portfolio
15.3.3.3. SWOT Analysis
15.3.3.4. Strategic Overview
15.3.4. Astrazeneca
15.3.4.1. Company Overview
15.3.4.2. Product Portfolio
15.3.4.3. SWOT Analysis
15.3.4.4. Strategic Overview
15.3.5. ViiV Healthcare Limited
15.3.5.1. Company Overview
15.3.5.2. Product Portfolio
15.3.5.3. SWOT Analysis
15.3.5.4. Strategic Overview
15.3.6. Frontier Bio Corporation
15.3.6.1. Company Overview
15.3.6.2. Product Portfolio
15.3.6.3. SWOT Analysis
15.3.6.4. Strategic Overview
15.3.7. Trimeris, Inc.
15.3.7.1. Company Overview
15.3.7.2. Product Portfolio
15.3.7.3. SWOT Analysis
15.3.7.4. Strategic Overview
15.3.8. Progenics Pharmaceuticals
15.3.8.1. Company Overview
15.3.8.2. Product Portfolio
15.3.8.3. SWOT Analysis
15.3.8.4. Strategic Overview
15.3.9. Schering-Plough (Merck & Co.)
15.3.9.1. Company Overview
15.3.9.2. Product Portfolio
15.3.9.3. SWOT Analysis
15.3.9.4. Strategic Overview
15.3.10. Biogen
15.3.10.1. Company Overview
15.3.10.2. Product Portfolio
15.3.10.3. SWOT Analysis
15.3.10.4. Strategic Overview
15.3.11. Vanderbilt University
15.3.11.1. Company Overview
15.3.11.2. Product Portfolio
15.3.11.3. SWOT Analysis
15.3.11.4. Strategic Overview
15.3.12. Genentech
15.3.12.1. Company Overview
15.3.12.2. Product Portfolio
15.3.12.3. SWOT Analysis
15.3.12.4. Strategic Overview
List of Tables
Table 01: Global Fusion Inhibitors Market Value (US$ Mn) Forecast, by Route of Administration, 2017‒2031
Table 02: Global Fusion Inhibitors Market Value (US$ Mn) Forecast, by 2017‒2031, by Indication
Table 03: Global Fusion Inhibitors Market Value (US$ Mn) Forecast, by Distribution Channel, 2017–2031
Table 04: Global Fusion Inhibitors Market Value (US$ Mn) Forecast, by Region, 2017–2031
Table 05: North America Fusion Inhibitors Market Value (US$ Mn) Forecast, by Country, 2017–2031
Table 06: North America Fusion Inhibitors Market Value (US$ Mn) Forecast, by Route of Administration, 2017‒2031
Table 07: North America Fusion Inhibitors Market Value (US$ Mn) Forecast, by Indication, 2017‒2031
Table 08: North America Fusion Inhibitors Market Value (US$ Mn) Forecast, by Distribution Channel, 2017–2031
Table 09: Europe Fusion Inhibitors Market Value (US$ Mn) Forecast, by Country/Sub-region, 2017–2031
Table 10: Europe Fusion Inhibitors Market Value (US$ Mn) Forecast, by Route of Administration, 2017‒2031
Table 11: Europe Fusion Inhibitors Market Value (US$ Mn) Forecast, by Indication, 2017‒2031
Table 12: Europe Fusion Inhibitors Market Value (US$ Mn) Forecast, by Distribution Channel, 2017–2031
Table 13: Asia Pacific Fusion Inhibitors Market Value (US$ Mn) Forecast, by Country/Sub-region, 2017–2031
Table 14: Asia Pacific Fusion Inhibitors Market Value (US$ Mn) Forecast, by Route of Administration, 2017‒2031
Table 15: Asia Pacific Fusion Inhibitors Market Value (US$ Mn) Forecast, by Indication, 2017‒2031
Table 16: Asia Pacific Fusion Inhibitors Market Value (US$ Mn) Forecast, by Distribution Channel, 2017–2031
Table 17: Latin America Fusion Inhibitors Market Value (US$ Mn) Forecast, by Country/Sub-region, 2017-2031
Table 18: Latin America Fusion Inhibitors Market Value (US$ Mn) Forecast, by Route of Administration, 2017‒2031
Table 19: Latin America Fusion Inhibitors Market Value (US$ Mn) Forecast, by Indication, 2017‒2031
Table 20: Latin America Fusion Inhibitors Market Value (US$ Mn) Forecast, by Distribution Channel, 2017–2031
Table 21: Middle East & Africa Fusion Inhibitors Market Value (US$ Mn) Forecast, by Country/Sub-region, 2017-2031
Table 22: Middle East & Africa Fusion Inhibitors Market Value (US$ Mn) Forecast, by Route of Administration, 2017‒2031
Table 23: Middle East & Africa Fusion Inhibitors Market Value (US$ Mn) Forecast, by Indication, 2017‒2031
Table 24: Middle East & Africa Fusion Inhibitors Market Value (US$ Mn) Forecast, by Distribution Channel, 2017–2031
List of Figures
Figure 01: Global Fusion Inhibitors Market Value (US$ Mn) Forecast, 2017–2031
Figure 02: Global Fusion Inhibitors Market Value Share, by Route of Administration, 2021
Figure 03: Global Fusion Inhibitors Market Value Share, by Indication, 2021
Figure 04: Global Fusion Inhibitors Market Value Share, by Distribution Channel, 2021
Figure 05: Global Fusion Inhibitors Market Value Share Analysis, by Route of Administration, 2021 and 2031
Figure 06: Global Fusion Inhibitors Market Attractiveness Analysis, by Route of Administration, 2022–2031
Figure 09: Global Fusion Inhibitors Market Value Share Analysis, by Indication, 2021 and 2031
Figure 10: Global Fusion Inhibitors Market Attractiveness Analysis, by Indication, 2022–2031
Figure 11: Global Fusion Inhibitors Market Value Share Analysis, by Distribution Channel, 2021 and 2031
Figure 12: Global Fusion Inhibitors Market Attractiveness Analysis, by Distribution Channel, 2022–2031
Figure 13: Global Fusion Inhibitors Market Value Share Analysis, by Region, 2021 and 2031
Figure 14: Global Fusion Inhibitors Market Attractiveness Analysis, by Region, 2022–2031
Figure 15: North America Fusion Inhibitors Market Value (US$ Mn) Forecast, 2017–2031
Figure 16: North America Fusion Inhibitors Market Value Share Analysis, by Country, 2021 and 2031
Figure 17: North America Fusion Inhibitors Market Attractiveness Analysis, by Country, 2022–2031
Figure 18: North America Fusion Inhibitors Market Value Share Analysis, by Route of Administration, 2021 and 2031
Figure 19: North America Fusion Inhibitors Market Attractiveness Analysis, by Route of Administration, 2022–2031
Figure 20: North America Fusion Inhibitors Market Value Share Analysis, by Indication, 2021 and 2031
Figure 21: North America Fusion Inhibitors Market Attractiveness Analysis, by Indication, 2022–2031
Figure 22: North America Fusion Inhibitors Market Value Share Analysis, by Distribution Channel, 2021 and 2031
Figure 23: North America Fusion Inhibitors Market Attractiveness Analysis, by Distribution Channel, 2022–2031
Figure 24: Europe Fusion Inhibitors Market Value (US$ Mn) Forecast, 2017–2031
Figure 25: Europe Fusion Inhibitors Market Value Share Analysis, by Country/Sub-region, 2021 and 2031
Figure 26: Europe Fusion Inhibitors Market Attractiveness Analysis, by Country/Sub-region, 2022–2031
Figure 27: Europe Fusion Inhibitors Market Value Share Analysis, by Route of Administration, 2021 and 2031
Figure 28: Europe Fusion Inhibitors Market Attractiveness Analysis, by Route of Administration, 2022–2031
Figure 29: Europe Fusion Inhibitors Market Value Share Analysis, by Indication, 2021 and 2031
Figure 30: Europe Fusion Inhibitors Market Attractiveness Analysis, by Indication, 2022–2031
Figure 31: Europe Fusion Inhibitors Market Value Share Analysis, by Distribution Channel, 2021 and 2031
Figure 32: Europe Fusion Inhibitors Market Attractiveness Analysis, by Distribution Channel, 2022–2031
Figure 33: Asia Pacific Fusion Inhibitors Market Value (US$ Mn) Forecast, 2017–2031
Figure 34: Asia Pacific Fusion Inhibitors Market Value Share Analysis, by Country/Sub-region, 2021 and 2031
Figure 35: Asia Pacific Fusion Inhibitors Market Attractiveness Analysis, by Country/Sub-region, 2022–2031
Figure 36: Asia Pacific Fusion Inhibitors Market Value Share Analysis, by Route of Administration, 2021 and 2031
Figure 37: Asia Pacific Fusion Inhibitors Market Attractiveness Analysis, by Route of Administration, 2022–2031
Figure 38: Asia Pacific Fusion Inhibitors Market Value Share Analysis, by Indication, 2021 and 2031
Figure 39: Asia Pacific Fusion Inhibitors Market Attractiveness Analysis, by Indication, 2022–2031
Figure 40: Asia Pacific Fusion Inhibitors Market Value Share Analysis, by Distribution Channel, 2021 and 2031
Figure 41: Asia Pacific Fusion Inhibitors Market Attractiveness Analysis, by Distribution Channel, 2022–2031
Figure 42: Latin America Fusion Inhibitors Market Value (US$ Mn) Forecast, 2017–2031
Figure 43: Latin America Fusion Inhibitors Market Value Share Analysis, by Country/Sub-region, 2021 and 2031
Figure 44: Latin America Fusion Inhibitors Market Attractiveness Analysis, by Country/Sub-region, 2021-2031
Figure 45: Latin America Fusion Inhibitors Market Value Share Analysis, by Route of Administration, 2021 and 2031
Figure 46: Latin America Fusion Inhibitors Market Attractiveness Analysis, by Route of Administration, 2022–2031
Figure 47: Latin America Fusion Inhibitors Market Value Share Analysis, by Indication, 2021 and 2031
Figure 48: Latin America Fusion Inhibitors Market Attractiveness Analysis, by Indication, 2022–2031
Figure 49: Latin America Fusion Inhibitors Market Value Share Analysis, by Distribution Channel, 2021 and 2031
Figure 50: Latin America Fusion Inhibitors Market Attractiveness Analysis, by Distribution Channel, 2022–2031
Figure 51: Middle East & Africa Fusion Inhibitors Market Value (US$ Mn) Forecast, 2017–2031
Figure 52: Middle East & Africa Fusion Inhibitors Market Value Share Analysis, by Country/Sub-region, 2021 and 2031
Figure 53: Middle East & Africa Fusion Inhibitors Market Attractiveness Analysis, by Country/Sub-region, 2021-2031
Figure 54: Middle East & Africa Fusion Inhibitors Market Value Share Analysis, by Route of Administration, 2021 and 2031
Figure 55: Middle East & Africa Fusion Inhibitors Market Attractiveness Analysis, by Route of Administration, 2022–2031
Figure 56: Middle East & Africa Fusion Inhibitors Market Value Share Analysis, by Indication, 2021 and 2031
Figure 57: Middle East & Africa Fusion Inhibitors Market Attractiveness Analysis, by Indication, 2022–2031
Figure 58: Middle East & Africa Fusion Inhibitors Market Value Share Analysis, by Distribution Channel, 2021 and 2031
Figure 59: Middle East & Africa Fusion Inhibitors Market Attractiveness Analysis, by Distribution Channel, 2022–2031
Figure 60: Company Share Analysis, 2021
Copyright © Transparency Market Research, Inc. All Rights reserved
Trust Online

Fusion Inhibitors Market