
Reports
Reports
Analysts’ Viewpoint on Filling Machines Market Scenario
The global filling machines market is anticipated to grow at a moderate pace during the forecast period owing to the rise in demand for advanced packaging technology, increase in consumer preference for rigid packaging, innovations by manufacturers, and favorable government policies. Introduction of automatic filling machines is also a prominent factor augmenting the filling machines market outlook. Benefits of filling machines such as safe filling, measured filling solution, and suitability for different container designs and sizes are also some of the key filling machines market drivers. Leading players in the filling machines market should focus on carrying out further innovations in machinery solutions to increase their global share.
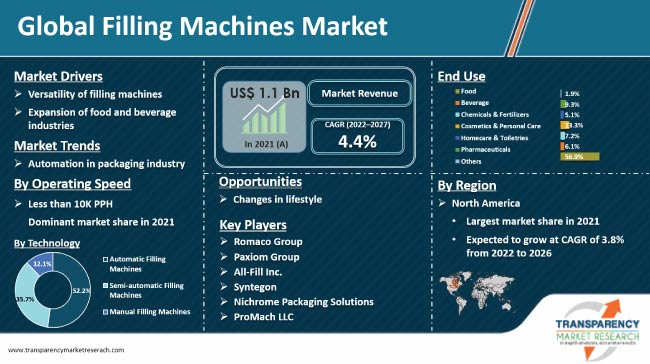
Every industry, including food and beverage, is evolving to incorporate automation. Food products are no longer manually packaged. Rise in demand for packaged food products is necessitating quicker and more accurate packaging, which is accomplished by adopting automatic and semi-automatic packaging machinery. Food manufacturers prefer filling machines to fill and seal various packaging containers with accurate volumetric measurements. As per the filling machines market demand analysis, the market is expanding steadily due to the general trend of using less resources to produce more, particularly in the food packaging industry. Food manufacturers are also striving to avoid additional labor costs, which is one of the key filling machines market challenges.
The COVID-19 pandemic led to the imposition of strict lockdowns to curb the spread of the disease. Various end use industries remained shut during the peak of the pandemic due to various factors such as trade barriers, government regulations, shortage of raw material & labor, imbalance in supply & demand, and disturbance in logistics & supply chain. However, industries offering essential commodities, such as food & beverage and pharmaceutical, remained operational during lockdowns. This had a positive impact on the global filling machines market. Demand for bottles and other rigid containers increased during the pandemic, as these are used to fill the newly developed drugs and medications. Overall, the filling machines market assessment indicated a moderate impact during the peak of the COVID-19 pandemic.
Later, the situation shifted back to the pre COVID level. End use industries started operating at full efficiencies, while manufacturers started to expand their production capacities to cover the incurred losses. This created growth opportunities for the global filling machines market. Thus, the global filling machines market growth forecast appears positive during the forecast period.
Rise in personal disposable income and changing lifestyles are significantly impacting packaging machines as well as filling machines market. A hectic professional life provides less time left to cook and store food. Thus, rise in preference for packaged foods such as fruit juices and dairy products is providing lucrative opportunities for filling machines manufacturers. Filling machines are widely used in dairy and food industries for products such as water, yogurt, ice cream, and other beverages. High demand for milk and dairy products across the globe is contributing to the growth of the filling machine market.
Filling machines are widely used for packaging in many industries, as they reduce packaging time vis-à-vis separate machines employed for each function such as machines/tools for package forming, filling finished products, and finally sealing. They also reduce floor space consumed by heavy/bulky machinery and the need for material handling equipment. Filling machines are not only popular due to their ability of packaging high volume/units in lesser time, but also due to their flexibility to provide attractive packaging. One filling machine can provide various shapes and sizes of packaging, according to the requirement of end product packaging. It is suitable for complex shapes of cups & bottles, as it easily takes the mold of the required shape.
Filling machines cover most kinds of primary packaging and are suitable for pouches, bottles, and other packaging format. Furthermore, filling machines can be used to pack powder, granular, liquid, and pasty or any other form of the product. These capabilities highly increase the applicability of the machines. Filling machines are thus used in food, pharmaceutical, cosmetics & personal care, and chemical industries.
China and India account for around 40% share of the filling machines market in Asia Pacific. Modern progresses in India and China have contributed to the market growth. As per the filling machines market sales analysis, increase in demand for food and beverage products and arrival of various global and local packaging manufacturers are driving the market in China and India. Growth in awareness about clean packaging for food is also propelling the demand for filling machines in these countries. Government initiatives and rise in expenditure on R&D are other positive filling machines market aspects in China and India.
Growth in sales of cosmetics is driving the global market for filling and sealing machines. Cosmetics are sold primarily through product presentations and packaging. Cosmetic packaging is often made of glass material that needs to be protected from damage. Therefore, cosmetic manufacturers use rigid packaging containers to pack products. Perfumes and deodorants are packed in bottles to maintain their quality until final consumption. This is anticipated to augment the sales of filling machines in the cosmetic & personal care industry.
The cosmetics and personal care market is growing at a considerable pace across the globe. In Europe, Germany and France account for major share of the cosmetics market in terms of demand. Thus, rise in demand for cosmetics is directly projected to boost the global filling machines market.
Innovations carried out by key filling machine manufacturers across the globe is creating growth opportunities for the filling machines market. Development of filling technology is gaining traction in end use industries. Adoption of automation by end use manufacturers is also expected to augment the sales of automatic filling machines. Thus, the global filling machines market is projected to grow during the forecast period.
North America is expected to dominate the global filling machines market during the forecast period. The market in the region is projected to expand 1.3 times its present market value by the end of the forecast period. It is anticipated to grow at healthy CAGR of 3.8% of the market value share by 2027. The U.S. held around 80% share of the North America filling machines market in 2021. The country is projected to emerge as the fastest-growing market for filling machines in North America in the near future. Easy availability of raw materials, cost-effective labor, and availability of the latest production technology among top players are key factors driving the market in North America.
The filling machines market report concludes with the company profiles section, which includes key information about major players in the global filling machines market. According to the filling machines market competition analysis, leading players in the market include Romaco Group, Paxiom Group, All-Fill Inc., NALBACH ENGINEERING COMPANY, Syntegon, The Adelphi Group of Companies, Nichrome Packaging Solutions, ProMach LLC, John Bean Technologies Corporation (JBT), GEA Group, ACMA S.p.A., and Ronchi Mario S.p.A.
Each of these companies has been summarized in the filling machines market report based on factors such as financial overview, company overview, business strategies, business segments, application portfolio, and recent developments.
|
Attribute |
Detail |
|
Market Size Value in 2021 |
US$ 1.1 Bn |
|
Market Forecast Value in 2027 |
US$ 1.5 Bn |
|
Growth Rate (CAGR) |
4.4% from 2022-to-2027 |
|
Forecast Period |
2022–2027 |
|
Quantitative Units |
US$ Bn for Value and Units for Volume |
|
Market Analysis |
It includes cross-segment analysis at the global as well as regional levels. Moreover, the qualitative analysis includes drivers, restraints, opportunities, key trends, and a parent industry overview. |
|
Competition Landscape |
|
|
Format |
Electronic (PDF) + Excel |
|
Market Segmentation |
|
|
Regions Covered |
|
|
Countries Covered |
|
|
Companies Profiled |
|
|
Customization Scope |
Available upon request |
|
Pricing |
Available upon request |
The global filling machines market was valued at US$ 1.1 Bn in 2021.
The global filling machines market is projected to reach US$ 1.5 Bn by the end of 2027.
Expansion of food and beverage industries is driving the sales of food packaging machines, including filling machines.
Automatic filling machines are largely preferred by end-use industries.
Europe, followed by North America, is estimated to showcase high demand for filling machines during the forecast period.
Romaco Group, Paxiom Group, All-Fill Inc., Syntegon, Nichrome Packaging Solutions, and ProMach LLC.
The China filling machines market is anticipated to grow 1.4 times the current market value during the forecast period.
The global filling machines market is projected to register a CAGR of 4.4% during 2022 to 2027.
1. Executive Summary
1.1. Market Overview
1.2. Market Analysis
1.3. TMR Analysis and Recommendations
2. Market Viewpoint
2.1. Market Definition
2.2. Market Taxonomy
3. Filling Machines Market Overview
3.1. Introduction
3.2. Global Filling Machines Market Overview
3.3. Filling Machines Market (US$ Mn) and Forecast
3.4. Value Chain Analysis
3.4.1. Exhaustive List of Active Participants
3.4.1.1. Component Suppliers
3.4.1.2. Filling Machines Manufacturers/Distributors
3.4.1.3. End Users/Customers
3.4.2. Profitability Margins
3.5. Macro-economic Factors – Correlation Analysis
3.6. Forecast Factors – Relevance & Impact
4. Impact of COVID-19
4.1. Current Statistics and Probable Future Impact
4.2. Impact of COVID-19 on Target Market
5. Filling Machines Market Analysis
5.1. Pricing Analysis
5.1.1. Pricing Assumption
5.1.2. Price Projections By Region
5.2. Market Size (US$ Mn) and Forecast
5.2.1. Market Size and Y-o-Y Growth
5.2.2. Absolute $ Opportunity
6. Filling Machines Market Dynamics
6.1. Drivers
6.2. Restraints
6.3. Opportunity Analysis
6.4. Trends
7. Global Filling Machines Market Analysis and Forecast, By Technology
7.1. Introduction
7.1.1. Market share and Basis Points (BPS) Analysis, By Technology
7.1.2. Y-o-Y Growth Projections, By Technology
7.2. Historical Market Value (US$ Mn) and Volume (Units), 2014-2021, By Technology
7.2.1. Automatic Filling Machines
7.2.2. Semi-automatic Filling Machines
7.2.3. Manual Filling Machines
7.3. Market Size (US$ Mn) and Volume (Units) Forecast Analysis 2022-2027, By Technology
7.3.1. Automatic Filling Machines
7.3.2. Semi-automatic Filling Machines
7.3.3. Manual Filling Machines
7.4. Market Attractiveness Analysis, By Technology
8. Global Filling Machines Market Analysis and Forecast, By Application
8.1. Introduction
8.1.1. Market share and Basis Points (BPS) Analysis, By Application
8.1.2. Y-o-Y Growth Projections, By Application
8.2. Historical Market Value (US$ Mn) and Volume (Units), 2014-2021, By Application
8.2.1. Pouches & Bags
8.2.2. Cups
8.2.3. Tubes
8.2.4. Blisters
8.2.5. Bottles & Jars
8.3. Market Size (US$ Mn) and Volume (Units) Forecast Analysis 2022-2027, By Application
8.3.1. Pouches & Bags
8.3.2. Cups
8.3.3. Tubes
8.3.4. Blisters
8.3.5. Bottles & Jars
8.4. Market Attractiveness Analysis, By Application
9. Global Filling Machines Market Analysis and Forecast, By Operating Speed
9.1. Introduction
9.1.1. Market share and Basis Points (BPS) Analysis, By Operating Speed
9.1.2. Y-o-Y Growth Projections, By Operating Speed
9.2. Historical Market Value (US$ Mn) and Volume (Units), 2014-2021, By Operating Speed
9.2.1. Less than 10K PPH
9.2.2. 10K to 15K PPH
9.2.3. More than 15K PPH
9.3. Market Size (US$ Mn) and Volume (Units) Forecast Analysis 2022-2027, By Operating Speed
9.3.1. Less than 10K PPH
9.3.2. 10K to 15K PPH
9.3.3. More than 15K PPH
9.4. Market Attractiveness Analysis, By Operating Speed
10. Global Filling Machines Market Analysis and Forecast, By End Use
10.1. Introduction
10.1.1. Market share and Basis Points (BPS) Analysis, By End Use
10.1.2. Y-o-Y Growth Projections, By End Use
10.2. Historical Market Value (US$ Mn) and Volume (Units), 2014-2021, By End Use
10.2.1. Food
10.2.2. Beverage
10.2.3. Chemicals & Fertilizers
10.2.4. Cosmetics & Personal Care
10.2.5. Homecare & Toiletries
10.2.6. Pharmaceuticals
10.2.7. Others
10.3. Market Size (US$ Mn) and Volume (Units) Forecast Analysis 2022-2027, By End Use
10.3.1. Food
10.3.2. Beverage
10.3.3. Chemicals & Fertilizers
10.3.4. Cosmetics & Personal Care
10.3.5. Homecare & Toiletries
10.3.6. Pharmaceuticals
10.3.7. Others
10.4. Market Attractiveness Analysis, By End Use
10.5. Prominent Trends
11. Global Filling Machines Market Analysis and Forecast, By Region
11.1. Introduction
11.1.1. Market share and Basis Points (BPS) Analysis By Region
11.1.2. Y-o-Y Growth Projections By Region
11.2. Historical Market Value (US$ Mn) and Volume (Units), 2014-2021, By Region
11.2.1. North America
11.2.2. Latin America
11.2.3. Europe
11.2.4. Asia Pacific
11.2.5. Middle East and Africa
11.3. Market Size (US$ Mn) and Volume (Units) Forecast Analysis 2022-2027 By Region
11.3.1. North America
11.3.2. Latin America
11.3.3. Europe
11.3.4. Asia Pacific
11.3.5. Middle East and Africa
11.4. Market Attractiveness Analysis By Region
12. North America Filling Machines Market Analysis and Forecast
12.1. Introduction
12.1.1. Market share and Basis Points (BPS) Analysis, By Country
12.1.2. Y-o-Y Growth Projections, By Country
12.2. Historical Market Value (US$ Mn) and Volume (Units), 2014-2021, By Country
12.3. Market Size (US$ Mn) and Volume (Units) Forecast Analysis 2022-2027, By Country
12.3.1. U.S.
12.3.2. Canada
12.4. Historical Market Value (US$ Mn) and Volume (Units), 2014-2021, By Technology
12.5. Market Size (US$ Mn) and Volume (Units) Forecast Analysis 2022-2027 Analysis 2022-2027, By Technology
12.5.1. Automatic Filling Machines
12.5.2. Semi-automatic Filling Machines
12.5.3. Manual Filling Machines
12.6. Historical Market Value (US$ Mn) and Volume (Units), 2014-2021, By Application
12.7. Market Size (US$ Mn) and Volume (Units) Forecast Analysis 2022-2027 Analysis 2022-2027, By Application
12.7.1. Pouches & Bags
12.7.2. Cups
12.7.3. Tubes
12.7.4. Blisters
12.7.5. Bottles & Jars
12.8. Historical Market Value (US$ Mn) and Volume (Units), 2014-2021, By Operating Speed
12.9. Market Size (US$ Mn) and Volume (Units) Forecast Analysis 2022-2027 Analysis 2022-2027, By Operating Speed
12.9.1. Less than 10K PPH
12.9.2. 10K to 15K PPH
12.9.3. More than 15K PPH
12.10. Historical Market Value (US$ Mn) and Volume (Units), 2014-2021, By End Use
12.11. Market Size (US$ Mn) and Volume (Units) Forecast Analysis 2022-2027, By End Use
12.11.1. Food
12.11.2. Beverage
12.11.3. Chemicals & Fertilizers
12.11.4. Cosmetics & Personal Care
12.11.5. Homecare & Toiletries
12.11.6. Pharmaceuticals
12.11.7. Others
12.12. Market Attractiveness Analysis
12.12.1. By Country
12.12.2. By Technology
12.12.3. By Application
12.12.4. By Operating Speed
12.12.5. By End Use
13. Latin America Filling Machines Market Analysis and Forecast
13.1. Introduction
13.1.1. Market share and Basis Points (BPS) Analysis, By Country
13.1.2. Y-o-Y Growth Projections, By Country
13.2. Historical Market Value (US$ Mn) and Volume (Units), 2014-2021, By Country
13.3. Market Size (US$ Mn) and Volume (Units) Forecast Analysis 2022-2027, By Country
13.3.1. Brazil
13.3.2. Mexico
13.3.3. Argentina
13.3.4. Rest of Latin America
13.4. Historical Market Value (US$ Mn) and Volume (Units), 2014-2021, By Technology
13.5. Market Size (US$ Mn) and Volume (Units) Forecast Analysis 2022-2027 Analysis 2022-2027, By Technology
13.5.1. Automatic Filling Machines
13.5.2. Semi-automatic Filling Machines
13.5.3. Manual Filling Machines
13.6. Historical Market Value (US$ Mn) and Volume (Units), 2014-2021, By Application
13.7. Market Size (US$ Mn) and Volume (Units) Forecast Analysis 2022-2027 Analysis 2022-2027, By Application
13.7.1. Pouches & Bags
13.7.2. Cups
13.7.3. Tubes
13.7.4. Blisters
13.7.5. Bottles & Jars
13.8. Historical Market Value (US$ Mn) and Volume (Units), 2014-2021, By Operating Speed
13.9. Market Size (US$ Mn) and Volume (Units) Forecast Analysis 2022-2027 Analysis 2022-2027, By Operating Speed
13.9.1. Less than 10K PPH
13.9.2. 10K to 15K PPH
13.9.3. More than 15K PPH
13.10. Historical Market Value (US$ Mn) and Volume (Units), 2014-2021, By End Use
13.11. Market Size (US$ Mn) and Volume (Units) Forecast Analysis 2022-2027, By End Use
13.11.1. Food
13.11.2. Beverage
13.11.3. Chemicals & Fertilizers
13.11.4. Cosmetics & Personal Care
13.11.5. Homecare & Toiletries
13.11.6. Pharmaceuticals
13.11.7. Others
13.12. Market Attractiveness Analysis
13.12.1. By Country
13.12.2. By Technology
13.12.3. By Application
13.12.4. By Operating Speed
13.12.5. By End Use
14. Europe Filling Machines Market Analysis and Forecast
14.1. Introduction
14.1.1. Market share and Basis Points (BPS) Analysis, By Country
14.1.2. Y-o-Y Growth Projections, By Country
14.2. Historical Market Value (US$ Mn) and Volume (Units), 2014-2021, By Country
14.3. Market Size (US$ Mn) and Volume (Units) Forecast Analysis 2022-2027, By Country
14.3.1. Germany
14.3.2. Italy
14.3.3. France
14.3.4. Spain
14.3.5. Nordics
14.3.6. U.K.
14.3.7. Benelux
14.3.8. Russia
14.3.9. Poland
14.3.10. Rest of Europe
14.4. Historical Market Value (US$ Mn) and Volume (Units), 2014-2021, By Technology
14.5. Market Size (US$ Mn) and Volume (Units) Forecast Analysis 2022-2027 Analysis 2022-2027, By Technology
14.5.1. Automatic Filling Machines
14.5.2. Semi-automatic Filling Machines
14.5.3. Manual Filling Machines
14.6. Historical Market Value (US$ Mn) and Volume (Units), 2014-2021, By Application
14.7. Market Size (US$ Mn) and Volume (Units) Forecast Analysis 2022-2027 Analysis 2022-2027, By Application
14.7.1. Pouches & Bags
14.7.2. Cups
14.7.3. Tubes
14.7.4. Blisters
14.7.5. Bottles & Jars
14.8. Historical Market Value (US$ Mn) and Volume (Units), 2014-2021, By Operating Speed
14.9. Market Size (US$ Mn) and Volume (Units) Forecast Analysis 2022-2027 Analysis 2022-2027, By Operating Speed
14.9.1. Less than 10K PPH
14.9.2. 10K to 15K PPH
14.9.3. More than 15K PPH
14.10. Historical Market Value (US$ Mn) and Volume (Units), 2014-2021, By End Use
14.11. Market Size (US$ Mn) and Volume (Units) Forecast Analysis 2022-2027, By End Use
14.11.1. Food
14.11.2. Beverage
14.11.3. Chemicals & Fertilizers
14.11.4. Cosmetics & Personal Care
14.11.5. Homecare & Toiletries
14.11.6. Pharmaceuticals
14.11.7. Others
14.12. Market Attractiveness Analysis
14.12.1. By Country
14.12.2. By Technology
14.12.3. By Application
14.12.4. By Operating Speed
14.12.5. By End Use
15. Asia Pacific Filling Machines Market Analysis and Forecast
15.1. Introduction
15.1.1. Market share and Basis Points (BPS) Analysis, By Country
15.1.2. Y-o-Y Growth Projections, By Country
15.2. Historical Market Value (US$ Mn) and Volume (Units), 2014-2021, By Country
15.3. Market Size (US$ Mn) and Volume (Units) Forecast Analysis 2022-2027, By Country
15.3.1. China
15.3.2. India
15.3.3. ASEAN
15.3.4. Australia & New Zealand
15.3.5. Japan
15.3.6. Rest of APAC
15.4. Historical Market Value (US$ Mn) and Volume (Units), 2014-2021, By Technology
15.5. Market Size (US$ Mn) and Volume (Units) Forecast Analysis 2022-2027 Analysis 2022-2027, By Technology
15.5.1. Automatic Filling Machines
15.5.2. Semi-automatic Filling Machines
15.5.3. Manual Filling Machines
15.6. Historical Market Value (US$ Mn) and Volume (Units), 2014-2021, By Application
15.7. Market Size (US$ Mn) and Volume (Units) Forecast Analysis 2022-2027 Analysis 2022-2027, By Application
15.7.1. Pouches & Bags
15.7.2. Cups
15.7.3. Tubes
15.7.4. Blisters
15.7.5. Bottles & Jars
15.8. Historical Market Value (US$ Mn) and Volume (Units), 2014-2021, By Operating Speed
15.9. Market Size (US$ Mn) and Volume (Units) Forecast Analysis 2022-2027 Analysis 2022-2027, By Operating Speed
15.9.1. Less than 10K PPH
15.9.2. 10K to 15K PPH
15.9.3. More than 15K PPH
15.10. Historical Market Value (US$ Mn) and Volume (Units), 2014-2021, By End Use
15.11. Market Size (US$ Mn) and Volume (Units) Forecast Analysis 2022-2027, By End Use
15.11.1. Food
15.11.2. Beverage
15.11.3. Chemicals & Fertilizers
15.11.4. Cosmetics & Personal Care
15.11.5. Homecare & Toiletries
15.11.6. Pharmaceuticals
15.11.7. Others
15.12. Market Attractiveness Analysis
15.12.1. By Country
15.12.2. By Technology
15.12.3. By Application
15.12.4. By Operating Speed
15.12.5. By End Use
16. Middle East and Africa Filling Machines Market Analysis and Forecast
16.1. Introduction
16.1.1. Market share and Basis Points (BPS) Analysis, By Country
16.1.2. Y-o-Y Growth Projections, By Country
16.2. Historical Market Value (US$ Mn) and Volume (Units), 2014-2021, By Country
16.3. Market Size (US$ Mn) and Volume (Units) Forecast Analysis 2022-2027, By Country
16.3.1. Northern Africa
16.3.2. GCC Countries
16.3.3. South Africa
16.3.4. Rest of MEA
16.4. Historical Market Value (US$ Mn) and Volume (Units), 2014-2021, By Technology
16.5. Market Size (US$ Mn) and Volume (Units) Forecast Analysis 2022-2027 Analysis 2022-2027, By Technology
16.5.1. Automatic Filling Machines
16.5.2. Semi-automatic Filling Machines
16.5.3. Manual Filling Machines
16.6. Historical Market Value (US$ Mn) and Volume (Units), 2014-2021, By Application
16.7. Market Size (US$ Mn) and Volume (Units) Forecast Analysis 2022-2027 Analysis 2022-2027, By Application
16.7.1. Pouches & Bags
16.7.2. Cups
16.7.3. Tubes
16.7.4. Blisters
16.7.5. Bottles & Jars
16.8. Historical Market Value (US$ Mn) and Volume (Units), 2014-2021, By Operating Speed
16.9. Market Size (US$ Mn) and Volume (Units) Forecast Analysis 2022-2027 Analysis 2022-2027, By Operating Speed
16.9.1. Less than 10K PPH
16.9.2. 10K to 15K PPH
16.9.3. More than 15K PPH
16.10. Historical Market Value (US$ Mn) and Volume (Units), 2014-2021, By End Use
16.11. Market Size (US$ Mn) and Volume (Units) Forecast Analysis 2022-2027, By End Use
16.11.1. Food
16.11.2. Beverage
16.11.3. Chemicals & Fertilizers
16.11.4. Cosmetics & Personal Care
16.11.5. Homecare & Toiletries
16.11.6. Pharmaceuticals
16.11.7. Others
16.12. Market Attractiveness Analysis
16.12.1. By Country
16.12.2. By Technology
16.12.3. By Application
16.12.4. By Operating Speed
16.12.5. By End Use
17. Country Wise Filling Machines Market Analysis, 2022-2027
17.1. U.S. Filling Machines Market Analysis
17.1.1. By Technology
17.1.2. By Application
17.1.3. By Operating Speed
17.1.4. By End Use
17.2. Canada Filling Machines Market Analysis
17.2.1. By Technology
17.2.2. By Application
17.2.3. By Operating Speed
17.2.4. By End Use
17.3. Brazil Filling Machines Market Analysis
17.3.1. By Technology
17.3.2. By Application
17.3.3. By Operating Speed
17.3.4. By End Use
17.4. Mexico Filling Machines Market Analysis
17.4.1. By Technology
17.4.2. By Application
17.4.3. By Operating Speed
17.4.4. By End Use
17.5. Germany Filling Machines Market Analysis
17.5.1. By Technology
17.5.2. By Application
17.5.3. By Operating Speed
17.5.4. By End Use
17.6. Spain Filling Machines Market Analysis
17.6.1. By Technology
17.6.2. By Application
17.6.3. By Operating Speed
17.6.4. By End Use
17.7. France Filling Machines Market Analysis
17.7.1. By Technology
17.7.2. By Application
17.7.3. By Operating Speed
17.7.4. By End Use
17.8. U K Filling Machines Market Analysis
17.8.1. By Technology
17.8.2. By Application
17.8.3. By Operating Speed
17.8.4. By End Use
17.9. Italy Filling Machines Market Analysis
17.9.1. By Technology
17.9.2. By Application
17.9.3. By Operating Speed
17.9.4. By End Use
17.10. Russia Filling Machines Market Analysis
17.10.1. By Technology
17.10.2. By Application
17.10.3. By Operating Speed
17.10.4. By End Use
17.11. China Filling Machines Market Analysis
17.11.1. By Technology
17.11.2. By Application
17.11.3. By Operating Speed
17.11.4. By End Use
17.12. India Filling Machines Market Analysis
17.12.1. By Technology
17.12.2. By Application
17.12.3. By Operating Speed
17.12.4. By End Use
17.13. Japan Filling Machines Market Analysis
17.13.1. By Technology
17.13.2. By Application
17.13.3. By Operating Speed
17.13.4. By End Use
17.14. GCC Countries Filling Machines Market Analysis
17.14.1. By Technology
17.14.2. By Application
17.14.3. By Operating Speed
17.14.4. By End Use
17.15. South Africa Filling Machines Market Analysis
17.15.1. By Technology
17.15.2. By Application
17.15.3. By Operating Speed
17.15.4. By End Use
18. Competitive Landscape
18.1. Market Structure
18.2. Competition Dashboard
18.3. Company Market Share Analysis
18.4. Company Profiles (Details – Overview, Financials, Strategy, Recent Developments, SWOT analysis)
18.5. Competition Deep Dive (Key Global Market Players)
18.5.1. Romaco Group
18.5.1.1. Overview
18.5.1.2. Financials
18.5.1.3. Strategy
18.5.1.4. Recent Developments
18.5.1.5. SWOT Analysis
18.5.2. Paxiom Group
18.5.2.1. Overview
18.5.2.2. Financials
18.5.2.3. Strategy
18.5.2.4. Recent Developments
18.5.2.5. SWOT Analysis
18.5.3. All-Fill Inc.
18.5.3.1. Overview
18.5.3.2. Financials
18.5.3.3. Strategy
18.5.3.4. Recent Developments
18.5.3.5. SWOT Analysis
18.5.4. NALBACH ENGINEERING COMPANY
18.5.4.1. Overview
18.5.4.2. Financials
18.5.4.3. Strategy
18.5.4.4. Recent Developments
18.5.4.5. SWOT Analysis
18.5.5. Syntegon
18.5.5.1. Overview
18.5.5.2. Financials
18.5.5.3. Strategy
18.5.5.4. Recent Developments
18.5.5.5. SWOT Analysis
18.5.6. The Adelphi Group of Companies
18.5.6.1. Overview
18.5.6.2. Financials
18.5.6.3. Strategy
18.5.6.4. Recent Developments
18.5.6.5. SWOT Analysis
18.5.7. Nichrome Packaging Solutions
18.5.7.1. Overview
18.5.7.2. Financials
18.5.7.3. Strategy
18.5.7.4. Recent Developments
18.5.7.5. SWOT Analysis
18.5.8. ProMach LLC
18.5.8.1. Overview
18.5.8.2. Financials
18.5.8.3. Strategy
18.5.8.4. Recent Developments
18.5.8.5. SWOT Analysis
18.5.9. John Bean Technologies Corporation (JBT)
18.5.9.1. Overview
18.5.9.2. Financials
18.5.9.3. Strategy
18.5.9.4. Recent Developments
18.5.9.5. SWOT Analysis
18.5.10. GEA Group
18.5.10.1. Overview
18.5.10.2. Financials
18.5.10.3. Strategy
18.5.10.4. Recent Developments
18.5.10.5. SWOT Analysis
18.5.11. ACMA S.p.A.
18.5.11.1. Overview
18.5.11.2. Financials
18.5.11.3. Strategy
18.5.11.4. Recent Developments
18.5.11.5. SWOT Analysis
18.5.12. Ronchi Mario S.p.A.
18.5.12.1. Overview
18.5.12.2. Financials
18.5.12.3. Strategy
18.5.12.4. Recent Developments
18.5.12.5. SWOT Analysis
18.5.13. BARRY-WEHMILLER COMPANIES
18.5.13.1. Overview
18.5.13.2. Financials
18.5.13.3. Strategy
18.5.13.4. Recent Developments
18.5.13.5. SWOT Analysis
18.5.14. E-PAK Machinery, Inc.
18.5.14.1. Overview
18.5.14.2. Financials
18.5.14.3. Strategy
18.5.14.4. Recent Developments
18.5.14.5. SWOT Analysis
18.5.15. Tokyo Automatic Machinery Works Ltd.
18.5.15.1. Overview
18.5.15.2. Financials
18.5.15.3. Strategy
18.5.15.4. Recent Developments
18.5.15.5. SWOT Analysis
18.5.16. APACKS
18.5.16.1. Overview
18.5.16.2. Financials
18.5.16.3. Strategy
18.5.16.4. Recent Developments
18.5.16.5. SWOT Analysis
18.5.17. PACK’R
18.5.17.1. Overview
18.5.17.2. Financials
18.5.17.3. Strategy
18.5.17.4. Recent Developments
18.5.17.5. SWOT Analysis
18.5.18. Acasi Machinery Inc.
18.5.18.1. Overview
18.5.18.2. Financials
18.5.18.3. Strategy
18.5.18.4. Recent Developments
18.5.18.5. SWOT Analysis
18.5.19. Machinery Automation
18.5.19.1. Overview
18.5.19.2. Financials
18.5.19.3. Strategy
18.5.19.4. Recent Developments
18.5.19.5. SWOT Analysis
18.5.20. HongKong SINBON Industrial Limited
18.5.20.1. Overview
18.5.20.2. Financials
18.5.20.3. Strategy
18.5.20.4. Recent Developments
18.5.20.5. SWOT Analysis
19. Assumptions and Acronyms Used
20. Research Methodology
List of Tables
Table 01: Global Filling Machines Market Historic Value (US$ Mn), By Technology 2014(H)-2021(A)
Table 02: Global Filling Machines Market Forecast Value (US$ Mn), By Technology 2022(E)-2027(F)
Table 03: Global Filling Machines Market Historic Volume (Units), By Technology 2014(H)-2021(A)
Table 04: Global Filling Machines Market Forecast Volume (Units), By Technology 2022(E)-2027(F)
Table 05: Global Filling Machines Market Historic Value (US$ Mn), By Application 2014(H)-2021(A)
Table 06: Global Filling Machines Market Forecast Value (US$ Mn), By Application 2022(E)-2027(F)
Table 07: Global Filling Machines Market Historic Volume (Units), By Application 2014(H)-2021(A)
Table 08: Global Filling Machines Market Forecast Volume (Units), By Application 2022(E)-2027(F)
Table 09: Global Filling Machines Market Historic Value (US$ Mn), By Operating Speed 2014(H)-2021(A)
Table 10: Global Filling Machines Market Forecast Value (US$ Mn), By Operating Speed 2022(E)-2027(F)
Table 11: Global Filling Machines Market Historic Volume (Units), By Operating Speed 2014(H)-2021(A)
Table 12: Global Filling Machines Market Forecast Volume (Units), By Operating Speed 2022(E)-2027(F)
Table 13: Global Filling Machines Market Historic Value (US$ Mn), By End Use 2014(H)-2021(A)
Table 14: Global Filling Machines Market Forecast Value (US$ Mn), By End Use 2022(E)-2027(F)
Table 15: Global Filling Machines Market Historic Volume (Units), By End Use 2014(H)-2021(A)
Table 16: Global Filling Machines Market Forecast Volume (Units), By End Use 2022(E)-2027(F)
Table 17: Global Filling Machines Market Historic Value (US$ Mn), By Region 2014(H)-2021(A)
Table 18: Global Filling Machines Market Forecast Value (US$ Mn), By Region 2022(E)-2027(F)
Table 19: Global Filling Machines Market Historic Volume (Units), By Region 2014(H)-2021(A)
Table 20: Global Filling Machines Market Forecast Volume (Units), By Region 2022(E)-2027(F)
Table 21: North America Filling Machines Market Historic Value (US$ Mn), By Technology 2014(H)-2021(A)
Table 22: North America Filling Machines Market Forecast Value (US$ Mn), By Technology 2022(E)-2027(F)
Table 23: North America Filling Machines Market Historic Volume (Units), By Technology 2014(H)-2021(A)
Table 24: North America Filling Machines Market Forecast Volume (Units), By Technology 2022(E)-2027(F)
Table 25: North America Filling Machines Market Historic Value (US$ Mn), By Application 2014(H)-2021(A)
Table 26: North America Filling Machines Market Forecast Value (US$ Mn), By Application 2022(E)-2027(F)
Table 27: North America Filling Machines Market Historic Volume (Units), By Application 2014(H)-2021(A)
Table 28: North America Filling Machines Market Forecast Volume (Units), By Application 2022(E)-2027(F)
Table 29: North America Filling Machines Market Historic Value (US$ Mn), By Operating Speed 2014(H)-2021(A)
Table 30: North America Filling Machines Market Forecast Value (US$ Mn), By Operating Speed 2022(E)-2027(F)
Table 31: North America Filling Machines Market Historic Volume (Units), By Operating Speed 2014(H)-2021(A)
Table 32: North America Filling Machines Market Forecast Volume (Units), By Operating Speed 2022(E)-2027(F)
Table 33: North America Filling Machines Market Historic Value (US$ Mn), By End Use 2014(H)-2021(A)
Table 34: North America Filling Machines Market Forecast Value (US$ Mn), By End Use 2022(E)-2027(F)
Table 35: North America Filling Machines Market Historic Volume (Units), By End Use 2014(H)-2021(A)
Table 36: North America Filling Machines Market Forecast Volume (Units), By End Use 2022(E)-2027(F)
Table 37: North America Filling Machines Market Historic Value (US$ Mn), By Country 2014(H)-2021(A)
Table 38: North America Filling Machines Market Forecast Value (US$ Mn), By Country 2022(E)-2027(F)
Table 39: North America Filling Machines Market Historic Volume (Units), By Country 2014(H)-2021(A)
Table 40: North America Filling Machines Market Forecast Volume (Units), By Country 2022(E)-2027(F)
Table 41: Latin America Filling Machines Market Historic Value (US$ Mn), By Technology 2014(H)-2021(A)
Table 42: Latin America Filling Machines Market Forecast Value (US$ Mn), By Technology 2022(E)-2027(F)
Table 43: Latin America Filling Machines Market Historic Volume (Units), By Technology 2014(H)-2021(A)
Table 44: Latin America Filling Machines Market Forecast Volume (Units), By Technology 2022(E)-2027(F)
Table 45: Latin America Filling Machines Market Historic Value (US$ Mn), By Application 2014(H)-2021(A)
Table 46: Latin America Filling Machines Market Forecast Value (US$ Mn), By Application 2022(E)-2027(F)
Table 47: Latin America Filling Machines Market Historic Volume (Units), By Application 2014(H)-2021(A)
Table 48: Latin America Filling Machines Market Forecast Volume (Units), By Application 2022(E)-2027(F)
Table 49: Latin America Filling Machines Market Historic Value (US$ Mn), By Operating Speed 2014(H)-2021(A)
Table 50: Latin America Filling Machines Market Forecast Value (US$ Mn), By Operating Speed 2022(E)-2027(F)
Table 51: Latin America Filling Machines Market Historic Volume (Units), By Operating Speed 2014(H)-2021(A)
Table 52: Latin America Filling Machines Market Forecast Volume (Units), By Operating Speed 2022(E)-2027(F)
Table 53: Latin America Filling Machines Market Historic Value (US$ Mn), By End Use 2014(H)-2021(A)
Table 54: Latin America Filling Machines Market Forecast Value (US$ Mn), By End Use 2022(E)-2027(F)
Table 55: Latin America Filling Machines Market Historic Volume (Units), By End Use 2014(H)-2021(A)
Table 56: Latin America Filling Machines Market Forecast Volume (Units), By End Use 2022(E)-2027(F)
Table 57: Latin America Filling Machines Market Historic Value (US$ Mn), By Country 2014(H)-2021(A)
Table 58: Latin America Filling Machines Market Forecast Value (US$ Mn), By Country 2022(E)-2027(F)
Table 59: Latin America Filling Machines Market Historic Volume (Units), By Country 2014(H)-2021(A)
Table 60: Latin America Filling Machines Market Forecast Volume (Units), By Country 2022(E)-2027(F)
Table 61: Europe Filling Machines Market Historic Value (US$ Mn), By Technology 2014(H)-2021(A)
Table 62: Europe Filling Machines Market Forecast Value (US$ Mn), By Technology 2022(E)-2027(F)
Table 63: Europe Filling Machines Market Historic Volume (Units), By Technology 2014(H)-2021(A)
Table 64: Europe Filling Machines Market Forecast Volume (Units), By Technology 2022(E)-2027(F)
Table 65: Europe Filling Machines Market Historic Value (US$ Mn), By Application 2014(H)-2021(A)
Table 66: Europe Filling Machines Market Forecast Value (US$ Mn), By Application 2022(E)-2027(F)
Table 67: Europe Filling Machines Market Historic Volume (Units), By Application 2014(H)-2021(A)
Table 68: Europe Filling Machines Market Forecast Volume (Units), By Application 2022(E)-2027(F)
Table 69: Europe Filling Machines Market Historic Value (US$ Mn), By Operating Speed 2014(H)-2021(A)
Table 70: Europe Filling Machines Market Forecast Value (US$ Mn), By Operating Speed 2022(E)-2027(F)
Table 71: Europe Filling Machines Market Historic Volume (Units), By Operating Speed 2014(H)-2021(A)
Table 72: Europe Filling Machines Market Forecast Volume (Units), By Operating Speed 2022(E)-2027(F)
Table 73: Europe Filling Machines Market Historic Value (US$ Mn), By End Use 2014(H)-2021(A)
Table 74: Europe Filling Machines Market Forecast Value (US$ Mn), By End Use 2022(E)-2027(F)
Table 75: Europe Filling Machines Market Historic Volume (Units), By End Use 2014(H)-2021(A)
Table 76: Europe Filling Machines Market Forecast Volume (Units), By End Use 2022(E)-2027(F)
Table 77: Europe Filling Machines Market Historic Value (US$ Mn), By Country 2014(H)-2021(A)
Table 78: Europe Filling Machines Market Forecast Value (US$ Mn), By Country 2022(E)-2027(F)
Table 79: Europe Filling Machines Market Historic Volume (Units), By Country 2014(H)-2021(A)
Table 80: Europe Filling Machines Market Forecast Volume (Units), By Country 2022(E)-2027(F)
Table 81: Asia Pacific Filling Machines Market Historic Value (US$ Mn), By Technology 2014(H)-2021(A)
Table 82: Asia Pacific Filling Machines Market Forecast Value (US$ Mn), By Technology 2022(E)-2027(F)
Table 83: Asia Pacific Filling Machines Market Historic Volume (Units), By Technology 2014(H)-2021(A)
Table 84: Asia Pacific Filling Machines Market Forecast Volume (Units), By Technology 2022(E)-2027(F)
Table 85: Asia Pacific Filling Machines Market Historic Value (US$ Mn), By Application 2014(H)-2021(A)
Table 86: Asia Pacific Filling Machines Market Forecast Value (US$ Mn), By Application 2022(E)-2027(F)
Table 87: Asia Pacific Filling Machines Market Historic Volume (Units), By Application 2014(H)-2021(A)
Table 88: Asia Pacific Filling Machines Market Forecast Volume (Units), By Application 2022(E)-2027(F)
Table 89: Asia Pacific Filling Machines Market Historic Value (US$ Mn), By Operating Speed 2014(H)-2021(A)
Table 90: Asia Pacific Filling Machines Market Forecast Value (US$ Mn), By Operating Speed 2022(E)-2027(F)
Table 91: Asia Pacific Filling Machines Market Historic Volume (Units), By Operating Speed 2014(H)-2021(A)
Table 92: Asia Pacific Filling Machines Market Forecast Volume (Units), By Operating Speed 2022(E)-2027(F)
Table 93: Asia Pacific Filling Machines Market Historic Value (US$ Mn), By End Use 2014(H)-2021(A)
Table 94: Asia Pacific Filling Machines Market Forecast Value (US$ Mn), By End Use 2022(E)-2027(F)
Table 95: Asia Pacific Filling Machines Market Historic Volume (Units), By End Use 2014(H)-2021(A)
Table 96: Asia Pacific Filling Machines Market Forecast Volume (Units), By End Use 2022(E)-2027(F)
Table 97: Asia Pacific Filling Machines Market Historic Value (US$ Mn), By Country 2014(H)-2021(A)
Table 98: Asia Pacific Filling Machines Market Forecast Value (US$ Mn), By Country 2022(E)-2027(F)
Table 99: Asia Pacific Filling Machines Market Historic Volume (Units), By Country 2014(H)-2021(A)
Table 100: Asia Pacific Filling Machines Market Forecast Volume (Units), By Country 2022(E)-2027(F)
Table 101: MEA Filling Machines Market Historic Value (US$ Mn), By Technology 2014(H)-2021(A)
Table 102: MEA Filling Machines Market Forecast Value (US$ Mn), By Technology 2022(E)-2027(F)
Table 103: MEA Filling Machines Market Historic Volume (Units), By Technology 2014(H)-2021(A)
Table 104: MEA Filling Machines Market Forecast Volume (Units), By Technology 2022(E)-2027(F)
Table 105: MEA Filling Machines Market Historic Value (US$ Mn), By Application 2014(H)-2021(A)
Table 106: MEA Filling Machines Market Forecast Value (US$ Mn), By Application 2022(E)-2027(F)
Table 107: MEA Filling Machines Market Historic Volume (Units), By Application 2014(H)-2021(A)
Table 108: MEA Filling Machines Market Forecast Volume (Units), By Application 2022(E)-2027(F)
Table 109: MEA Filling Machines Market Historic Value (US$ Mn), By Operating Speed 2014(H)-2021(A)
Table 110: MEA Filling Machines Market Forecast Value (US$ Mn), By Operating Speed 2022(E)-2027(F)
Table 111: MEA Filling Machines Market Historic Volume (Units), By Operating Speed 2014(H)-2021(A)
Table 112: MEA Filling Machines Market Forecast Volume (Units), By Operating Speed 2022(E)-2027(F)
Table 113: MEA Filling Machines Market Historic Value (US$ Mn), By End Use 2014(H)-2021(A)
Table 114: MEA Filling Machines Market Forecast Value (US$ Mn), By End Use 2022(E)-2027(F)
Table 115: MEA Filling Machines Market Historic Volume (Units), By End Use 2014(H)-2021(A)
Table 116: MEA Filling Machines Market Forecast Volume (Units), By End Use 2022(E)-2027(F)
Table 117: MEA Filling Machines Market Historic Value (US$ Mn), By Country 2014(H)-2021(A)
Table 118: MEA Filling Machines Market Forecast Value (US$ Mn), By Country 2022(E)-2027(F)
Table 119: MEA Filling Machines Market Historic Volume (Units), By Country 2014(H)-2021(A)
Table 120: MEA Filling Machines Market Forecast Volume (Units), By Country 2022(E)-2027(F)
List of Figures
Figure 01: Global Filling Machines Market Share Analysis by Technology, 2022E & 2027F
Figure 02: Global Filling Machines Market Attractiveness Analysis by Technology, 2022E-2027F
Figure 03: Global Filling Machines Market Y-o-Y Analysis by Technology, 2019H-2027F
Figure 04: Global Filling Machines Market Share Analysis by Application, 2022E & 2027F
Figure 05: Global Filling Machines Market Attractiveness Analysis by Application, 2022E-2027F
Figure 06: Global Filling Machines Market Y-o-Y Analysis by Application, 2019H-2027F
Figure 07: Global Filling Machines Market Share Analysis by Operating Speed, 2022E & 2027F
Figure 08: Global Filling Machines Market Attractiveness Analysis by Operating Speed, 2022E-2027F
Figure 09: Global Filling Machines Market Y-o-Y Analysis by Operating Speed, 2019H-2027F
Figure 10: Global Filling Machines Market Share Analysis by End Use, 2022E & 2027F
Figure 11: Global Filling Machines Market Attractiveness Analysis by End Use, 2022E-2027F
Figure 12: Global Filling Machines Market Y-o-Y Analysis by End Use, 2019H-2027F
Figure 13: Global Filling Machines Market Share Analysis by Region, 2022E & 2027F
Figure 14: Global Filling Machines Market Attractiveness Analysis by Region, 2022E-2027F
Figure 15: Global Filling Machines Market Y-o-Y Analysis by Region, 2019H-2027F
Figure 16: North America Filling Machines Market Share Analysis by Technology, 2022E & 2027F
Figure 17: North America Filling Machines Market Value Share Analysis by Application 2022(E)
Figure 18: North America Filling Machines Market Value Share Analysis by Operating Speed 2022(E)
Figure 19: North America Filling Machines Market Attractiveness Analysis by End Use, 2022E-2027F
Figure 20: North America Filling Machines Market Value Share Analysis by Country 2022(E)
Figure 21: Latin America Filling Machines Market Share Analysis by Technology, 2022E & 2027F
Figure 22: Latin America Filling Machines Market Value Share Analysis by Application 2022(E)
Figure 23: Latin America Filling Machines Market Value Share Analysis by Operating Speed 2022(E)
Figure 24: Latin America Filling Machines Market Attractiveness Analysis by End Use, 2022E-2027F
Figure 25: Latin America Filling Machines Market Value Share Analysis by Country 2022(E)
Figure 26: Europe Filling Machines Market Share Analysis by Technology, 2022E & 2027F
Figure 27: Europe Filling Machines Market Value Share Analysis by Application 2022(E)
Figure 28: Europe Filling Machines Market Value Share Analysis by Operating Speed 2022(E)
Figure 29: Europe Filling Machines Market Attractiveness Analysis by End Use, 2022E-2027F
Figure 30: Europe Filling Machines Market Value Share Analysis by Country 2022(E)
Figure 31: Asia Pacific Filling Machines Market Share Analysis by Technology, 2022E & 2027F
Figure 32: Asia Pacific Filling Machines Market Value Share Analysis by Application 2022(E)
Figure 33: Asia Pacific Filling Machines Market Value Share Analysis by Operating Speed 2022(E)
Figure 34: Asia Pacific Filling Machines Market Attractiveness Analysis by End Use, 2022E-2027F
Figure 35: Asia Pacific Filling Machines Market Value Share Analysis by Country 2022(E)
Figure 36: MEA Filling Machines Market Share Analysis by Technology, 2022E & 2027F
Figure 37: MEA Filling Machines Market Value Share Analysis by Application 2022(E)
Figure 38: MEA Filling Machines Market Value Share Analysis by Operating Speed 2022(E)
Figure 39: MEA Filling Machines Market Attractiveness Analysis by End Use, 2022E-2027F
Figure 40: MEA Filling Machines Market Value Share Analysis by Country 2022(E)
Figure 41: U.S. Filling Machines Market Value Share Analysis, by Technology, 2022E & 2027F
Figure 42: U.S. Filling Machines Market Value Share Analysis, by Application, 2022E
Figure 43: U.S. Filling Machines Market Value Share Analysis, by Operating Speed, 2022E
Figure 44: U.S. Filling Machines Market Value Share Analysis, by End Use, 2022E & 2027F
Figure 45: Canada Filling Machines Market Value Share Analysis, by Technology, 2022E & 2027F
Figure 46: Canada Filling Machines Market Value Share Analysis, by Application, 2022E
Figure 47: Canada Filling Machines Market Value Share Analysis, by Operating Speed, 2022E
Figure 48: Canada Filling Machines Market Value Share Analysis, by End Use, 2022E & 2027F
Figure 49: Brazil Filling Machines Market Value Share Analysis, by Technology, 2022E & 2027F
Figure 50: Brazil Filling Machines Market Value Share Analysis, by Application, 2022E
Figure 51: Brazil Filling Machines Market Value Share Analysis, by Operating Speed, 2022E
Figure 52: Brazil Filling Machines Market Value Share Analysis, by End Use, 2022E & 2027F
Figure 53: Mexico Filling Machines Market Value Share Analysis, by Technology, 2022E & 2027F
Figure 54: Mexico Filling Machines Market Value Share Analysis, by Application, 2022E
Figure 55: Mexico Filling Machines Market Value Share Analysis, by Operating Speed, 2022E
Figure 56: Mexico Filling Machines Market Value Share Analysis, by End Use, 2022E & 2027F
Figure 57: Germany Filling Machines Market Value Share Analysis, by Technology, 2022E & 2027F
Figure 58: Germany Filling Machines Market Value Share Analysis, by Application, 2022E
Figure 59: Germany Filling Machines Market Value Share Analysis, by Operating Speed, 2022E
Figure 60: Germany Filling Machines Market Value Share Analysis, by End Use, 2022E & 2027F
Figure 61: Spain Filling Machines Market Value Share Analysis, by Technology, 2022E & 2027F
Figure 62: Spain Filling Machines Market Value Share Analysis, by Application, 2022E
Figure 63: Spain Filling Machines Market Value Share Analysis, by Operating Speed, 2022E
Figure 64: Spain Filling Machines Market Value Share Analysis, by End Use, 2022E & 2027F
Figure 65: France Filling Machines Market Value Share Analysis, by Technology, 2022E & 2027F
Figure 66: France Filling Machines Market Value Share Analysis, by Application, 2022E
Figure 67: France Filling Machines Market Value Share Analysis, by Operating Speed, 2022E
Figure 68: France Filling Machines Market Value Share Analysis, by End Use, 2022E & 2027F
Figure 69: U.K. Filling Machines Market Value Share Analysis, by Technology, 2022E & 2027F
Figure 70: U.K. Filling Machines Market Value Share Analysis, by Application, 2022E
Figure 71: U.K. Filling Machines Market Value Share Analysis, by Operating Speed, 2022E
Figure 72: U.K. Filling Machines Market Value Share Analysis, by End Use, 2022E & 2027F
Figure 73: Italy Filling Machines Market Value Share Analysis, by Technology, 2022E & 2027F
Figure 74: Italy Filling Machines Market Value Share Analysis, by Application, 2022E
Figure 75: Italy Filling Machines Market Value Share Analysis, by Operating Speed, 2022E
Figure 76: Italy Filling Machines Market Value Share Analysis, by End Use, 2022E & 2027F
Figure 77: Russia Filling Machines Market Value Share Analysis, by Technology, 2022E & 2027F
Figure 78: Russia Filling Machines Market Value Share Analysis, by Application, 2022E
Figure 79: Russia Filling Machines Market Value Share Analysis, by Operating Speed, 2022E
Figure 80: Russia Filling Machines Market Value Share Analysis, by End Use, 2022E & 2027F
Figure 81: China Filling Machines Market Value Share Analysis, by Technology, 2022E & 2027F
Figure 82: China Filling Machines Market Value Share Analysis, by Application, 2022E
Figure 83: China Filling Machines Market Value Share Analysis, by Operating Speed, 2022E
Figure 84: China Filling Machines Market Value Share Analysis, by End Use, 2022E & 2027F
Figure 85: India Filling Machines Market Value Share Analysis, by Technology, 2022E & 2027F
Figure 86: India Filling Machines Market Value Share Analysis, by Application, 2022E
Figure 87: India Filling Machines Market Value Share Analysis, by Operating Speed, 2022E
Figure 88: India Filling Machines Market Value Share Analysis, by End Use, 2022E & 2027F
Figure 89: Japan Filling Machines Market Value Share Analysis, by Technology, 2022E & 2027F
Figure 90: Japan Filling Machines Market Value Share Analysis, by Application, 2022E
Figure 91: Japan Filling Machines Market Value Share Analysis, by Operating Speed, 2022E
Figure 92: Japan Filling Machines Market Value Share Analysis, by End Use, 2022E & 2027F
Figure 93: GCC Countries Filling Machines Market Value Share Analysis, by Technology, 2022E & 2027F
Figure 94: GCC Countries Filling Machines Market Value Share Analysis, by Application, 2022E
Figure 95: GCC Countries Filling Machines Market Value Share Analysis, by Operating Speed, 2022E
Figure 96: GCC Countries Filling Machines Market Value Share Analysis, by End Use, 2022E & 2027F
Figure 97: South Africa Filling Machines Market Value Share Analysis, by Technology, 2022E & 2027F
Figure 98: South Africa Filling Machines Market Value Share Analysis, by Application, 2022E
Figure 99: South Africa Filling Machines Market Value Share Analysis, by Operating Speed, 2022E
Figure 100: South Africa Filling Machines Market Value Share Analysis, by End Use, 2022E & 2027F
Copyright © Transparency Market Research, Inc. All Rights reserved
Trust Online

Filling Machines Market