
Reports
Reports
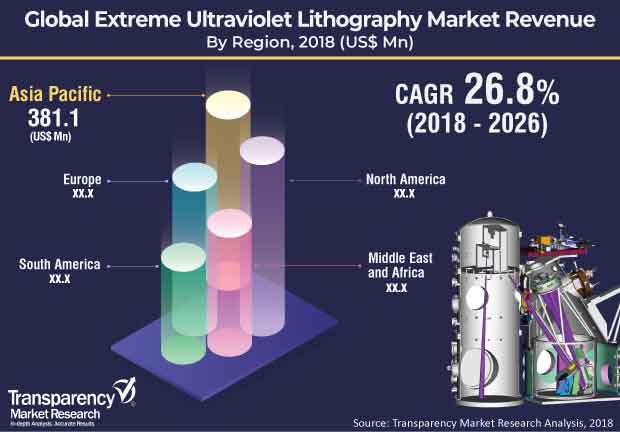
Extreme ultraviolet lithography (EUVL) is an advanced microchip manufacturing technology that uses a single mask instead of multiple masks. Extreme ultraviolet lithography uses a light source of extremely short wavelength i.e. around 13.5 nm. EUVL is a highly precise technology that manufactures microchips supporting 10 GHz of clock speed. EUVL functions when high-flaming energetic beams of ultraviolet light get reflected from a circuit design pattern onto a silicon wafer. This light should get reflected from mirrors, instead of refracting through lenses, onto the wafer. EUVL exhibits different properties at different wavelengths. For example, a typical industrial application of EUVL requires high-power ultraviolet light source of wavelength of 13.5 nm and throughput of 100 wafers per hour. Rising adoption of miniaturization of electronic circuit devices is expected to drive the global extreme ultraviolet lithography market during the forecast period. The global market is anticipated to reach value of US$ 3,807 Mn by 2026 from US$ 458.3 Mn in 2017, expanding at a CAGR of 26.8% during the forecast period.
The global extreme ultraviolet lithography market has been broadly segmented in terms of light source, end-use, and region. Based on light source, the market has been divided into laser-produced plasma, gas discharge, and vacuum sparks. Based on end-use, the market has been classified into memory, foundry, and integrated device manufacturers (IDMs). In terms of region, the global extreme ultraviolet lithography market has been segmented into North America, Europe, Asia Pacific, Middle East & Africa, and South America.
Among light sources, the laser-produced plasma segment holds a major share of the global extreme ultraviolet lithography market and it is expected to maintain its dominance throughout the forecast period. Advancements in miniaturization and sophistication of electronic devices are driving the market. However, the market faces challenges, due to high costs of extreme ultraviolet lithography equipment. These high costs are attributable to advanced, complex, and unique feature of the equipment in terms of using extremely short wavelengths. Increasing use of extreme ultraviolet lithography in the semiconductor industry and less number of masking layers compared to the argon fluoride immersion technology are expected to provide significant opportunities to the global extreme ultraviolet lithography market in the near future.
Considering rapid growth of the market, several players are investing in the global extreme ultraviolet lithography market. In October 2018, Samsung Electronics started wafer manufacture of its product i.e. 7-nanometer LPP (Low Power Plus) with the help of extreme ultraviolet (EUV) lithography.
One of the major players in the global extreme ultraviolet lithography market is ASML Holding. As of now, it is the only major manufacturer of extreme ultraviolet lithography. However, several other companies such as Intel Corporation, Samsung Electronics Co., Ltd., Taiwan Semiconductor Manufacturing Company Limited (TSMC), Canon, Inc., Nikon Corporation, and Carl Zeiss AG are expected to be among major players in the global extreme ultraviolet lithography market in the next few years.
1. Preface
1.1. Market Definition and Scope
1.2. Market Segmentation
1.3. Key Research Objectives
1.4. Research Highlights
2. Assumptions and Research Methodology
3. Executive Summary: Global Extreme Ultraviolet Lithography Market
4. Market Overview
4.1. Introduction
4.2. Market Dynamics
4.2.1. Drivers
4.2.2. Restraints
4.2.3. Opportunities
4.3. Key Trends Analysis
4.4. Global Extreme Ultraviolet Lithography Market Analysis and Forecast, 2016–2026
4.4.1. Market Revenue Projection (US$ Mn)
4.5. Porter’s Five Forces Analysis – Global Extreme Ultraviolet Lithography Market
4.6. Value Chain Analysis – Global Extreme Ultraviolet Lithography Market
4.7. Market Outlook
5. Global Extreme Ultraviolet Lithography Market Analysis and Forecast, by Light Source
5.1. Overview & Definitions
5.2. Global Extreme Ultraviolet Lithography Market Value (US$ Mn) Forecast, by Light Source, 2016–2026
5.2.1. Laser-produced Plasma
5.2.2. Gas Discharge
5.2.3. Vacuum Sparks
5.3. Light Source Comparison Matrix
5.4. Global Extreme Ultraviolet Lithography Market Attractiveness, by Light Source
6. Global Extreme Ultraviolet Lithography Market Analysis and Forecast, by End-use
6.1. Overview & Definitions
6.2. Global Extreme Ultraviolet Lithography Market Value (US$ Mn) Forecast, by End-use, 2016–2026
6.2.1. Memory
6.2.2. Foundry
6.2.3. IDM
6.3. End-use Comparison Matrix
6.4. Global Extreme Ultraviolet Lithography Market Attractiveness, by End-use
7. Global Extreme Ultraviolet Lithography Market Analysis and Forecast, by Region
7.1. Key Findings
7.2. Global Extreme Ultraviolet Lithography Market Value (US$ Mn) Forecast, by Region, 2016–2026
7.2.1. North America
7.2.2. Europe
7.2.3. Asia Pacific
7.2.4. Middle East & Africa
7.2.5. South America
7.3. Global Extreme Ultraviolet Lithography Market Attractiveness, by Region
8. North America Extreme Ultraviolet Lithography Market Analysis and Forecast
8.1. Key Findings
8.2. Key Trends
8.3. North America Extreme Ultraviolet Lithography Market Value (US$ Mn) Forecast, by Light Source, 2016–2026
8.3.1. Laser-produced Plasma
8.3.2. Gas Discharge
8.3.3. Vacuum Sparks
8.4. North America Extreme Ultraviolet Lithography Market Value (US$ Mn) Forecast, by End-use, 2016–2026
8.4.1. Memory
8.4.2. Foundry
8.4.3. IDM
8.5. North America Extreme Ultraviolet Lithography Market Value (US$ Mn) Forecast, by Country/Sub-region, 2016–2026
8.5.1. U.S.
8.5.2. Rest of North America
8.6. North America Extreme Ultraviolet Lithography Market Attractiveness Analysis
8.6.1. By Light Source
8.6.2. By End-use
8.6.3. By Country/Sub-region
9. Europe Extreme Ultraviolet Lithography Market Analysis and Forecast
9.1. Key Findings
9.2. Key Trends
9.3. Europe Extreme Ultraviolet Lithography Market Value (US$ Mn) Forecast, by Light Source, 2016–2026
9.3.1. Laser-produced Plasma
9.3.2. Gas Discharge
9.3.3. Vacuum Sparks
9.4. Europe Extreme Ultraviolet Lithography Market Value (US$ Mn) Forecast, by End-use, 2016–2026
9.4.1. Memory
9.4.2. Foundry
9.4.3. IDM
9.5. Europe Extreme Ultraviolet Lithography Market Value (US$ Mn) Forecast, by Country/Sub-region, 2016–2026
9.5.1. Germany
9.5.2. France
9.5.3. U.K.
9.5.4. Rest of Europe
9.6. Europe Extreme Ultraviolet Lithography Market Attractiveness Analysis
9.6.1. By Light Source
9.6.2. By End-use
9.6.3. By Country/Sub-region
10. Asia Pacific Extreme Ultraviolet Lithography Market Analysis and Forecast
10.1. Key Findings
10.2. Key Trends
10.3. Asia Pacific Extreme Ultraviolet Lithography Market Value (US$ Mn) Forecast, by Light Source, 2016–2026
10.3.1. Laser-produced Plasma
10.3.2. Gas Discharge
10.3.3. Vacuum Sparks
10.4. Asia Pacific Extreme Ultraviolet Lithography Market Value (US$ Mn) Forecast, by End-use, 2016–2026
10.4.1. Memory
10.4.2. Foundry
10.4.3. IDM
10.5. Asia Pacific Extreme Ultraviolet Lithography Market Value (US$ Mn) Forecast, by Country/Sub-region, 2016–2026
10.5.1. China
10.5.2. Japan
10.5.3. South Korea
10.5.4. Taiwan
10.5.5. Rest of Asia Pacific
10.6. Asia Pacific Extreme Ultraviolet Lithography Market Attractiveness Analysis
10.6.1. By Light Source
10.6.2. By End-use
10.6.3. By Country/Sub-region
11. Middle East & Africa (MEA) Extreme Ultraviolet Lithography Market Analysis and Forecast
11.1. Key Findings
11.2. Key Trends
11.3. Middle East & Africa Extreme Ultraviolet Lithography Market Value (US$ Mn) Forecast, by Light Source, 2016–2026
11.3.1. Laser-produced Plasma
11.3.2. Gas Discharge
11.3.3. Vacuum Sparks
11.4. Middle East & Africa Extreme Ultraviolet Lithography Market Value (US$ Mn) Forecast, by End-use, 2016–2026
11.4.1. Memory
11.4.2. Foundry
11.4.3. IDM
11.5. Middle East & Africa Extreme Ultraviolet Lithography Market Value (US$ Mn) Forecast, by Country/Sub-region, 2016–2026
11.5.1. GCC
11.5.2. South Africa
11.5.3. Rest of MEA
11.6. Middle East & Africa Extreme Ultraviolet Lithography Market Attractiveness Analysis
11.6.1. By Light Source
11.6.2. By End-use
11.6.3. By Country/Sub-region
12. South America Global Extreme Ultraviolet Lithography Market Analysis and Forecast
12.1. Key Findings
12.2. Key Trends
12.3. South America Extreme Ultraviolet Lithography Market Value (US$ Mn) Forecast, by Light Source, 2016–2026
12.3.1. Laser-produced Plasma
12.3.2. Gas Discharge
12.3.3. Vacuum Sparks
12.4. South America Extreme Ultraviolet Lithography Market Value (US$ Mn) Forecast, by End-use, 2016–2026
12.4.1. Memory
12.4.2. Foundry
12.4.3. IDM
12.5. South America Extreme Ultraviolet Lithography Market Value (US$ Mn) Forecast, by Country/Sub-region, 2016–2026
12.5.1. Brazil
12.5.2. Rest of South America
12.6. South America Extreme Ultraviolet Lithography Market Attractiveness Analysis
12.6.1. By Light Source
12.6.2. By End-use
12.6.3. By Country/Sub-region
13. Company Profiles (Details – Overview, Financials, SWOT Analysis, Strategy)
13.1. ASML Holding B.V.
13.1.1. Company Details
13.1.2. Company Description
13.1.3. Business Overview
13.1.4. Financials
13.1.5. SWOT Analysis
13.2. Intel Corporation
13.2.1. Company Details
13.2.2. Company Description
13.2.3. Business Overview
13.2.4. Financials
13.2.5. SWOT Analysis
13.3. Samsung Electronics Co., Ltd.
13.3.1. Company Details
13.3.2. Company Description
13.3.3. Business Overview
13.3.4. Financials
13.3.5. SWOT Analysis
13.4. Canon Inc.
13.4.1. Company Details
13.4.2. Company Description
13.4.3. Business Overview
13.4.4. Financials
13.4.5. SWOT Analysis
13.5. Nikon Corporation
13.5.1. Company Details
13.5.2. Company Description
13.5.3. Business Overview
13.5.4. Financials
13.5.5. SWOT Analysis
13.6. Carl Zeiss AG
13.6.1. Company Details
13.6.2. Company Description
13.6.3. Business Overview
13.6.4. Financials
13.6.5. SWOT Analysis
14. Key Takeaways
List of Tables
Table 01: Global Extreme Ultraviolet Lithography Market Value (US$ Mn) Forecast, by Light Source, 2016–2026
Table 02: Global Extreme Ultraviolet Lithography Market Value (US$ Mn) Forecast, by End-use, 2016–2026
Table 03: Global Extreme Ultraviolet Lithography Market Value (US$ Mn) Forecast, by Region, 2016–2026
Table 04: North America Extreme Ultraviolet Lithography Market Value (US$ Mn) Forecast, by Light Source, 2016–2026
Table 05: North America Extreme Ultraviolet Lithography Market Value (US$ Mn) Forecast, by End-use, 2016–2026
Table 06: North America Extreme Ultraviolet Lithography Market Value (US$ Mn) Forecast, by Country/Sub-region, 2016–2026
Table 07: Europe Extreme Ultraviolet Lithography Market Value (US$ Mn) Forecast, by Light Source, 2016–2026
Table 08: Europe Extreme Ultraviolet Lithography Market Value (US$ Mn) Forecast, by End-use, 2016–2026
Table 09: Europe Extreme Ultraviolet Lithography Market Value (US$ Mn) Forecast, by Country/Sub-region, 2016–2026
Table 10: Asia Pacific Extreme Ultraviolet Lithography Market Value (US$ Mn) Forecast, by Light Source, 2016–2026
Table 11: Asia Pacific Extreme Ultraviolet Lithography Market Value (US$ Mn) Forecast, by End-use, 2016–2026
Table 12: Asia Pacific Extreme Ultraviolet Lithography Market Value (US$ Mn) Forecast, by Country/Sub-region, 2016–2026
Table 13: Middle East & Africa Extreme Ultraviolet Lithography Market Value (US$ Mn) Forecast, by Light Source, 2016–2026
Table 14: Middle East & Africa Extreme Ultraviolet Lithography Market Value (US$ Mn) Forecast, by End-use, 2016–2026
Table 15: Middle East & Africa Extreme Ultraviolet Lithography Market Value (US$ Mn) Forecast, by Country/Sub-region, 2016–2026
Table 16: South America Extreme Ultraviolet Lithography Market Value (US$ Mn) Forecast, by Light Source, 2016–2026
Table 17: South America Extreme Ultraviolet Lithography Market Value (US$ Mn) Forecast, by End-use, 2016–2026
Table 18: South America Extreme Ultraviolet Lithography Market Value (US$ Mn) Forecast, by Country/Sub-region, 2016–2026
List of Figures
Figure 01: Global Extreme Ultraviolet Lithography Market Revenue (US$ Mn)
Figure 02: North America Extreme Ultraviolet Lithography Market CAGR, 2018–2026
Figure 03: Europe Extreme Ultraviolet Lithography Market CAGR, 2018–2026
Figure 04: Asia Pacific Extreme Ultraviolet Lithography Market CAGR, 2018–2026
Figure 05: Middle East & Africa Extreme Ultraviolet Lithography Market CAGR, 2018–2026
Figure 06: South America Extreme Ultraviolet Lithography Market CAGR, 2018–2026
Figure 07: Global Extreme Ultraviolet Lithography Market Value Share, by Region, 2017
Figure 08: Global Extreme Ultraviolet lithography Market Value (US$ Mn) Projection and Y-o-Y Growth, 2016–2026
Figure 09: Porter’s Five Forces Analysis
Figure 10: Value Chain Analysis
Figure 11: Global Extreme Ultraviolet Lithography Market Overview
Figure 12: Global Extreme Ultraviolet Lithography Market, by Light Source (2018)
Figure 13: Global Extreme Ultraviolet Lithography Market, by End-use (2018)
Figure 14: Global Extreme Ultraviolet Lithography Market Value Share Analysis, by Light Source, 2018 and 2026
Figure 15: Global Extreme Ultraviolet Lithography Market, by Light Source – Laser-produced Plasma
Figure 16: Global Extreme Ultraviolet Lithography Market, by Light Source – Gas Discharge
Figure 17: Global Extreme Ultraviolet Lithography Market, by Light Source – Vacuum Sparks
Figure 18: Segment Growth Matrix, 2018–2026 (%)
Figure 19: Segment Revenue Contribution, 2018–2026 (%)
Figure 20: Segment Compounded Growth Matrix (CAGR %)
Figure 21: Global Extreme Ultraviolet Lithography Market Attractiveness Analysis, by Light Source
Figure 22: Global Extreme Ultraviolet Lithography Market Value Share Analysis, by End-use, 2018 and 2026
Figure 23: Global Extreme Ultraviolet Lithography Market, by End-use – Memory
Figure 24: Global Extreme Ultraviolet Lithography Market, by End-use – Foundry
Figure 25: Global Extreme Ultraviolet Lithography Market, by End-use – IDM
Figure 26: Segment Growth Matrix, 2018–2026 (%)
Figure 27: Segment Revenue Contribution, 2018–2026 (%)
Figure 28: Segment Compounded Growth Matrix (CAGR %)
Figure 29: Global Extreme Ultraviolet Lithography Market Attractiveness Analysis, by End-use
Figure 30: Global Extreme Ultraviolet Lithography Market, by Region – North America
Figure 31: Global Extreme Ultraviolet Lithography Market, by Region – Europe
Figure 32: Global Extreme Ultraviolet Lithography Market, by Region – Asia Pacific
Figure 33: Global Extreme Ultraviolet Lithography Market, by Region – Middle East & Africa
Figure 34: Global Extreme Ultraviolet Lithography Market, by Region – South America
Figure 35: Global Extreme Ultraviolet Lithography Market Attractiveness Analysis, by Region
Figure 36: North America Extreme Ultraviolet Lithography Market Value (US$ Mn) Forecast, 2016–2026
Figure 37: North America Extreme Ultraviolet Lithography Market Y-o-Y Growth (%), 2016–2026
Figure 38: North America Extreme Ultraviolet Lithography Market Value Share Analysis, by Light Source, 2018 and 2026
Figure 39: North America Extreme Ultraviolet Lithography Market Value Share Analysis, by End-use, 2018 and 2026
Figure 40: North America Extreme Ultraviolet Lithography Market Value Share Analysis, by Country/Sub-region, 2018 and 2026
Figure 41: North America Extreme Ultraviolet Lithography Market Attractiveness Analysis, by Light Source
Figure 42: North America Extreme Ultraviolet Lithography Market Attractiveness Analysis, by End-use
Figure 43: North America Extreme Ultraviolet Lithography Market Attractiveness Analysis, by Country/Sub-region
Figure 44: Europe Extreme Ultraviolet Lithography Market Value (US$ Mn) Forecast, 2016–2026
Figure 45: Europe Extreme Ultraviolet Lithography Market Y-o-Y Growth (%), 2016–2026
Figure 46: Europe Extreme Ultraviolet Lithography Market Value Share Analysis, by Light Source, 2018 and 2026
Figure 47: Europe Extreme Ultraviolet Lithography Market Value Share Analysis, by End-use, 2018 and 2026
Figure 48: Europe Extreme Ultraviolet Lithography Market Value Share Analysis, by Country/Sub-region, 2018 and 2026
Figure 49: Europe Extreme Ultraviolet Lithography Market Attractiveness Analysis, by Light Source
Figure 50: Europe Extreme Ultraviolet Lithography Market Attractiveness Analysis, by End-use
Figure 51: Europe Extreme Ultraviolet Lithography Market Attractiveness Analysis, by Country/Sub-region
Figure 52: Asia Pacific Extreme Ultraviolet Lithography Market Value (US$ Mn) Forecast, 2016–2026
Figure 53: Asia Pacific Extreme Ultraviolet Lithography Market Y-o-Y Growth (%), 2016–2026
Figure 54: Asia Pacific Extreme Ultraviolet Lithography Market Value Share Analysis, by Light Source, 2018 and 2026
Figure 55: Asia Pacific Extreme Ultraviolet Lithography Market Value Share Analysis, by End-use, 2018 and 2026
Figure 56: Asia Pacific Extreme Ultraviolet Lithography Market Value Share Analysis, by Country/Sub-region, 2018 and 2026
Figure 57: Asia Pacific Extreme Ultraviolet Lithography Market Attractiveness Analysis, by Light Source
Figure 58: Asia Pacific Extreme Ultraviolet Lithography Market Attractiveness Analysis, by End-use
Figure 59: Asia Pacific Extreme Ultraviolet Lithography Market Attractiveness Analysis, by Country/Sub-region
Figure 60: Middle East & Africa Extreme Ultraviolet Lithography Market Value (US$ Mn) Forecast, 2016–2026
Figure 61: Middle East & Africa Extreme Ultraviolet Lithography Market Y-o-Y Growth (%), 2016–2026
Figure 62: Middle East & Africa Extreme Ultraviolet Lithography Market Value Share Analysis, by Light Source, 2018 and 2026
Figure 63: Middle East & Africa Extreme Ultraviolet Lithography Market Value Share Analysis, by End-use, 2018 and 2026
Figure 64: Middle East & Africa Extreme Ultraviolet Lithography Market Value Share Analysis, by Country/Sub-region, 2018 and 2026
Figure 65: Middle East & Africa Extreme Ultraviolet Lithography Market Attractiveness Analysis, by Light Source
Figure 66: Middle East & Africa Extreme Ultraviolet Lithography Market Attractiveness Analysis, by End-use
Figure 67: Middle East & Africa Extreme Ultraviolet Lithography Market Attractiveness Analysis, by Country/Sub-region
Figure 68: South America Extreme Ultraviolet Lithography Market Value (US$ Mn) Forecast, 2016–2026
Figure 69: South America Extreme Ultraviolet Lithography Market Y-o-Y Growth (%), 2016–2026
Figure 70: South America Extreme Ultraviolet Lithography Market Value Share Analysis, by Light Source, 2018 and 2026
Figure 71: South America Extreme Ultraviolet Lithography Market Value Share Analysis, by End-use, 2018 and 2026
Figure 72: South America Extreme Ultraviolet Lithography Market Value Share Analysis, by Country/Sub-region, 2018 and 2026
Figure 73: South America Extreme Ultraviolet Lithography Market Attractiveness Analysis, by Light Source
Figure 74: South America Extreme Ultraviolet Lithography Market Attractiveness Analysis, by End-use
Figure75: South America Extreme Ultraviolet Lithography Market Attractiveness Analysis, by Country/Sub-region
Figure 76: ASML Holding N.V. Net Sales, by Region, (2017)
Figure 77: ASML Holding N.V. Revenue (US$ Mn) & Y-o-Y Growth (%), 2015–2017
Figure 78: Intel Corporation Net Sales, by Region, (2017)
Figure 79: Intel Corporation Revenue (US$ Mn) & Y-o-Y Growth (%), 2015–2017
Figure 80: Samsung Electronics Co., Ltd. Net Sales, by Region, (2017)
Figure 81: Samsung Electronics Co., Ltd Revenue (US$ Mn) & Y-o-Y Growth (%), 2015–2017
Figure 82: TSMC Net Sales, by Region, (2017)
Figure 83: TSMC Revenue (US$ Mn) & Y-o-Y Growth (%), 2015–2017
Figure 84: Canon, Inc. Net Sales, by Region, (2017)
Figure 85: Canon, Inc. Revenue (US$ Mn) & Y-o-Y Growth (%), 2015–2017
Figure 86: Nikon Corporation Net Sales, by Region, (2018)
Figure 87: Nikon Corporation Revenue (US$ Mn) & Y-o-Y Growth (%), 2016–2018
Figure 88: Carl Zeiss AG Net Sales, by Region, (2017)
Figure 89: Carl Zeiss AG Revenue (US$ Mn) & Y-o-Y Growth (%), 2015–2017
Copyright © Transparency Market Research, Inc. All Rights reserved
Trust Online

Extreme Ultraviolet Lithography (EUVL) Market