
Reports
Reports
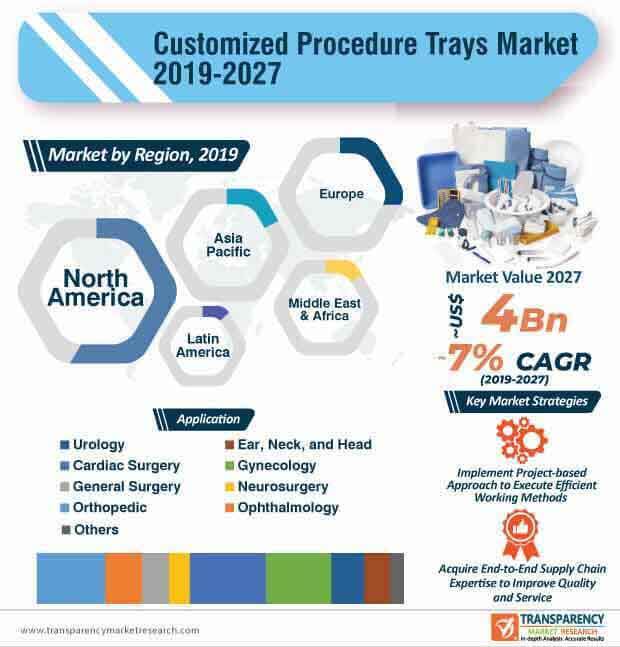
The COVID-19 (Coronavirus) public health emergency is encouraging companies in the customized procedure trays market to extend their resources to support frontline healthcare workers. For instance, on April 1 2020, the U.S. leader of medical supplies Medline, announced collaboration with education and training partner HealthStream in order to provide carefully-curated courses to the healthcare staff on appropriate utilization of customized procedure trays (CPT) and are imparting knowledge on infection control due to the onset of COVID-19. Such advancements are bolstering the growth for the customized procedure trays market, which is anticipated to reach a value of ~US$ 4 Bn by the end of 2027.
Along with customized procedure trays, companies are educating healthcare workers on appropriate usage of personal protective equipment (PPE) by increasing the availability of curriculum and toolkits. As the number of COVID-19 patients continues to soar, leading healthcare universities and companies are increasing efforts to offer multiple resources across the continuum of care.
In order to improve quality and services associated with customized procedure trays, companies are gaining expertise in their end-to-end supply chain to optimize price of products. Such operational practices are providing cost efficiency to companies by eliminating third party costs. In the wake of the surging COVID-19 outbreak, manufacturers are focusing on efficient sterilization methods to prevent incidence of infections among healthcare practitioners and patients. As such, companies in the customized procedure trays market are innovating on operational performance to boost their credibility in the global landscape.
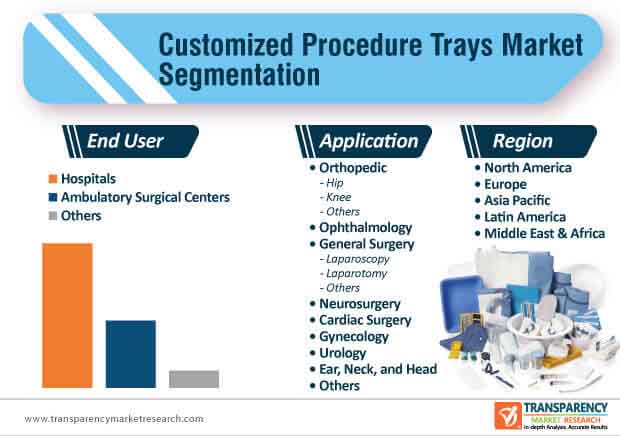
Companies in the customized procedure trays market are focusing on identifying various O.R. (Operating Room) challenges, especially in the area of cardiac surgeries. As such, the revenue of cardiac surgery applications is anticipated for aggressive growth during the forecast period and is estimated to dictate the highest revenue among all applications in the market for customized procedure trays. As companies are growing increasingly aware that the O.R. in healthcare facilities is always under pressure to improve patient outcomes, stakeholders are leveraging their services, which is estimated to boost the growth of the market, predicted to expand at a CAGR of ~7% during the forecast period.
The customized procedure trays market is consolidated where ~86% of the market is dominated by leading players. However, high prevalence of patient loss due to time-consuming equipment preparation pose as a hurdle for companies. Hence, companies are increasing their focus on insight-driver services to boost clinical numbers. For instance, Cardinal Health— one of the U.S. prominent medical products and services company, is relying on Presource®— their insight-driven procedural packaging services solution, to help clinicians meet operational efficiencies.
Insight-driven procedural packing product solutions are being highly publicized in the customized procedure trays market, owing to their time-efficiency and increased supply chain efficiencies. Manufacturers are increasing their production capabilities to boost the availability of innovative customized procedure trays with the help of crucial data and insight-driven services.
Apart from cardiac surgeries and orthopedic applications, manufacturers in the customized procedure trays market are unlocking revenue streams of ophthalmology procedures. For instance, Lense Home— a company dealing with end-to-end ophthalmology field solution services is helping clinicians meet convenience and operational efficiency by catering to individual requirements of surgeons. Manufacturers are increasing the availability of sterile and single-to-use kits to help surgeons associated with ophthalmology procedures achieve time efficiency. As such, companies in the customized procedure trays market are increasing their production capacities in single-use products such as drapes, gloves, surgical gown, and the likes.
High prevalence of patients undergoing cataract and LASIK surgeries are generating incremental opportunities for companies in the market for customized procedure trays. They are adopting the project-based approach to establish efficient communication channels with the staff in hospitals. Thus, companies in the market for customized procedure trays are adopting innovative approaches to gain better understanding of a hospital’s working methods, leading to success in improving patient quality of life.
Analysts’ Viewpoint
Since healthcare institutions are already pressed for time due to increasing number of COVID-19 patients being admitted for treatment, companies in the customized procedure trays market are increasing their production capacities to meet demanding needs. This is evident since manufacturers are producing single-use and reusable drapes, gloves, and surgical gowns to support frontline healthcare workers.
Insight-driven procedural packing solutions are overcoming the issue of fatalities due to time-consuming equipment preparation. Hence, companies should increase their research spending in data and insight-driven services that meet time-efficiency goals and boost clinical numbers. They are increasing efforts to build teams of experienced product specialists that deploy project-based approach to enhance patient care in healthcare institutions.
Customized procedure trays market is anticipated to reach a value of ~US$ 4 Bn by the end of 2027
Customized procedure trays market is driven by the rise in prevalence of chronic diseases, increase in surgeries across the globe
The cardiac surgery segment accounted for the largest share of the global customized procedure trays market
North America accounted for major share of the global customized procedure trays market
Key players in the global customized procedure trays market include 3M Healthcare, Paul Hartmann AG, B. Braun Melsungen AG, Becton, Dickinson and Company (BD), Cardinal Health
1. Preface
1.1. Market Definition and Scope
1.2. Market Segmentation
1.3. Key Research Objectives
1.4. Research Highlights
2. Assumptions and Research Methodology
3. Executive Summary: Global Customized Procedure Trays Market
4. Market Overview
4.1. Introduction
4.1.1. Market Definition
4.1.2. Industry Evolution / Developments
4.2. Overview
4.3. Market Dynamics
4.3.1. Drivers
4.3.2. Restraints
4.3.3. Opportunities
4.4. Global Customized Procedure Trays Market Analysis and Forecast, 2017–2027
4.4.1. Market Revenue Projections (US$ Mn)
5. Key Insights
5.1. Disease Prevalence & Incidence Rate globally with Key countries
5.2. Information on number of surgeries performed (Annually)
5.3. Pricing Analysis
5.4. Information on Custom Procedure Trays (Adoption, supply chain, cost/quality)
5.5. Government Regulations
5.6. Custom Procedure Tray Used per Procedure
6. Global Customized Procedure Trays Market Analysis and Forecast, by Application
6.1. Introduction & Definition
6.2. Key Findings / Developments
6.3. Customized Procedure Trays Market Value Forecast, by Application, 2017–2027
6.3.1. Orthopedic
6.3.1.1. Hip
6.3.1.2. Knee
6.3.1.3. Others
6.3.2. Ophthalmology
6.3.3. General Surgery
6.3.3.1. Laparoscopy
6.3.3.2. Laparotomy
6.3.3.3. Others
6.3.4. Neurosurgery
6.3.5. Cardiac Surgery
6.3.6. Gynecology
6.3.7. Urology
6.3.8. Ear, Neck, and Head
6.3.9. Others
6.4. Market Attractiveness Analysis, by Application
7. Global Customized Procedure Trays Market Analysis and Forecast, by End-user
7.1. Introduction & Definition
7.2. Key Findings / Developments
7.3. Customized Procedure Trays Market Value Forecast, by End-user, 2017–2027
7.3.1. Hospitals
7.3.2. Ambulatory Surgical Centers
7.3.3. Others
7.4. Market Attractiveness Analysis, by End-user
8. Global Customized Procedure Trays Market Analysis and Forecast, by Region
8.1. Key Findings
8.2. Customized Procedure Trays Market Value Forecast, by Region
8.2.1. North America
8.2.2. Europe
8.2.3. Asia Pacific
8.2.4. Latin America
8.2.5. Middle East & Africa
8.3. Market Attractiveness Analysis, by Region
9. North America Customized Procedure Trays Market Analysis and Forecast
9.1. Introduction
9.1.1. Key Findings
9.1.2. Policies and Regulations
9.1.3. Price Trend Analysis
9.1.4. Key Trends
9.2. North America Customized Procedure Trays Market Value Forecast, by Application, 2017–2027
9.2.1. Orthopedic
9.2.1.1. Hip
9.2.1.2. Knee
9.2.1.3. Others
9.2.2. Ophthalmology
9.2.3. General Surgery
9.2.3.1. Laparoscopy
9.2.3.2. Laparotomy
9.2.3.3. Others
9.2.4. Neurosurgery
9.2.5. Cardiac Surgery
9.2.6. Gynecology
9.2.7. Urology
9.2.8. Ear, Neck, and Head
9.2.9. Others
9.3. Market Attractiveness Analysis, by Application
9.4. North America Customized Procedure Trays Market Value Forecast, by End-user, 2017–2027
9.4.1. Hospitals
9.4.2. Ambulatory Surgical Centers
9.4.3. Others
9.5. North America Customized Procedure Trays Market Value Forecast, by Country, 2017–2027
9.5.1. U.S.
9.5.2. Canada
9.6. North America Customized Procedure Trays Market Attractiveness Analysis
9.6.1. By Application
9.6.2. By End-user
9.6.3. By Country
10. Europe Customized Procedure Trays Market Analysis and Forecast
10.1. Introduction
10.1.1. Key Findings
10.1.2. Policies and Regulations
10.1.3. Price Trend Analysis
10.1.4. Key Trends
10.2. Europe Customized Procedure Trays Market Value Forecast, by Application, 2017–2027
10.2.1. Orthopedic
10.2.1.1. Hip
10.2.1.2. Knee
10.2.1.3. Others
10.2.2. Ophthalmology
10.2.3. General Surgery
10.2.3.1. Laparoscopy
10.2.3.2. Laparotomy
10.2.3.3. Others
10.2.4. Neurosurgery
10.2.5. Cardiac Surgery
10.2.6. Gynecology
10.2.7. Urology
10.2.8. Ear, Neck, and Head
10.2.9. Others
10.3. Europe Customized Procedure Trays Market Value Forecast, by End-user, 2017–2027
10.3.1. Hospitals
10.3.2. Ambulatory Surgical Centers
10.3.3. Others
10.4. Europe Customized Procedure Trays Market Value Forecast, by Country/Sub-region, 2017–2027
10.4.1. Central Europe
10.4.1.1. Denmark
10.4.1.2. Finland
10.4.1.3. Ireland
10.4.1.4. Norway
10.4.1.5. Sweden
10.4.1.6. United Kingdom
10.4.1.7. Greece
10.4.1.8. Italy
10.4.1.9. Portugal
10.4.1.10. Spain
10.4.1.11. Rest of Central Europe
10.4.2. Eastern Europe
10.4.2.1. Bulgaria
10.4.2.2. Czech Republic
10.4.2.3. Hungary
10.4.2.4. Poland
10.4.2.5. Romania
10.4.2.6. Slovakia
10.4.2.7. Rest of Eastern Europe
10.4.3. Western Europe
10.4.3.1. Austria
10.4.3.2. Belgium
10.4.3.3. France
10.4.3.4. Germany
10.4.3.5. Luxembourg
10.4.3.6. Netherlands
10.4.3.7. Switzerland
10.4.3.8. Rest of Western Europe
10.5. Europe Customized Procedure Trays Market Attractiveness Analysis
10.5.1. By Application
10.5.2. By End-user
10.5.3. By Country/Sub-region
11. Asia Pacific Customized Procedure Trays Market Analysis and Forecast
11.1. Introduction
11.1.1. Key Findings
11.1.2. Policies and Regulations
11.1.3. Price Trend Analysis
11.1.4. Key Trends
11.2. Asia Pacific Customized Procedure Trays Market Value Forecast, by Application, 2017–2027
11.2.1. Orthopedic
11.2.1.1. Hip
11.2.1.2. Knee
11.2.1.3. Others
11.2.2. Ophthalmology
11.2.3. General Surgery
11.2.3.1. Laparoscopy
11.2.3.2. Laparotomy
11.2.3.3. Others
11.2.4. Neurosurgery
11.2.5. Cardiac Surgery
11.2.6. Gynecology
11.2.7. Urology
11.2.8. Ear, Neck, and Head
11.2.9. Others
11.3. Asia Pacific Customized Procedure Trays Market Value Forecast, by End-user, 2017–2027
11.3.1. Hospitals
11.3.2. Ambulatory Surgical Centers
11.3.3. Others
11.4. Asia Pacific Customized Procedure Trays Market Value Forecast, by Country/Sub-region, 2017–2027
11.4.1. China
11.4.2. Japan
11.4.3. India
11.4.4. Australia & New Zealand
11.4.5. Rest of Asia Pacific
11.5. Asia Pacific Customized Procedure Trays Market Attractiveness Analysis
11.5.1. By Application
11.5.2. By End-user
11.5.3. By Country/Sub-region
12. Latin America Customized Procedure Trays Market Analysis and Forecast
12.1. Introduction
12.1.1. Key Findings
12.1.2. Policies and Regulations
12.1.3. Price Trend Analysis
12.1.4. Key Trends
12.2. Latin America Customized Procedure Trays Market Value Forecast, by Application, 2017–2027
12.2.1. Orthopedic
12.2.1.1. Hip
12.2.1.2. Knee
12.2.1.3. Others
12.2.2. Ophthalmology
12.2.3. General Surgery
12.2.3.1. Laparoscopy
12.2.3.2. Laparotomy
12.2.3.3. Others
12.2.4. Neurosurgery
12.2.5. Cardiac Surgery
12.2.6. Gynecology
12.2.7. Urology
12.2.8. Ear, Neck, and Head
12.2.9. Others
12.3. Latin America Customized Procedure Trays Market Value Forecast, by End-user, 2017–2027
12.3.1. Hospitals
12.3.2. Ambulatory Surgical Centers
12.3.3. Others
12.4. Latin America Customized Procedure Trays Market Value Forecast, by Country/Sub-region, 2017–2027
12.4.1. Brazil
12.4.2. Mexico
12.4.3. Rest of Latin America
12.5. Latin America Customized Procedure Trays Market Attractiveness Analysis
12.5.1. By Application
12.5.2. By End-user
12.5.3. By Country/Sub-region
13. Middle East & Africa Customized Procedure Trays Market Analysis and Forecast
13.1. Introduction
13.1.1. Key Findings
13.2. Middle East & Africa Customized Procedure Trays Market Value Forecast, by Application , 2017–2027
13.2.1. Orthopedic
13.2.1.1. Hip
13.2.1.2. Knee
13.2.1.3. Others
13.2.2. Ophthalmology
13.2.3. General Surgery
13.2.3.1. Laparoscopy
13.2.3.2. Laparotomy
13.2.3.3. Others
13.2.4. Neurosurgery
13.2.5. Cardiac Surgery
13.2.6. Gynecology
13.2.7. Urology
13.2.8. Ear, Neck, and Head
13.2.9. Others
13.3. Middle East & Africa Customized Procedure Trays Market Value Forecast, by End-user, 2017–2027
13.3.1. Hospitals
13.3.2. Diagnostics Centers
13.3.3. Others
13.4. Middle East & Africa Customized Procedure Trays Market Value Forecast, by Country/Sub-region, 2017–2027
13.4.1. Middle East
13.4.1.1. Saudi Arabia
13.4.1.2. UAE
13.4.1.3. Israel
13.4.1.4. Rest of Middle East
13.4.2. Africa
13.4.2.1. South Africa
13.4.2.2. Nigeria
13.4.2.3. Egypt
13.4.2.4. Rest of Africa
13.5. Middle East & Africa Customized Procedure Trays Market Attractiveness Analysis
13.5.1. By Application
13.5.2. By End-user
13.5.3. By Country/Sub-region
14. Competitive Landscape
14.1. Market Player - Competition Matrix (By Tier and Size of companies)
14.2. Market Share Analysis, by Company, 2018
14.3. Company Profiles
14.3.1. 3M Healthcare
14.3.1.1. Company Overview (HQ, Business Segments, Employee Strength)
14.3.1.2. Product Portfolio
14.3.1.3. Strategic Overview
14.3.1.4. SWOT Analysis
14.3.2. Abmedica s.p.a.
14.3.2.1. Company Overview (HQ, Business Segments, Employee Strength)
14.3.2.2. Product Portfolio
14.3.2.3. Strategic Overview
14.3.2.4. SWOT Analysis
14.3.3. Angiokard Medizintechnik GmbH
14.3.3.1. Company Overview (HQ, Business Segments, Employee Strength)
14.3.3.2. Product Portfolio
14.3.3.3. SWOT Analysis
14.3.4. B. Braun Melsungen AG
14.3.4.1. Company Overview (HQ, Business Segments, Employee Strength)
14.3.4.2. Financial Overview
14.3.4.3. Product Portfolio
14.3.4.4. Strategic Overview
14.3.4.5. SWOT Analysis
14.3.5. Beaver-Visitec International, Inc.
14.3.5.1. Company Overview (HQ, Business Segments, Employee Strength)
14.3.5.2. Product Portfolio
14.3.5.3. Strategic Overview
14.3.5.4. SWOT Analysis
14.3.6. Becton, Dickinson and Company (BD)
14.3.6.1. Company Overview (HQ, Business Segments, Employee Strength)
14.3.6.2. Product Portfolio
14.3.6.3. Strategic Overview
14.3.6.4. SWOT Analysis
14.3.7. Biometrix
14.3.7.1. Company Overview (HQ, Business Segments, Employee Strength)
14.3.7.2. Strategic Overview
14.3.7.3. SWOT Analysis
14.3.8. Cardinal Health, Inc.
14.3.8.1. Company Overview (HQ, Business Segments, Employee Strength)
14.3.8.2. Financial Overview
14.3.8.3. Product Portfolio
14.3.8.4. Strategic Overview
14.3.8.5. SWOT Analysis
14.3.9. CeMed GmbH
14.3.9.1. Company Overview (HQ, Business Segments, Employee Strength)
14.3.9.2. Product Portfolio
14.3.9.3. SWOT Analysis
14.3.10. Dina-Hitex Spol. s r.o
14.3.10.1. Company Overview (HQ, Business Segments, Employee Strength)
14.3.10.2. Product Portfolio
14.3.10.3. SWOT Analysis
14.3.11. Fapomed
14.3.11.1. Company Overview (HQ, Business Segments, Employee Strength)
14.3.11.2. Product Portfolio
14.3.11.3. Strategic Overview
14.3.11.4. SWOT Analysis
14.3.12. Kimal PLC
14.3.12.1. Company Overview (HQ, Business Segments, Employee Strength)
14.3.12.2. Product Portfolio
14.3.12.3. Strategic Overview
14.3.12.4. SWOT Analysis
14.3.13. Lohmann & Rauscher International
14.3.13.1. Company Overview (HQ, Business Segments, Employee Strength)
14.3.13.2. Product Portfolio
14.3.13.3. Strategic Overview
14.3.13.4. SWOT Analysis
14.3.14. Medica Europe BV
14.3.14.1. Company Overview (HQ, Business Segments, Employee Strength)
14.3.14.2. Product Portfolio
14.3.14.3. Strategic Overview
14.3.14.4. SWOT Analysis
14.3.15. Med-Italia Biomedica s.r.l.
14.3.15.1. Company Overview (HQ, Business Segments, Employee Strength)
14.3.15.2. Financial Overview
14.3.15.3. Product Portfolio
14.3.15.4. Strategic Overview
14.3.15.5. SWOT Analysis
14.3.16. Medline Industries
14.3.16.1. Company Overview (HQ, Business Segments, Employee Strength)
14.3.16.2. Product Portfolio
14.3.16.3. Strategic Overview
14.3.16.4. SWOT Analysis
14.3.17. Medtronic plc
14.3.17.1. Company Overview (HQ, Business Segments, Employee Strength)
14.3.17.2. Financial Overview
14.3.17.3. Product Portfolio
14.3.17.4. Strategic Overview
14.3.17.5. SWOT Analysis
14.3.18. Merit Medical Systems
14.3.18.1. Company Overview (HQ, Business Segments, Employee Strength)
14.3.18.2. Product Portfolio
14.3.18.3. Strategic Overview
14.3.18.4. SWOT Analysis
14.3.19. Mölnlycke Health Care AB
14.3.19.1. Company Overview (HQ, Business Segments, Employee Strength)
14.3.19.2. Financial Overview
14.3.19.3. Product Portfolio
14.3.19.4. Strategic Overview
14.3.19.5. SWOT Analysis
14.3.20. Owens & Minor, Inc.
14.3.20.1. Company Overview (HQ, Business Segments, Employee Strength)
14.3.20.2. Financial Overview
14.3.20.3. Product Portfolio
14.3.20.4. Strategic Overview
14.3.20.5. SWOT Analysis
14.3.21. Paul Hartmann AG
14.3.21.1. Company Overview (HQ, Business Segments, Employee Strength)
14.3.21.2. Financial Overview
14.3.21.3. Product Portfolio
14.3.21.4. Strategic Overview
14.3.21.5. SWOT Analysis
14.3.22. Pennine Healthcare
14.3.22.1. Company Overview (HQ, Business Segments, Employee Strength)
14.3.22.2. Product Portfolio
14.3.22.3. Strategic Overview
14.3.22.4. SWOT Analysis
14.3.23. Priontex
14.3.23.1. Company Overview (HQ, Business Segments, Employee Strength)
14.3.23.2. Product Portfolio
14.3.23.3. Strategic Overview
14.3.23.4. SWOT Analysis
14.3.24. Raguse
14.3.24.1. Company Overview (HQ, Business Segments, Employee Strength)
14.3.24.2. Product Portfolio
14.3.24.3. Strategic Overview
14.3.24.4. SWOT Analysis
14.3.25. Rocialle Healthcare Ltd.
14.3.25.1. Company Overview (HQ, Business Segments, Employee Strength)
14.3.25.2. Product Portfolio
14.3.25.3. Strategic Overview
14.3.25.4. SWOT Analysis
14.3.26. Servicio Integral Hospitalario, S.L.
14.3.26.1. Company Overview (HQ, Business Segments, Employee Strength)
14.3.26.2. Product Portfolio
14.3.26.3. SWOT Analysis
14.3.27. Smith Medical
14.3.27.1. Company Overview (HQ, Business Segments, Employee Strength)
14.3.27.2. Product Portfolio
14.3.27.3. Strategic Overview
14.3.27.4. SWOT Analysis
14.3.28. Sterisets Medical Products
14.3.28.1. Company Overview (HQ, Business Segments, Employee Strength)
14.3.28.2. Product Portfolio
14.3.28.3. Strategic Overview
14.3.28.4. SWOT Analysis
14.3.29. STS Medical Group
14.3.29.1. Company Overview (HQ, Business Segments, Employee Strength)
14.3.29.2. Product Portfolio
14.3.29.3. Strategic Overview
14.3.29.4. SWOT Analysis
14.3.30. Teleflex Incorporated
14.3.30.1. Company Overview (HQ, Business Segments, Employee Strength)
14.3.30.2. Financial Overview
14.3.30.3. Product Portfolio
14.3.30.4. Strategic Overview
14.3.30.5. SWOT Analysis
14.3.31. The Cardiva Group
14.3.31.1. Company Overview (HQ, Business Segments, Employee Strength)
14.3.31.2. Product Portfolio
14.3.31.3. Strategic Overview
14.3.31.4. SWOT Analysis
14.3.32. UNISURGE International Limited
14.3.32.1. Company Overview (HQ, Business Segments, Employee Strength)
14.3.32.2. Financial Overview
14.3.32.3. Product Portfolio
14.3.32.4. Strategic Overview
14.3.32.5. SWOT Analysis
14.3.33. Vygon U.S.A
14.3.33.1. Company Overview (HQ, Business Segments, Employee Strength)
14.3.33.2. Product Portfolio
14.3.33.3. Strategic Overview
14.3.33.4. SWOT Analysis
List of Tables
Table 01: Number of surgeries performed per 100,000 population (2017)
Table 02: Number of surgeries performed per 100,000 population (2017)
Table 03: Number of surgeries performed per 100,000 population (2017)
Table 04: Pricing Assessment: Customized Procedure Trays
Table 05: Pricing Assessment: Customized Procedure Trays
Table 06: Pricing Assessment: Customized Procedure Trays
Table 07: Pricing Assessment: Customized Procedure Trays
Table 08: Custom Procedure Tray Used per Procedure
Table 09: Global Customized Procedure Trays Market Value (US$ Mn) Forecast, by Application, 2018–2027
Table 10: Global Customized Procedure Trays Market Value (US$ Mn) Forecast, by End-user, 2018–2027
Table 11: Global Customized Procedure Trays Market Value (US$ Mn) Forecast, by Region, 2018–2027
Table 12: North America Customized Procedure Trays Market Value (US$ Mn) Forecast, by Country, 2018–2027
Table 13: North America Customized Procedure Trays Market Value (US$ Mn) Forecast, by Application, 2018–2027
Table 14: North America Customized Procedure Trays Market Value (US$ Mn) Forecast, by End-user, 2018–2027
Table 15: Europe Customized Procedure Trays Market Value (US$ Mn) Forecast, by Country/Sub-region, 2018–2027
Table 16: Central Europe Customized Procedure Trays Market Value (US$ Mn) Forecast, by Country, 2018–2027
Table 17: Central Europe Customized Procedure Trays Market Value (US$ Mn) Forecast, by Country, 2018–2027
Table 18: Eastern Europe Customized Procedure Trays Market Value (US$ Mn) Forecast, by Country, 2018–2027
Table 19: Western Europe Customized Procedure Trays Market Value (US$ Mn) Forecast, by Country, 2018–2027
Table 20: Europe Customized Procedure Trays Market Value (US$ Mn) Forecast, by Application, 2018–2027
Table 21: Europe Customized Procedure Trays Market Value (US$ Mn) Forecast, by End-user, 2018–2027
Table 22: Asia Pacific Customized Procedure Trays Market Value (US$ Mn) Forecast, by Country/Sub-region, 2018–2027
Table 23: Asia Pacific Customized Procedure Trays Market Value (US$ Mn) Forecast, by Application, 2018–2027
Table 24: Asia Pacific Customized Procedure Trays Market Value (US$ Mn) Forecast, by End-user, 2018–2027
Table 25: Latin America Customized Procedure Trays Market Value (US$ Mn) Forecast, by Country/Sub-region, 2018–2027
Table 26: Latin America Customized Procedure Trays Market Value (US$ Mn) Forecast, by Application, 2018–2027
Table 27: Latin America Customized Procedure Trays Market Value (US$ Mn) Forecast, by End-user, 2018–2027
Table 28: Middle East & Africa Customized Procedure Trays Market Value (US$ Mn) Forecast, by Country/Sub-region, 2018–2027
Table 29: Middle East Customized Procedure Trays Market Value (US$ Mn) Forecast, by Country, 2018–2027
Table 30: Africa Customized Procedure Trays Market Value (US$ Mn) Forecast, by Country, 2018–2027
Table 31: Middle East & Africa Customized Procedure Trays Market Value (US$ Mn) Forecast, by Application, 2018–2027
Table 32: Middle East & Africa Customized Procedure Trays Market Value (US$ Mn) Forecast, by End-user, 2018–2027
List of Figures
Figure 01:Global Customized Procedure Trays Market Value (US$ Mn), 2018 and 2027
Figure 02: Market Snapshot
Figure 03: Global Customized Procedure Trays Market Value (US$ Mn) Forecast, 2018–2027
Figure 04: Global Customized Procedure Trays Market Value Share, by Application, 2018
Figure 05: Global Customized Procedure Trays Market Value Share, by End-user, 2018
Figure 06: Global Customized Procedure Trays Market Value Share, by Region, 2018
Figure 07: Global Customized Procedure Trays Market, by Application, 2018 and 2027
Figure 08: Global Customized Procedure Trays Market, by Application, 2018 and 2027
Figure 09: Global Customized Procedure Trays Market Value Share Analysis, by Application, 2018 and 2027
Figure 10: Global Customized Procedure Trays Market Value (US$ Mn) Forecast and Y-o-Y Growth (%), by Orthopedic, 2018–2027
Figure 11: Global Customized Procedure Trays Market Value (US$ Mn) Forecast and Y-o-Y Growth (%), by Ophthalmology, 2018–2027
Figure 12: Global Customized Procedure Trays Market Value (US$ Mn) Forecast and Y-o-Y Growth (%), by General Surgery, 2018–2027
Figure 13: Global Customized Procedure Trays Market Value (US$ Mn) Forecast and Y-o-Y Growth (%), by Neurosurgery, 2018–2027
Figure 14: Global Customized Procedure Trays Market Value (US$ Mn) Forecast and Y-o-Y Growth (%), by Cardiac Surgery, 2018–2027
Figure 15: Global Customized Procedure Trays Market Value (US$ Mn) Forecast and Y-o-Y Growth (%), by Gynecology, 2018–2027
Figure 16: Global Customized Procedure Trays Market Value (US$ Mn) Forecast and Y-o-Y Growth (%), by Urology, 2018–2027
Figure 17: Global Customized Procedure Trays Market Value (US$ Mn) Forecast and Y-o-Y Growth (%), by Ear, Neck, and Head, 2018–2027
Figure 18: Global Customized Procedure Trays Market Value (US$ Mn) Forecast and Y-o-Y Growth (%), by Others, 2018–2027
Figure 19: Global Customized Procedure Trays Market Attractiveness, by Application, 2019–2027
Figure 20: Global Customized Procedure Trays Market Value Share Analysis, by End-user, 2018 and 2027
Figure 21: Global Customized Procedure Trays Market Value (US$ Mn) Forecast and Y-o-Y Growth (%), by Hospitals, 2018–2027
Figure 22: Global Customized Procedure Trays Market Value (US$ Mn) Forecast and Y-o-Y Growth (%), by Ambulatory Surgical Centers, 2018–2027
Figure 23: Global Customized Procedure Trays Market Value (US$ Mn) Forecast and Y-o-Y Growth (%), by Others, 2018–2027
Figure 24: Global Customized Procedure Trays Market Attractiveness, by End-user, 2019–2027
Figure 25: Global Customized Procedure Trays Market Value Share Analysis, by Region, 2018 and 2027
Figure 26: Global Customized Procedure Trays Market Attractiveness, by Region, 2019–2027
Figure 27: North America Customized Procedure Trays Market Value (US$ Mn) Forecast and Y-o-Y Growth (%) Projection, 2018–2027
Figure 28: North America Customized Procedure Trays Market Value Share Analysis, by Country, 2018 and 2027
Figure 29: North America Customized Procedure Trays Market Attractiveness Analysis, by Country, 2019–2027
Figure 30: North America Customized Procedure Trays Market Value Share Analysis, by Application, 2018 and 2027
Figure 31: North America Customized Procedure Trays Market Attractiveness Analysis, by Application, 2019–2027
Figure 32: North America Customized Procedure Trays Market Value Share Analysis, by End-user, 2018 and 2027
Figure 33: North America Customized Procedure Trays Market Attractiveness Analysis, by End-user, 2019–2027
Figure 34: Europe Customized Procedure Trays Market Value (US$ Mn) Forecast and Y-o-Y Growth (%) Projection, 2018–2027
Figure 35: Europe Customized Procedure Trays Market Value Share Analysis, by Country/Sub-region, 2018 and 2027
Figure 36: Europe Customized Procedure Trays Market Attractiveness Analysis, by Country/Sub-region, 2019–2027
Figure 37: Europe Customized Procedure Trays Market Value Share Analysis, by Application, 2018 and 2027
Figure 38: Europe Customized Procedure Trays Market Attractiveness Analysis, by Application, 2019–2027
Figure 39: Europe Customized Procedure Trays Market Value Share Analysis, by End-user, 2018 and 2027
Figure 40: Europe Customized Procedure Trays Market Attractiveness Analysis, by End-user, 2019–2027
Figure 41: Asia Pacific Customized Procedure Trays Market Value (US$ Mn) Forecast and Y-o-Y Growth (%) Projection, 2018–2027
Figure 42: Asia Pacific Customized Procedure Trays Market Value Share Analysis, by Country/Sub-region, 2018 and 2027
Figure 43: Asia Pacific Customized Procedure Trays Market Attractiveness Analysis, by Country/ Sub-region, 2019–2027
Figure 44: Asia Pacific Customized Procedure Trays Market Value Share Analysis, by Application, 2018 and 2027
Figure 45: Asia Pacific Customized Procedure Trays Market Attractiveness Analysis, by Application, 2019–2027
Figure 46: Asia Pacific Customized Procedure Trays Market Value Share Analysis, by End-user, 2018 and 2027
Figure 47: Asia Pacific Customized Procedure Trays Market Attractiveness Analysis, by End-user, 2019–2027
Figure 48: Latin America Customized Procedure Trays Market Value (US$ Mn) Forecast and Y-o-Y Growth (%) Projection, 2018–2027
Figure 49: Latin America Customized Procedure Trays Market Value Share Analysis, by Country/ Sub-region, 2018 and 2027
Figure 50: Latin America Customized Procedure Trays Market Attractiveness Analysis, by Country/ Sub-region, 2019–2027
Figure 51: Latin America Customized Procedure Trays Market Value Share Analysis, by Application, 2018 and 2027
Figure 52: Latin America Customized Procedure Trays Market Attractiveness Analysis, by Application, 2019–2027
Figure 53: Latin America Customized Procedure Trays Market Value Share Analysis, by End-user, 2018 and 2027
Figure 54: Latin America Customized Procedure Trays Market Attractiveness Analysis, by End-user, 2019–2027
Figure 55: Middle East & Africa Customized Procedure Trays Market Value (US$ Mn) Forecast and Y-o-Y Growth (%) Projection, 2018–2027
Figure 56: Middle East & Africa Customized Procedure Trays Market Value Share Analysis, by Country/Sub-region, 2018 and 2027
Figure 57: Middle East & Africa Customized Procedure Trays Market Attractiveness Analysis, by Country/Sub-region, 2019–2027
Figure 58: Middle East & Africa Customized Procedure Trays Market Value Share Analysis, by Application, 2018 and 2027
Figure 59: Europe Customized Procedure Trays Market Attractiveness Analysis, by Application, 2019–2027
Figure 60: Middle East & Africa Customized Procedure Trays Market Value Share Analysis, by End-user, 2018 and 2027
Figure 61: Middle East & Africa Customized Procedure Trays Market Attractiveness Analysis, by End-user, 2019–2027
Figure 62: Market Share of Prominent Key Players: Customized Procedure Trays Market, 2018
Figure 63: 3M Company Revenue (US$ Mn) and Y-o-Y Growth (%), 2015–2018
Figure 64: 3M Company Breakdown of Net Sales (%), by Region, 2018
Figure 65: 3M Company, Research & development Expense (US$ Mn), 2015-2018
Figure 66: 3M Company Breakdown of Net Sales (%), by Business Segment, 2018
Figure 67: B. Braun Melsungen AG: Research & Development Expenditure, 2014–2018
Figure 68: B. Braun Melsungen AG: Revenue (US$ Bn) and Y-o-Y Growth (%), 2013–2018
Figure 69: B. Braun Melsungen AG: Breakdown of Net Sales (%), by Region, 2018
Figure 70: Cardinal Health, Inc., Revenue (US$ Bn) and Y-o-Y Growth (%), 2016–2019
Figure 71: Cardinal Health, Inc., Breakdown of Net Revenue (%), by Business Segment, 2019
Figure 72: Cardinal Health, Inc., Breakdown of Net Sales (%), by Region, 2019
Figure 73: Revenue (US$ Bn) and Y-o-Y Growth (%), 2013–2019
Figure 74: Research & Development Expenditure, 2015–2019
Figure 75: Breakdown of Net Sales, by Business Segment, 2019
Figure 76: Breakdown of Net Sales, by Region, 2019
Figure 77: Merit Medical Systems : Research & Development Expenditure (US$ Mn), 2014–2018
Figure 78: Merit Medical Systems : Revenue (US$ ‘000) and Y-o-Y Growth (%), 2013–2018
Figure 79: Merit Medical Systems : Breakdown of Net Sales (US$), by Product Group, 2018
Figure 80: Merit Medical Systems : Breakdown of Net Sales (%), by Region, 2018
Figure 81: Owens & Minor Inc., Distribution, Selling & Administrative Expenses (US$ Mn), 2018
Figure 82: Owens & Minor Inc., Revenue (US$ Mn) and Y-o-Y Growth (%), 2016–2018
Figure 83: Owens & Minor Inc., Breakdown of Sales, by Business Units, 2018
Figure 84: Paul Hartmann AG, Breakdown of Net Sales (%), by Region, 2018
Figure 85: Paul Hartmann AG, Breakdown of Net Sales (%), by Business Segment, 2018
Figure 86: Paul Hartmann AG, Revenue (US$ Mn) and Y-o-Y Growth (%), 2015–2018
Figure 87: Revenue (US$ Mn) and Y-o-Y Growth (%), 2015–2018
Figure 88: Research & Development Expenses (US$ Mn), 2015–2018
Figure 90: Breakdown of Sales (%), by Reporting Segment, 2018
Copyright © Transparency Market Research, Inc. All Rights reserved
Trust Online

Customized Procedure Trays Market