

Reports
Reports
The global cultivated meat market size was valued at USD 270.0 Million in 2025 and is projected to reach USD 1787.0 Million by 2036, expanding at a CAGR of 19.0% from 2026 to 2036. Market growth is driven by increasing demand for sustainable protein sources, rising consumer acceptance of alternative proteins, growing investments in cellular agriculture, expanding regulatory approvals for cultivated meat products, increasing partnerships between food manufacturers and biotechnology companies, and continuous innovations in cell line development, serum-free growth media, bioprocess optimization, scalable bioreactors, scaffold technologies, automation, AI-driven cell cultivation, and cost-efficient manufacturing worldwide.
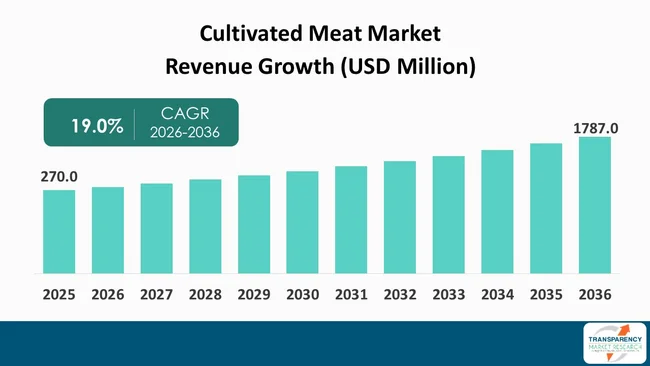
The global cultivated meat market is evolving from laboratory innovation into organized commercial expansion within the broader food system. Investment decisions are increasingly weighted toward scalable cell culture, efficient bioprocessing, and ingredient optimization. Regulatory clearance, manufacturing capabilities, and consumer confidence are critical factors determining full-spectrum commercialization. Companies are refining production platforms and building alliances with biotechnology, food processing, and ingredient supply sectors. Industry players seem to be shifting focus to more affordable products with stable quality, along with a clean-label and clear communication to promote consumption.
Sustainability targets continue to inform product innovation and investment decisions throughout the value chain of cultivated meat market. Producers are putting more focus on resource efficiency while nutritional quality and sensory attributes are preserved. Public research institutes and private developers work together to enhance cell lines, growth media, and production efficiency. As commercialization scales up beyond pilot manufacturing plants, supply chain integration is on the rise. Joint innovation promotes technical readiness and indicates future industrial-scale manufacturing capacity.
Environmental concerns are continuing to underpin strategic interest in cultivated meat in both developed and emerging food markets. Future success will require advances in manufacturing efficiency, regulatory harmony, ingredient innovation, and consumer education. The competition is expected to intensify between the players developing solid production platforms, strategic partnerships, and economical manufacturing to cement their position in a maturing market.
Cultivated meat market, a part of the alternative protein industry, is an early-innings play on an industry that may realize significant growth by producing real meat through cell-based manufacturing. The process uses animal cells grown in a controlled environment, rather than conventional livestock farming, all while maintaining the biological and nutritional components of animal meat. Advances in cell biology, tissue engineering, and bioprocess technologies enable increased productivity and product consistency in manufacturing. These progressions facilitate horizontal commercialization in terms of multiple food categories and distribution channels. Increased collaboration between biotech companies and food producers is enhancing product development and production capability.
This includes cultured poultry, beef, pork, seafood, and other niche meat types that are tailored for specific commercial uses. Food producers, restaurants, hospitality entities, and processed food manufacturers continue to explore cultivated meat market as part of a wider portfolio of protein options. Distribution policies are now being diversified by the addition of online and offline retail sales, coupled with B2B sales. Regulatory clearance, production scale-up, and consumer education continue to be key elements for broader market development. Industry players are investing in the continuous improvement of production, innovation of ingredients, and quality assurance programs.
Increasing availability for cell line development, cell culture efficiency, media development, scaffold materials, and expertise in automated manufacturing processes. Commercial approaches are increasingly targeting production cost efficiency and product quality and texture performance. Strategic partnerships in biotechnology, food processing, and ingredient suppliers also contribute to the ecosystem development. Continuous innovations support gradual market development to meet the challenge of sustainability, food security, and future protein diversification.
| Attribute | Detail |
|---|---|
| Market Drivers |
|
Expanding sustainability criteria are driving investments in the cultivated meat segment of the global food system. Public sector bodies, research institutions and food producers are increasingly backing methods of production that are less taxing on the environment and more resilient over the long term. Cultivated meat adds to traditional animal agriculture via controlled production methods within the sphere of cellular agriculture. Increasing efficiency of production and better management of resources, including renewable energy, are making commercialization more viable. These advancements also motivate the cultivated meat market value chain as a meaningful strategic investment.
Environmental performance is increasingly an important factor when food manufacturers, retailers and caterers make their buying decisions. Entities are actively assessing production methodologies to support climate commitments and corporate sustainability roadmaps. Developers of cultivated meat are working on technologies to enhance cell growth, the use of media, and the efficiency of production to lessen environmental impact. Collaborative research initiatives facilitate technological advances for future commercial expansion. A more positive environmental profile is also reassuring for stakeholders in the public and private domain.
Cultivated meat produced using renewable energy could have a carbon footprint up to 40 times lower than that of conventional meat. This potential environmental benefit is increasing interest in complementary protein technologies. Sustainable production methods are increasingly in the focus of policy in several developed food markets. Regulatory involvement remains crucial to bolstering responsible commercialization and technology validation. Environmental concerns are at the heart of the long-term growth of the industry.
Automation, digital monitoring, and advanced bioprocess optimization are being utilized to further enhance production consistency by manufacturers. Alliances between biotech companies and food producers are enabling faster commercial rollout of cultivated meat in a variety of categories. Manufacturing efficiency is relied upon to bring about cost reductions along with reliable production. Widening research towards serum-free medium and scalable bioreactor technology enhances industrial preparedness. Continuous innovation is positioning cultivated meat as a complementary protein solution that can support future sustainability targets.
Advances in technology continue to push cultivated meat production from experimental studies to scalable commercial production. Firms are increasingly investing in more sophisticated cell line development, serum-free growth media, automated bioprocessing, and advanced bioreactor technologies. These innovations bring production consistency and scalability to support larger manufacturing volumes. Digital controls and processing optimization also enhance operational efficiency in the production line. Continuous advancements in technology improve product quality with commercial viability.
Scientific institutions and biotech firms continue to partner in increasing the efficiency of cell cultivation and reducing the complexity of production. Enhanced scaffold materials can also result in more robust tissue generation and improved texture in multiple cultivated meat segments. Automation is a means of reducing variability in production and is consistent with the needs of standardized manufacturing processes. Artificial intelligence is progressively being used to aid process optimization in predictive monitoring and production control. These advancements enable a more mature industrial infrastructure for the entire cultivated meat ecosystem.
The World Intellectual Property Organization (WIPO) said innovation-seekers across the world submitted a record number of 3.7 million patent applications in 2024, up 4.9% from 2023. Significant global intellectual property activity underlines continued innovation in biotechnology, food technology, and advanced manufacturing in support of cultivated meat development. Companies are also protecting proprietary technologies related to cell cultivation, bioprocess engineering, and production platforms. Vibrant innovation ecosystems facilitate strategic investment and cross-industry collaboration. Development of IP increases the potential for long-term commercialization.
Among the latest trends observed in manufacturing technology is the evolution toward cost-effective, scalable, and repeatable production methodologies. Manufacturers of equipment are creating more specialized bioreactors and automation systems for cultivated protein production. Suppliers of ingredients are also making progress with animal-free growth media and functional inputs that enhance production efficiency. Strategic partnerships facilitate the commercialization of technology and strengthen global supply chains. Continuous innovation is key to further improving cost-effectiveness, production output, and wider commercial implementation.
The protein diversification space is expanding, creating compelling opportunities for cultivated meat producers globally. Food companies are diversifying protein offerings and reflecting the changing consumer demands and sustainability and future food security focus areas. Cultivated meat can be used to complement the existing animal protein supply as well as enable innovation across retail and foodservice channels. Ongoing investment in biotechnology expands manufacturing strength and commercial preparedness. Collaborative partnerships are facilitating technology transfer and production scale-up.
Several countries have made regulatory advances which enable structured pathways to market commercialization under clearly defined approval processes and transparent safety evaluations. Producers are also developing scalable production systems that can supply restaurants, food companies, and high-end retail channels. Progress in cell culture media, scaffold technologies, and automated bioprocessing contributes to increasing efficiency. These developments strengthen confidence among investors, food companies, and regulators. Wider ecosystem development facilitates longer-term industry growth.
According to the OECD-FAO Agricultural Outlook 2024-2033, global per capita protein consumption will grow to 79.8 grams per day by 2033. Increasing demand for protein drives investment in production technologies for complementary foods, contributing to diversified food systems. Cultivated meat technology developers are also expanding production capacity and enhancing product quality and production efficiency. Enhanced partnerships in the fields of biotechnology, food processing and ingredients suppliers further fortify commercialization prospects.
Commercial potential continues to grow from premium foodservice, specialty retail products and strategic partnerships with well-established food manufacturers. Future market development will be influenced by the ability to scale production to meet demand, educating consumers, regulatory alignment, and continuous technological innovation.
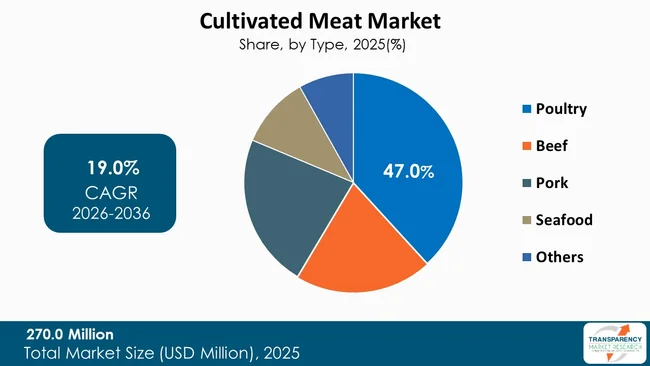
Poultry is the most popular type of meat produced in the global cultivated meat market, with 47.0% of the total market demand. This segment is attributed to high consumer awareness and acceptance in global food culture. Manufacturers have favored lab-grown poultry over other types of meat due to relatively simple tissue structure and well-established eating habits. Product development efforts continue to be directed at taste and texture improvement and nutritional homogeneity. These features enhance commercialization potential for a variety of food uses.
Food producers are increasingly adding cultured poultry to their innovation strategies to diversify protein offerings. Restaurants and food service operators are also assessing cultured poultry products for their premium menus and initiatives to focus on sustainability. Production technologies continue to evolve through enhanced cell cultivation, tailored media and manufacturing platforms, which are becoming more and more scalable. Strategic partnerships enhance the prospects for commercialization and production within the value chain. The ongoing technological refinement will improve the efficiency of manufacturing and the quality of products.
The distribution channels are being diversified through the expansion of retail partnerships, foodservice collaborations, and direct commercial agreements. Consumer education campaigns bring consumers awareness of production methods, product safety, and nutritional value. Multi-market regulatory approval also better positions them to more widely commercialize cultivated poultry goods. Firms are increasingly investing in manufacturing scale and supply chain integration to enhance their commercial competitiveness. Through continued innovation, production scaling, an expanding commercial network and stronger uptake in shifting global protein markets, poultry is expected to retain the top spot.
| Attribute | Detail |
|---|---|
| Leading Region |
|
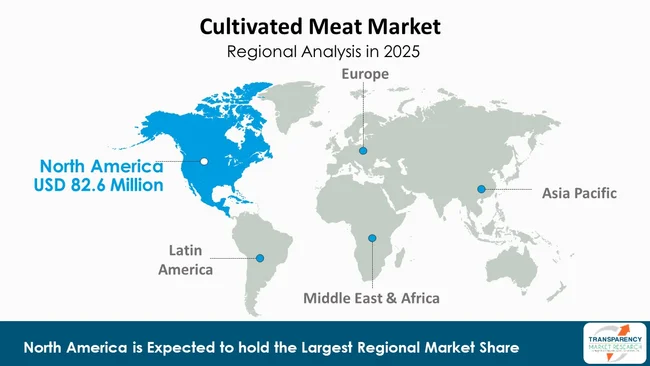
North America is the dominant regional market for cultivated meat and holds 30.6% of the global market share. The region is characterized by a well-established biotechnology environment, highly developed research facilities, and active private investment. The companies are working to build out capabilities for research, pilot production, and commercial-scale production across the value chain for cultivated meat. Product innovation is being accelerated through collaborative relationships among biotechnology companies, food companies, and universities and colleges. Together, these strengths ensure North America remains at the forefront of commercialization.
A supportive regulatory posture and established food innovation systems are spurring commercialization efforts across the region. These corporations invest significantly in high-tech cell culture applications, automated manufacturing solutions, and product platforms of the future. Technological innovations are advanced by research bodies through joint scientific programs and industry collaboration. Continuous innovation enhances production efficiency and the ability to scale commercial production in the future. Investments in supporting infrastructure also contribute to enhancing the competitiveness of the region.
Producers of meat and operators of restaurants are evaluating cultured meat more as an option within broader protein diversification approaches. Commercialization activities are expanding across foodservice, retail, and business-to-business channels. Educating and demonstrating the products has helped improve consumer awareness of sustainable food technologies. The companies continue to focus on production efficiency, regulatory requirements, and strategic cooperation for long-term development. The strong presence of the North American region can be attributed to the continuous technological developments, commercial progress in this field, active investments, and a well-developed biotechnology environment in this region.
Aleph Farms Ltd., BioBQ ApS, BlueNalu, Inc., CellX Technologies Co., Ltd., Clear Meat, Eat Just, Inc., Ever After Foods Ltd., Ivy Farm Technologies Ltd., Mission Barns, Inc., Mosa Meat B.V., Shiok Meats Pte. Ltd., SuperMeat Ltd., UPSIDE Foods, Inc., Vow Group Pty Ltd., Wildtype, Inc. are some of the leading manufacturers operating in the global cultivated meat market.
Each of these companies has been profiled in the global cultivated meat market report based on parameters such as company overview, business strategies, financial overview, business segments, product portfolio, and recent developments.
| Attribute | Detail |
|---|---|
| Market Size Value in 2025 (Base Year) | USD 270.0 Million |
| Market Forecast Value in 2036 | USD 1787.0 Million |
| Growth Rate (CAGR 2026 to 2036) | 19.0% |
| Forecast Period | 2026-2036 |
| Historical Data Available for | 2021-2025 |
| Quantitative Units | USD Million for Value and Tons for Volume |
| Market Analysis | Global qualitative analysis includes drivers, restraints, opportunities, key trends, key market indicators, Porter’s Five Forces analysis, value chain analysis, SWOT analysis, etc. Furthermore, at the regional level, qualitative analysis includes key trends, price trends, and key supplier analysis. |
| Competition Landscape |
|
| Format | Electronic (PDF) + Excel |
| Market Segmentation | Type
|
| Regions Covered |
|
| Countries Covered |
|
| Companies Profiled |
|
| Customization Scope | Available upon request |
| Pricing | Available upon request |
The global cultivated meat market was valued at USD 270.0 Million in 2025
The global cultivated meat industry is projected to reach USD 1787.0 Million by 2036
Rising sustainability priorities across global food systems and technological advancements accelerating commercial readiness are some of the driving factors for this market
The CAGR is anticipated to be 19.0% from 2026 to 2036
Aleph Farms Ltd., BioBQ ApS, BlueNalu, Inc., CellX Technologies Co., Ltd., Clear Meat, Eat Just, Inc., Ever After Foods Ltd., Ivy Farm Technologies Ltd., Mission Barns, Inc., Mosa Meat B.V., Shiok Meats Pte. Ltd., SuperMeat Ltd., UPSIDE Foods, Inc., Vow Group Pty Ltd., Wildtype, Inc., and others.
Table 01: Global Cultivated Meat Market Value (USD Million) Projection, By Type 2021 to 2036
Table 02: Global Cultivated Meat Market Volume (Tons) Projection, By Type 2021 to 2036
Table 03: Global Cultivated Meat Market Value (USD Million) Projection, By End-use 2021 to 2036
Table 04: Global Cultivated Meat Market Volume (Tons) Projection, By End-use 2021 to 2036
Table 05: Global Cultivated Meat Market Value (USD Million) Projection, By Distribution Channel 2021 to 2036
Table 06: Global Cultivated Meat Market Volume (Tons) Projection, By Distribution Channel 2021 to 2036
Table 07: Global Cultivated Meat Market Value (USD Million) Projection, By Region 2021 to 2036
Table 08: Global Cultivated Meat Market Volume (Tons) Projection, By Region 2021 to 2036
Table 09: North America Cultivated Meat Market Value (USD Million) Projection, By Type 2021 to 2036
Table 10: North America Cultivated Meat Market Volume (Tons) Projection, By Type 2021 to 2036
Table 11: North America Cultivated Meat Market Value (USD Million) Projection, By End-use 2021 to 2036
Table 12: North America Cultivated Meat Market Volume (Tons) Projection, By End-use 2021 to 2036
Table 13: North America Cultivated Meat Market Value (USD Million) Projection, By Distribution Channel 2021 to 2036
Table 14: North America Cultivated Meat Market Volume (Tons) Projection, By Distribution Channel 2021 to 2036
Table 15: North America Cultivated Meat Market Value (USD Million) Projection, By Country 2021 to 2036
Table 16: North America Cultivated Meat Market Volume (Tons) Projection, By Country 2021 to 2036
Table 17: U.S. Cultivated Meat Market Value (USD Million) Projection, By Type 2021 to 2036
Table 18: U.S. Cultivated Meat Market Volume (Tons) Projection, By Type 2021 to 2036
Table 19: U.S. Cultivated Meat Market Value (USD Million) Projection, By End-use 2021 to 2036
Table 20: U.S. Cultivated Meat Market Volume (Tons) Projection, By End-use 2021 to 2036
Table 21: U.S. Cultivated Meat Market Value (USD Million) Projection, By Distribution Channel 2021 to 2036
Table 22: U.S. Cultivated Meat Market Volume (Tons) Projection, By Distribution Channel 2021 to 2036
Table 23: Canada Cultivated Meat Market Value (USD Million) Projection, By Type 2021 to 2036
Table 24: Canada Cultivated Meat Market Volume (Tons) Projection, By Type 2021 to 2036
Table 25: Canada Cultivated Meat Market Value (USD Million) Projection, By End-use 2021 to 2036
Table 26: Canada Cultivated Meat Market Volume (Tons) Projection, By End-use 2021 to 2036
Table 27: Canada Cultivated Meat Market Value (USD Million) Projection, By Distribution Channel 2021 to 2036
Table 28: Canada Cultivated Meat Market Volume (Tons) Projection, By Distribution Channel 2021 to 2036
Table 29: Europe Cultivated Meat Market Value (USD Million) Projection, By Type 2021 to 2036
Table 30: Europe Cultivated Meat Market Volume (Tons) Projection, By Type 2021 to 2036
Table 31: Europe Cultivated Meat Market Value (USD Million) Projection, By End-use 2021 to 2036
Table 32: Europe Cultivated Meat Market Volume (Tons) Projection, By End-use 2021 to 2036
Table 33: Europe Cultivated Meat Market Value (USD Million) Projection, By Distribution Channel 2021 to 2036
Table 34: Europe Cultivated Meat Market Volume (Tons) Projection, By Distribution Channel 2021 to 2036
Table 35: Europe Cultivated Meat Market Value (USD Million) Projection, By Country 2021 to 2036
Table 36: Europe Cultivated Meat Market Volume (Tons) Projection, By Country 2021 to 2036
Table 37: U.K. Cultivated Meat Market Value (USD Million) Projection, By Type 2021 to 2036
Table 38: U.K. Cultivated Meat Market Volume (Tons) Projection, By Type 2021 to 2036
Table 39: U.K. Cultivated Meat Market Value (USD Million) Projection, By End-use 2021 to 2036
Table 40: U.K. Cultivated Meat Market Volume (Tons) Projection, By End-use 2021 to 2036
Table 41: U.K. Cultivated Meat Market Value (USD Million) Projection, By Distribution Channel 2021 to 2036
Table 42: U.K. Cultivated Meat Market Volume (Tons) Projection, By Distribution Channel 2021 to 2036
Table 43: Germany Cultivated Meat Market Value (USD Million) Projection, By Type 2021 to 2036
Table 44: Germany Cultivated Meat Market Volume (Tons) Projection, By Type 2021 to 2036
Table 45: Germany Cultivated Meat Market Value (USD Million) Projection, By End-use 2021 to 2036
Table 46: Germany Cultivated Meat Market Volume (Tons) Projection, By End-use 2021 to 2036
Table 47: Germany Cultivated Meat Market Value (USD Million) Projection, By Distribution Channel 2021 to 2036
Table 48: Germany Cultivated Meat Market Volume (Tons) Projection, By Distribution Channel 2021 to 2036
Table 49: France Cultivated Meat Market Value (USD Million) Projection, By Type 2021 to 2036
Table 50: France Cultivated Meat Market Volume (Tons) Projection, By Type 2021 to 2036
Table 51: France Cultivated Meat Market Value (USD Million) Projection, By End-use 2021 to 2036
Table 52: France Cultivated Meat Market Volume (Tons) Projection, By End-use 2021 to 2036
Table 53: France Cultivated Meat Market Value (USD Million) Projection, By Distribution Channel 2021 to 2036
Table 54: France Cultivated Meat Market Volume (Tons) Projection, By Distribution Channel 2021 to 2036
Table 55: Italy Cultivated Meat Market Value (USD Million) Projection, By Type 2021 to 2036
Table 56: Italy Cultivated Meat Market Volume (Tons) Projection, By Type 2021 to 2036
Table 57: Italy Cultivated Meat Market Value (USD Million) Projection, By End-use 2021 to 2036
Table 58: Italy Cultivated Meat Market Volume (Tons) Projection, By End-use 2021 to 2036
Table 59: Italy Cultivated Meat Market Value (USD Million) Projection, By Distribution Channel 2021 to 2036
Table 60: Italy Cultivated Meat Market Volume (Tons) Projection, By Distribution Channel 2021 to 2036
Table 61: Spain Cultivated Meat Market Value (USD Million) Projection, By Type 2021 to 2036
Table 62: Spain Cultivated Meat Market Volume (Tons) Projection, By Type 2021 to 2036
Table 63: Spain Cultivated Meat Market Value (USD Million) Projection, By End-use 2021 to 2036
Table 64: Spain Cultivated Meat Market Volume (Tons) Projection, By End-use 2021 to 2036
Table 65: Spain Cultivated Meat Market Value (USD Million) Projection, By Distribution Channel 2021 to 2036
Table 66: Spain Cultivated Meat Market Volume (Tons) Projection, By Distribution Channel 2021 to 2036
Table 67: The Netherlands Cultivated Meat Market Value (USD Million) Projection, By Type 2021 to 2036
Table 68: The Netherlands Cultivated Meat Market Volume (Tons) Projection, By Type 2021 to 2036
Table 69: The Netherlands Cultivated Meat Market Value (USD Million) Projection, By End-use 2021 to 2036
Table 70: The Netherlands Cultivated Meat Market Volume (Tons) Projection, By End-use 2021 to 2036
Table 71: The Netherlands Cultivated Meat Market Value (USD Million) Projection, By Distribution Channel 2021 to 2036
Table 72: The Netherlands Cultivated Meat Market Volume (Tons) Projection, By Distribution Channel 2021 to 2036
Table 73: Asia Pacific Cultivated Meat Market Value (USD Million) Projection, By Type 2021 to 2036
Table 74: Asia Pacific Cultivated Meat Market Volume (Tons) Projection, By Type 2021 to 2036
Table 75: Asia Pacific Cultivated Meat Market Value (USD Million) Projection, By End-use 2021 to 2036
Table 76: Asia Pacific Cultivated Meat Market Volume (Tons) Projection, By End-use 2021 to 2036
Table 77: Asia Pacific Cultivated Meat Market Value (USD Million) Projection, By Distribution Channel 2021 to 2036
Table 78: Asia Pacific Cultivated Meat Market Volume (Tons) Projection, By Distribution Channel 2021 to 2036
Table 79: Asia Pacific Cultivated Meat Market Value (USD Million) Projection, By Country 2021 to 2036
Table 80: Asia Pacific Cultivated Meat Market Volume (Tons) Projection, By Country 2021 to 2036
Table 81: China Cultivated Meat Market Value (USD Million) Projection, By Type 2021 to 2036
Table 82: China Cultivated Meat Market Volume (Tons) Projection, By Type 2021 to 2036
Table 83: China Cultivated Meat Market Value (USD Million) Projection, By End-use 2021 to 2036
Table 84: China Cultivated Meat Market Volume (Tons) Projection, By End-use 2021 to 2036
Table 85: China Cultivated Meat Market Value (USD Million) Projection, By Distribution Channel 2021 to 2036
Table 86: China Cultivated Meat Market Volume (Tons) Projection, By Distribution Channel 2021 to 2036
Table 87: India Cultivated Meat Market Value (USD Million) Projection, By Type 2021 to 2036
Table 88: India Cultivated Meat Market Volume (Tons) Projection, By Type 2021 to 2036
Table 89: India Cultivated Meat Market Value (USD Million) Projection, By End-use 2021 to 2036
Table 90: India Cultivated Meat Market Volume (Tons) Projection, By End-use 2021 to 2036
Table 91: India Cultivated Meat Market Value (USD Million) Projection, By Distribution Channel 2021 to 2036
Table 92: India Cultivated Meat Market Volume (Tons) Projection, By Distribution Channel 2021 to 2036
Table 93: Japan Cultivated Meat Market Value (USD Million) Projection, By Type 2021 to 2036
Table 94: Japan Cultivated Meat Market Volume (Tons) Projection, By Type 2021 to 2036
Table 95: Japan Cultivated Meat Market Value (USD Million) Projection, By End-use 2021 to 2036
Table 96: Japan Cultivated Meat Market Volume (Tons) Projection, By End-use 2021 to 2036
Table 97: Japan Cultivated Meat Market Value (USD Million) Projection, By Distribution Channel 2021 to 2036
Table 98: Japan Cultivated Meat Market Volume (Tons) Projection, By Distribution Channel 2021 to 2036
Table 99: Australia Cultivated Meat Market Value (USD Million) Projection, By Type 2021 to 2036
Table 100: Australia Cultivated Meat Market Volume (Tons) Projection, By Type 2021 to 2036
Table 101: Australia Cultivated Meat Market Value (USD Million) Projection, By End-use 2021 to 2036
Table 102: Australia Cultivated Meat Market Volume (Tons) Projection, By End-use 2021 to 2036
Table 103: Australia Cultivated Meat Market Value (USD Million) Projection, By Distribution Channel 2021 to 2036
Table 104: Australia Cultivated Meat Market Volume (Tons) Projection, By Distribution Channel 2021 to 2036
Table 105: South Korea Cultivated Meat Market Value (USD Million) Projection, By Type 2021 to 2036
Table 106: South Korea Cultivated Meat Market Volume (Tons) Projection, By Type 2021 to 2036
Table 107: South Korea Cultivated Meat Market Value (USD Million) Projection, By End-use 2021 to 2036
Table 108: South Korea Cultivated Meat Market Volume (Tons) Projection, By End-use 2021 to 2036
Table 109: South Korea Cultivated Meat Market Value (USD Million) Projection, By Distribution Channel 2021 to 2036
Table 110: South Korea Cultivated Meat Market Volume (Tons) Projection, By Distribution Channel 2021 to 2036
Table 111: ASEAN Cultivated Meat Market Value (USD Million) Projection, By Type 2021 to 2036
Table 112: ASEAN Cultivated Meat Market Volume (Tons) Projection, By Type 2021 to 2036
Table 113: ASEAN Cultivated Meat Market Value (USD Million) Projection, By End-use 2021 to 2036
Table 114: ASEAN Cultivated Meat Market Volume (Tons) Projection, By End-use 2021 to 2036
Table 115: ASEAN Cultivated Meat Market Value (USD Million) Projection, By Distribution Channel 2021 to 2036
Table 116: ASEAN Cultivated Meat Market Volume (Tons) Projection, By Distribution Channel 2021 to 2036
Table 117: Middle East & Africa Cultivated Meat Market Value (USD Million) Projection, By Type 2021 to 2036
Table 118: Middle East & Africa Cultivated Meat Market Volume (Tons) Projection, By Type 2021 to 2036
Table 119: Middle East & Africa Cultivated Meat Market Value (USD Million) Projection, By End-use 2021 to 2036
Table 120: Middle East & Africa Cultivated Meat Market Volume (Tons) Projection, By End-use 2021 to 2036
Table 121: Middle East & Africa Cultivated Meat Market Value (USD Million) Projection, By Distribution Channel 2021 to 2036
Table 122: Middle East & Africa Cultivated Meat Market Volume (Tons) Projection, By Distribution Channel 2021 to 2036
Table 123: Middle East & Africa Cultivated Meat Market Value (USD Million) Projection, By Country 2021 to 2036
Table 124: Middle East & Africa Cultivated Meat Market Volume (Tons) Projection, By Country 2021 to 2036
Table 125: GCC Countries Cultivated Meat Market Value (USD Million) Projection, By Type 2021 to 2036
Table 126: GCC Countries Cultivated Meat Market Volume (Tons) Projection, By Type 2021 to 2036
Table 127: GCC Countries Cultivated Meat Market Value (USD Million) Projection, By End-use 2021 to 2036
Table 128: GCC Countries Cultivated Meat Market Volume (Tons) Projection, By End-use 2021 to 2036
Table 129: GCC Countries Cultivated Meat Market Value (USD Million) Projection, By Distribution Channel 2021 to 2036
Table 130: GCC Countries Cultivated Meat Market Volume (Tons) Projection, By Distribution Channel 2021 to 2036
Table 131: South Africa Cultivated Meat Market Value (USD Million) Projection, By Type 2021 to 2036
Table 132: South Africa Cultivated Meat Market Volume (Tons) Projection, By Type 2021 to 2036
Table 133: South Africa Cultivated Meat Market Value (USD Million) Projection, By End-use 2021 to 2036
Table 134: South Africa Cultivated Meat Market Volume (Tons) Projection, By End-use 2021 to 2036
Table 135: South Africa Cultivated Meat Market Value (USD Million) Projection, By Distribution Channel 2021 to 2036
Table 136: South Africa Cultivated Meat Market Volume (Tons) Projection, By Distribution Channel 2021 to 2036
Table 137: Latin America Cultivated Meat Market Value (USD Million) Projection, By Type 2021 to 2036
Table 138: Latin America Cultivated Meat Market Volume (Tons) Projection, By Type 2021 to 2036
Table 139: Latin America Cultivated Meat Market Value (USD Million) Projection, By End-use 2021 to 2036
Table 140: Latin America Cultivated Meat Market Volume (Tons) Projection, By End-use 2021 to 2036
Table 141: Latin America Cultivated Meat Market Value (USD Million) Projection, By Distribution Channel 2021 to 2036
Table 142: Latin America Cultivated Meat Market Volume (Tons) Projection, By Distribution Channel 2021 to 2036
Table 143: Latin America Cultivated Meat Market Value (USD Million) Projection, By Country 2021 to 2036
Table 144: Latin America Cultivated Meat Market Volume (Tons) Projection, By Country 2021 to 2036
Table 145: Brazil Cultivated Meat Market Value (USD Million) Projection, By Type 2021 to 2036
Table 146: Brazil Cultivated Meat Market Volume (Tons) Projection, By Type 2021 to 2036
Table 147: Brazil Cultivated Meat Market Value (USD Million) Projection, By End-use 2021 to 2036
Table 148: Brazil Cultivated Meat Market Volume (Tons) Projection, By End-use 2021 to 2036
Table 149: Brazil Cultivated Meat Market Value (USD Million) Projection, By Distribution Channel 2021 to 2036
Table 150: Brazil Cultivated Meat Market Volume (Tons) Projection, By Distribution Channel 2021 to 2036
Table 151: Mexico Cultivated Meat Market Value (USD Million) Projection, By Type 2021 to 2036
Table 152: Mexico Cultivated Meat Market Volume (Tons) Projection, By Type 2021 to 2036
Table 153: Mexico Cultivated Meat Market Value (USD Million) Projection, By End-use 2021 to 2036
Table 154: Mexico Cultivated Meat Market Volume (Tons) Projection, By End-use 2021 to 2036
Table 155: Mexico Cultivated Meat Market Value (USD Million) Projection, By Distribution Channel 2021 to 2036
Table 156: Mexico Cultivated Meat Market Volume (Tons) Projection, By Distribution Channel 2021 to 2036
Table 157: Argentina Cultivated Meat Market Value (USD Million) Projection, By Type 2021 to 2036
Table 158: Argentina Cultivated Meat Market Volume (Tons) Projection, By Type 2021 to 2036
Table 159: Argentina Cultivated Meat Market Value (USD Million) Projection, By End-use 2021 to 2036
Table 160: Argentina Cultivated Meat Market Volume (Tons) Projection, By End-use 2021 to 2036
Table 161: Argentina Cultivated Meat Market Value (USD Million) Projection, By Distribution Channel 2021 to 2036
Table 162: Argentina Cultivated Meat Market Volume (Tons) Projection, By Distribution Channel 2021 to 2036
Figure 01: Global Cultivated Meat Market Value (USD Million) Projection, By Type 2021 to 2036
Figure 02: Global Cultivated Meat Market Volume (Tons) Projection, By Type 2021 to 2036
Figure 03: Global Cultivated Meat Market Incremental Opportunities (USD Million) Forecast, By Type 2026 to 2036
Figure 04: Global Cultivated Meat Market Value (USD Million) Projection, By End-use 2021 to 2036
Figure 05: Global Cultivated Meat Market Volume (Tons) Projection, By End-use 2021 to 2036
Figure 06: Global Cultivated Meat Market Incremental Opportunities (USD Million) Forecast, By End-use 2026 to 2036
Figure 07: Global Cultivated Meat Market Value (USD Million) Projection, By Distribution Channel 2021 to 2036
Figure 08: Global Cultivated Meat Market Volume (Tons) Projection, By Distribution Channel 2021 to 2036
Figure 09: Global Cultivated Meat Market Incremental Opportunities (USD Million) Forecast, By Distribution Channel 2026 to 2036
Figure 10: Global Cultivated Meat Market Value (USD Million) Projection, By Region 2021 to 2036
Figure 11: Global Cultivated Meat Market Volume (Tons) Projection, By Region 2021 to 2036
Figure 12: Global Cultivated Meat Market Incremental Opportunities (USD Million) Forecast, By Region 2026 to 2036
Figure 13: North America Cultivated Meat Market Value (USD Million) Projection, By Type 2021 to 2036
Figure 14: North America Cultivated Meat Market Volume (Tons) Projection, By Type 2021 to 2036
Figure 15: North America Cultivated Meat Market Incremental Opportunities (USD Million) Forecast, By Type 2026 to 2036
Figure 16: North America Cultivated Meat Market Value (USD Million) Projection, By End-use 2021 to 2036
Figure 17: North America Cultivated Meat Market Volume (Tons) Projection, By End-use 2021 to 2036
Figure 18: North America Cultivated Meat Market Incremental Opportunities (USD Million) Forecast, By End-use 2026 to 2036
Figure 19: North America Cultivated Meat Market Value (USD Million) Projection, By Distribution Channel 2021 to 2036
Figure 20: North America Cultivated Meat Market Volume (Tons) Projection, By Distribution Channel 2021 to 2036
Figure 21: North America Cultivated Meat Market Incremental Opportunities (USD Million) Forecast, By Distribution Channel 2026 to 2036
Figure 22: North America Cultivated Meat Market Value (USD Million) Projection, By Country 2021 to 2036
Figure 23: North America Cultivated Meat Market Volume (Tons) Projection, By Country 2021 to 2036
Figure 24: North America Cultivated Meat Market Incremental Opportunities (USD Million) Forecast, By Country 2026 to 2036
Figure 25: U.S. Cultivated Meat Market Value (USD Million) Projection, By Type 2021 to 2036
Figure 26: U.S. Cultivated Meat Market Volume (Tons) Projection, By Type 2021 to 2036
Figure 27: U.S. Cultivated Meat Market Incremental Opportunities (USD Million) Forecast, By Type 2026 to 2036
Figure 28: U.S. Cultivated Meat Market Value (USD Million) Projection, By End-use 2021 to 2036
Figure 29: U.S. Cultivated Meat Market Volume (Tons) Projection, By End-use 2021 to 2036
Figure 30: U.S. Cultivated Meat Market Incremental Opportunities (USD Million) Forecast, By End-use 2026 to 2036
Figure 31: U.S. Cultivated Meat Market Value (USD Million) Projection, By Distribution Channel 2021 to 2036
Figure 32: U.S. Cultivated Meat Market Volume (Tons) Projection, By Distribution Channel 2021 to 2036
Figure 33: U.S. Cultivated Meat Market Incremental Opportunities (USD Million) Forecast, By Distribution Channel 2026 to 2036
Figure 34: Canada Cultivated Meat Market Value (USD Million) Projection, By Type 2021 to 2036
Figure 35: Canada Cultivated Meat Market Volume (Tons) Projection, By Type 2021 to 2036
Figure 36: Canada Cultivated Meat Market Incremental Opportunities (USD Million) Forecast, By Type 2026 to 2036
Figure 37: Canada Cultivated Meat Market Value (USD Million) Projection, By End-use 2021 to 2036
Figure 38: Canada Cultivated Meat Market Volume (Tons) Projection, By End-use 2021 to 2036
Figure 39: Canada Cultivated Meat Market Incremental Opportunities (USD Million) Forecast, By End-use 2026 to 2036
Figure 40: Canada Cultivated Meat Market Value (USD Million) Projection, By Distribution Channel 2021 to 2036
Figure 41: Canada Cultivated Meat Market Volume (Tons) Projection, By Distribution Channel 2021 to 2036
Figure 42: Canada Cultivated Meat Market Incremental Opportunities (USD Million) Forecast, By Distribution Channel 2026 to 2036
Figure 43: Europe Cultivated Meat Market Value (USD Million) Projection, By Type 2021 to 2036
Figure 44: Europe Cultivated Meat Market Volume (Tons) Projection, By Type 2021 to 2036
Figure 45: Europe Cultivated Meat Market Incremental Opportunities (USD Million) Forecast, By Type 2026 to 2036
Figure 46: Europe Cultivated Meat Market Value (USD Million) Projection, By End-use 2021 to 2036
Figure 47: Europe Cultivated Meat Market Volume (Tons) Projection, By End-use 2021 to 2036
Figure 48: Europe Cultivated Meat Market Incremental Opportunities (USD Million) Forecast, By End-use 2026 to 2036
Figure 49: Europe Cultivated Meat Market Value (USD Million) Projection, By Distribution Channel 2021 to 2036
Figure 50: Europe Cultivated Meat Market Volume (Tons) Projection, By Distribution Channel 2021 to 2036
Figure 51: Europe Cultivated Meat Market Incremental Opportunities (USD Million) Forecast, By Distribution Channel 2026 to 2036
Figure 52: Europe Cultivated Meat Market Value (USD Million) Projection, By Country 2021 to 2036
Figure 53: Europe Cultivated Meat Market Volume (Tons) Projection, By Country 2021 to 2036
Figure 54: Europe Cultivated Meat Market Incremental Opportunities (USD Million) Forecast, By Country 2026 to 2036
Figure 55: U.K. Cultivated Meat Market Value (USD Million) Projection, By Type 2021 to 2036
Figure 56: U.K. Cultivated Meat Market Volume (Tons) Projection, By Type 2021 to 2036
Figure 57: U.K. Cultivated Meat Market Incremental Opportunities (USD Million) Forecast, By Type 2026 to 2036
Figure 58: U.K. Cultivated Meat Market Value (USD Million) Projection, By End-use 2021 to 2036
Figure 59: U.K. Cultivated Meat Market Volume (Tons) Projection, By End-use 2021 to 2036
Figure 60: U.K. Cultivated Meat Market Incremental Opportunities (USD Million) Forecast, By End-use 2026 to 2036
Figure 61: U.K. Cultivated Meat Market Value (USD Million) Projection, By Distribution Channel 2021 to 2036
Figure 62: U.K. Cultivated Meat Market Volume (Tons) Projection, By Distribution Channel 2021 to 2036
Figure 63: U.K. Cultivated Meat Market Incremental Opportunities (USD Million) Forecast, By Distribution Channel 2026 to 2036
Figure 64: Germany Cultivated Meat Market Value (USD Million) Projection, By Type 2021 to 2036
Figure 65: Germany Cultivated Meat Market Volume (Tons) Projection, By Type 2021 to 2036
Figure 66: Germany Cultivated Meat Market Incremental Opportunities (USD Million) Forecast, By Type 2026 to 2036
Figure 67: Germany Cultivated Meat Market Value (USD Million) Projection, By End-use 2021 to 2036
Figure 68: Germany Cultivated Meat Market Volume (Tons) Projection, By End-use 2021 to 2036
Figure 69: Germany Cultivated Meat Market Incremental Opportunities (USD Million) Forecast, By End-use 2026 to 2036
Figure 70: Germany Cultivated Meat Market Value (USD Million) Projection, By Distribution Channel 2021 to 2036
Figure 71: Germany Cultivated Meat Market Volume (Tons) Projection, By Distribution Channel 2021 to 2036
Figure 72: Germany Cultivated Meat Market Incremental Opportunities (USD Million) Forecast, By Distribution Channel 2026 to 2036
Figure 73: France Cultivated Meat Market Value (USD Million) Projection, By Type 2021 to 2036
Figure 74: France Cultivated Meat Market Volume (Tons) Projection, By Type 2021 to 2036
Figure 75: France Cultivated Meat Market Incremental Opportunities (USD Million) Forecast, By Type 2026 to 2036
Figure 76: France Cultivated Meat Market Value (USD Million) Projection, By End-use 2021 to 2036
Figure 77: France Cultivated Meat Market Volume (Tons) Projection, By End-use 2021 to 2036
Figure 78: France Cultivated Meat Market Incremental Opportunities (USD Million) Forecast, By End-use 2026 to 2036
Figure 79: France Cultivated Meat Market Value (USD Million) Projection, By Distribution Channel 2021 to 2036
Figure 80: France Cultivated Meat Market Volume (Tons) Projection, By Distribution Channel 2021 to 2036
Figure 81: France Cultivated Meat Market Incremental Opportunities (USD Million) Forecast, By Distribution Channel 2026 to 2036
Figure 82: Italy Cultivated Meat Market Value (USD Million) Projection, By Type 2021 to 2036
Figure 83: Italy Cultivated Meat Market Volume (Tons) Projection, By Type 2021 to 2036
Figure 84: Italy Cultivated Meat Market Incremental Opportunities (USD Million) Forecast, By Type 2026 to 2036
Figure 85: Italy Cultivated Meat Market Value (USD Million) Projection, By End-use 2021 to 2036
Figure 86: Italy Cultivated Meat Market Volume (Tons) Projection, By End-use 2021 to 2036
Figure 87: Italy Cultivated Meat Market Incremental Opportunities (USD Million) Forecast, By End-use 2026 to 2036
Figure 88: Italy Cultivated Meat Market Value (USD Million) Projection, By Distribution Channel 2021 to 2036
Figure 89: Italy Cultivated Meat Market Volume (Tons) Projection, By Distribution Channel 2021 to 2036
Figure 90: Italy Cultivated Meat Market Incremental Opportunities (USD Million) Forecast, By Distribution Channel 2026 to 2036
Figure 91: Spain Cultivated Meat Market Value (USD Million) Projection, By Type 2021 to 2036
Figure 92: Spain Cultivated Meat Market Volume (Tons) Projection, By Type 2021 to 2036
Figure 93: Spain Cultivated Meat Market Incremental Opportunities (USD Million) Forecast, By Type 2026 to 2036
Figure 94: Spain Cultivated Meat Market Value (USD Million) Projection, By End-use 2021 to 2036
Figure 95: Spain Cultivated Meat Market Volume (Tons) Projection, By End-use 2021 to 2036
Figure 96: Spain Cultivated Meat Market Incremental Opportunities (USD Million) Forecast, By End-use 2026 to 2036
Figure 97: Spain Cultivated Meat Market Value (USD Million) Projection, By Distribution Channel 2021 to 2036
Figure 98: Spain Cultivated Meat Market Volume (Tons) Projection, By Distribution Channel 2021 to 2036
Figure 99: Spain Cultivated Meat Market Incremental Opportunities (USD Million) Forecast, By Distribution Channel 2026 to 2036
Figure 100: The Netherlands Cultivated Meat Market Value (USD Million) Projection, By Type 2021 to 2036
Figure 101: The Netherlands Cultivated Meat Market Volume (Tons) Projection, By Type 2021 to 2036
Figure 102: The Netherlands Cultivated Meat Market Incremental Opportunities (USD Million) Forecast, By Type 2026 to 2036
Figure 103: The Netherlands Cultivated Meat Market Value (USD Million) Projection, By End-use 2021 to 2036
Figure 104: The Netherlands Cultivated Meat Market Volume (Tons) Projection, By End-use 2021 to 2036
Figure 105: The Netherlands Cultivated Meat Market Incremental Opportunities (USD Million) Forecast, By End-use 2026 to 2036
Figure 106: The Netherlands Cultivated Meat Market Value (USD Million) Projection, By Distribution Channel 2021 to 2036
Figure 107: The Netherlands Cultivated Meat Market Volume (Tons) Projection, By Distribution Channel 2021 to 2036
Figure 108: The Netherlands Cultivated Meat Market Incremental Opportunities (USD Million) Forecast, By Distribution Channel 2026 to 2036
Figure 109: Asia Pacific Cultivated Meat Market Value (USD Million) Projection, By Type 2021 to 2036
Figure 110: Asia Pacific Cultivated Meat Market Volume (Tons) Projection, By Type 2021 to 2036
Figure 111: Asia Pacific Cultivated Meat Market Incremental Opportunities (USD Million) Forecast, By Type 2026 to 2036
Figure 112: Asia Pacific Cultivated Meat Market Value (USD Million) Projection, By End-use 2021 to 2036
Figure 113: Asia Pacific Cultivated Meat Market Volume (Tons) Projection, By End-use 2021 to 2036
Figure 114: Asia Pacific Cultivated Meat Market Incremental Opportunities (USD Million) Forecast, By End-use 2026 to 2036
Figure 115: Asia Pacific Cultivated Meat Market Value (USD Million) Projection, By Distribution Channel 2021 to 2036
Figure 116: Asia Pacific Cultivated Meat Market Volume (Tons) Projection, By Distribution Channel 2021 to 2036
Figure 117: Asia Pacific Cultivated Meat Market Incremental Opportunities (USD Million) Forecast, By Distribution Channel 2026 to 2036
Figure 118: Asia Pacific Cultivated Meat Market Value (USD Million) Projection, By Country 2021 to 2036
Figure 119: Asia Pacific Cultivated Meat Market Volume (Tons) Projection, By Country 2021 to 2036
Figure 120: Asia Pacific Cultivated Meat Market Incremental Opportunities (USD Million) Forecast, By Country 2026 to 2036
Figure 121: China Cultivated Meat Market Value (USD Million) Projection, By Type 2021 to 2036
Figure 122: China Cultivated Meat Market Volume (Tons) Projection, By Type 2021 to 2036
Figure 123: China Cultivated Meat Market Incremental Opportunities (USD Million) Forecast, By Type 2026 to 2036
Figure 124: China Cultivated Meat Market Value (USD Million) Projection, By End-use 2021 to 2036
Figure 125: China Cultivated Meat Market Volume (Tons) Projection, By End-use 2021 to 2036
Figure 126: China Cultivated Meat Market Incremental Opportunities (USD Million) Forecast, By End-use 2026 to 2036
Figure 127: China Cultivated Meat Market Value (USD Million) Projection, By Distribution Channel 2021 to 2036
Figure 128: China Cultivated Meat Market Volume (Tons) Projection, By Distribution Channel 2021 to 2036
Figure 129: China Cultivated Meat Market Incremental Opportunities (USD Million) Forecast, By Distribution Channel 2026 to 2036
Figure 130: India Cultivated Meat Market Value (USD Million) Projection, By Type 2021 to 2036
Figure 131: India Cultivated Meat Market Volume (Tons) Projection, By Type 2021 to 2036
Figure 132: India Cultivated Meat Market Incremental Opportunities (USD Million) Forecast, By Type 2026 to 2036
Figure 133: India Cultivated Meat Market Value (USD Million) Projection, By End-use 2021 to 2036
Figure 134: India Cultivated Meat Market Volume (Tons) Projection, By End-use 2021 to 2036
Figure 135: India Cultivated Meat Market Incremental Opportunities (USD Million) Forecast, By End-use 2026 to 2036
Figure 136: India Cultivated Meat Market Value (USD Million) Projection, By Distribution Channel 2021 to 2036
Figure 137: India Cultivated Meat Market Volume (Tons) Projection, By Distribution Channel 2021 to 2036
Figure 138: India Cultivated Meat Market Incremental Opportunities (USD Million) Forecast, By Distribution Channel 2026 to 2036
Figure 139: Japan Cultivated Meat Market Value (USD Million) Projection, By Type 2021 to 2036
Figure 140: Japan Cultivated Meat Market Volume (Tons) Projection, By Type 2021 to 2036
Figure 141: Japan Cultivated Meat Market Incremental Opportunities (USD Million) Forecast, By Type 2026 to 2036
Figure 142: Japan Cultivated Meat Market Value (USD Million) Projection, By End-use 2021 to 2036
Figure 143: Japan Cultivated Meat Market Volume (Tons) Projection, By End-use 2021 to 2036
Figure 144: Japan Cultivated Meat Market Incremental Opportunities (USD Million) Forecast, By End-use 2026 to 2036
Figure 145: Japan Cultivated Meat Market Value (USD Million) Projection, By Distribution Channel 2021 to 2036
Figure 146: Japan Cultivated Meat Market Volume (Tons) Projection, By Distribution Channel 2021 to 2036
Figure 147: Japan Cultivated Meat Market Incremental Opportunities (USD Million) Forecast, By Distribution Channel 2026 to 2036
Figure 148: Australia Cultivated Meat Market Value (USD Million) Projection, By Type 2021 to 2036
Figure 149: Australia Cultivated Meat Market Volume (Tons) Projection, By Type 2021 to 2036
Figure 150: Australia Cultivated Meat Market Incremental Opportunities (USD Million) Forecast, By Type 2026 to 2036
Figure 151: Australia Cultivated Meat Market Value (USD Million) Projection, By End-use 2021 to 2036
Figure 152: Australia Cultivated Meat Market Volume (Tons) Projection, By End-use 2021 to 2036
Figure 153: Australia Cultivated Meat Market Incremental Opportunities (USD Million) Forecast, By End-use 2026 to 2036
Figure 154: Australia Cultivated Meat Market Value (USD Million) Projection, By Distribution Channel 2021 to 2036
Figure 155: Australia Cultivated Meat Market Volume (Tons) Projection, By Distribution Channel 2021 to 2036
Figure 156: Australia Cultivated Meat Market Incremental Opportunities (USD Million) Forecast, By Distribution Channel 2026 to 2036
Figure 157: South Korea Cultivated Meat Market Value (USD Million) Projection, By Type 2021 to 2036
Figure 158: South Korea Cultivated Meat Market Volume (Tons) Projection, By Type 2021 to 2036
Figure 159: South Korea Cultivated Meat Market Incremental Opportunities (USD Million) Forecast, By Type 2026 to 2036
Figure 160: South Korea Cultivated Meat Market Value (USD Million) Projection, By End-use 2021 to 2036
Figure 161: South Korea Cultivated Meat Market Volume (Tons) Projection, By End-use 2021 to 2036
Figure 162: South Korea Cultivated Meat Market Incremental Opportunities (USD Million) Forecast, By End-use 2026 to 2036
Figure 163: South Korea Cultivated Meat Market Value (USD Million) Projection, By Distribution Channel 2021 to 2036
Figure 164: South Korea Cultivated Meat Market Volume (Tons) Projection, By Distribution Channel 2021 to 2036
Figure 165: South Korea Cultivated Meat Market Incremental Opportunities (USD Million) Forecast, By Distribution Channel 2026 to 2036
Figure 166: ASEAN Cultivated Meat Market Value (USD Million) Projection, By Type 2021 to 2036
Figure 167: ASEAN Cultivated Meat Market Volume (Tons) Projection, By Type 2021 to 2036
Figure 168: ASEAN Cultivated Meat Market Incremental Opportunities (USD Million) Forecast, By Type 2026 to 2036
Figure 169: ASEAN Cultivated Meat Market Value (USD Million) Projection, By End-use 2021 to 2036
Figure 170: ASEAN Cultivated Meat Market Volume (Tons) Projection, By End-use 2021 to 2036
Figure 171: ASEAN Cultivated Meat Market Incremental Opportunities (USD Million) Forecast, By End-use 2026 to 2036
Figure 172: ASEAN Cultivated Meat Market Value (USD Million) Projection, By Distribution Channel 2021 to 2036
Figure 173: ASEAN Cultivated Meat Market Volume (Tons) Projection, By Distribution Channel 2021 to 2036
Figure 174: ASEAN Cultivated Meat Market Incremental Opportunities (USD Million) Forecast, By Distribution Channel 2026 to 2036
Figure 175: Middle East & Africa Cultivated Meat Market Value (USD Million) Projection, By Type 2021 to 2036
Figure 176: Middle East & Africa Cultivated Meat Market Volume (Tons) Projection, By Type 2021 to 2036
Figure 177: Middle East & Africa Cultivated Meat Market Incremental Opportunities (USD Million) Forecast, By Type 2026 to 2036
Figure 178: Middle East & Africa Cultivated Meat Market Value (USD Million) Projection, By End-use 2021 to 2036
Figure 179: Middle East & Africa Cultivated Meat Market Volume (Tons) Projection, By End-use 2021 to 2036
Figure 180: Middle East & Africa Cultivated Meat Market Incremental Opportunities (USD Million) Forecast, By End-use 2026 to 2036
Figure 181: Middle East & Africa Cultivated Meat Market Value (USD Million) Projection, By Distribution Channel 2021 to 2036
Figure 182: Middle East & Africa Cultivated Meat Market Volume (Tons) Projection, By Distribution Channel 2021 to 2036
Figure 183: Middle East & Africa Cultivated Meat Market Incremental Opportunities (USD Million) Forecast, By Distribution Channel 2026 to 2036
Figure 184: Middle East & Africa Cultivated Meat Market Value (USD Million) Projection, By Country 2021 to 2036
Figure 185: Middle East & Africa Cultivated Meat Market Volume (Tons) Projection, By Country 2021 to 2036
Figure 186: Middle East & Africa Cultivated Meat Market Incremental Opportunities (USD Million) Forecast, By Country 2026 to 2036
Figure 187: GCC Countries Cultivated Meat Market Value (USD Million) Projection, By Type 2021 to 2036
Figure 188: GCC Countries Cultivated Meat Market Volume (Tons) Projection, By Type 2021 to 2036
Figure 189: GCC Countries Cultivated Meat Market Incremental Opportunities (USD Million) Forecast, By Type 2026 to 2036
Figure 190: GCC Countries Cultivated Meat Market Value (USD Million) Projection, By End-use 2021 to 2036
Figure 191: GCC Countries Cultivated Meat Market Volume (Tons) Projection, By End-use 2021 to 2036
Figure 192: GCC Countries Cultivated Meat Market Incremental Opportunities (USD Million) Forecast, By End-use 2026 to 2036
Figure 193: GCC Countries Cultivated Meat Market Value (USD Million) Projection, By Distribution Channel 2021 to 2036
Figure 194: GCC Countries Cultivated Meat Market Volume (Tons) Projection, By Distribution Channel 2021 to 2036
Figure 195: GCC Countries Cultivated Meat Market Incremental Opportunities (USD Million) Forecast, By Distribution Channel 2026 to 2036
Figure 196: South Africa Cultivated Meat Market Value (USD Million) Projection, By Type 2021 to 2036
Figure 197: South Africa Cultivated Meat Market Volume (Tons) Projection, By Type 2021 to 2036
Figure 198: South Africa Cultivated Meat Market Incremental Opportunities (USD Million) Forecast, By Type 2026 to 2036
Figure 199: South Africa Cultivated Meat Market Value (USD Million) Projection, By End-use 2021 to 2036
Figure 200: South Africa Cultivated Meat Market Volume (Tons) Projection, By End-use 2021 to 2036
Figure 201: South Africa Cultivated Meat Market Incremental Opportunities (USD Million) Forecast, By End-use 2026 to 2036
Figure 202: South Africa Cultivated Meat Market Value (USD Million) Projection, By Distribution Channel 2021 to 2036
Figure 203: South Africa Cultivated Meat Market Volume (Tons) Projection, By Distribution Channel 2021 to 2036
Figure 204: South Africa Cultivated Meat Market Incremental Opportunities (USD Million) Forecast, By Distribution Channel 2026 to 2036
Figure 205: Latin America Cultivated Meat Market Value (USD Million) Projection, By Type 2021 to 2036
Figure 206: Latin America Cultivated Meat Market Volume (Tons) Projection, By Type 2021 to 2036
Figure 207: Latin America Cultivated Meat Market Incremental Opportunities (USD Million) Forecast, By Type 2026 to 2036
Figure 208: Latin America Cultivated Meat Market Value (USD Million) Projection, By End-use 2021 to 2036
Figure 209: Latin America Cultivated Meat Market Volume (Tons) Projection, By End-use 2021 to 2036
Figure 210: Latin America Cultivated Meat Market Incremental Opportunities (USD Million) Forecast, By End-use 2026 to 2036
Figure 211: Latin America Cultivated Meat Market Value (USD Million) Projection, By Distribution Channel 2021 to 2036
Figure 212: Latin America Cultivated Meat Market Volume (Tons) Projection, By Distribution Channel 2021 to 2036
Figure 213: Latin America Cultivated Meat Market Incremental Opportunities (USD Million) Forecast, By Distribution Channel 2026 to 2036
Figure 214: Latin America Cultivated Meat Market Value (USD Million) Projection, By Country 2021 to 2036
Figure 215: Latin America Cultivated Meat Market Volume (Tons) Projection, By Country 2021 to 2036
Figure 216: Latin America Cultivated Meat Market Incremental Opportunities (USD Million) Forecast, By Country 2026 to 2036
Figure 217: Brazil Cultivated Meat Market Value (USD Million) Projection, By Type 2021 to 2036
Figure 218: Brazil Cultivated Meat Market Volume (Tons) Projection, By Type 2021 to 2036
Figure 219: Brazil Cultivated Meat Market Incremental Opportunities (USD Million) Forecast, By Type 2026 to 2036
Figure 220: Brazil Cultivated Meat Market Value (USD Million) Projection, By End-use 2021 to 2036
Figure 221: Brazil Cultivated Meat Market Volume (Tons) Projection, By End-use 2021 to 2036
Figure 222: Brazil Cultivated Meat Market Incremental Opportunities (USD Million) Forecast, By End-use 2026 to 2036
Figure 223: Brazil Cultivated Meat Market Value (USD Million) Projection, By Distribution Channel 2021 to 2036
Figure 224: Brazil Cultivated Meat Market Volume (Tons) Projection, By Distribution Channel 2021 to 2036
Figure 225: Brazil Cultivated Meat Market Incremental Opportunities (USD Million) Forecast, By Distribution Channel 2026 to 2036
Figure 226: Mexico Cultivated Meat Market Value (USD Million) Projection, By Type 2021 to 2036
Figure 227: Mexico Cultivated Meat Market Volume (Tons) Projection, By Type 2021 to 2036
Figure 228: Mexico Cultivated Meat Market Incremental Opportunities (USD Million) Forecast, By Type 2026 to 2036
Figure 229: Mexico Cultivated Meat Market Value (USD Million) Projection, By End-use 2021 to 2036
Figure 230: Mexico Cultivated Meat Market Volume (Tons) Projection, By End-use 2021 to 2036
Figure 231: Mexico Cultivated Meat Market Incremental Opportunities (USD Million) Forecast, By End-use 2026 to 2036
Figure 232: Mexico Cultivated Meat Market Value (USD Million) Projection, By Distribution Channel 2021 to 2036
Figure 233: Mexico Cultivated Meat Market Volume (Tons) Projection, By Distribution Channel 2021 to 2036
Figure 234: Mexico Cultivated Meat Market Incremental Opportunities (USD Million) Forecast, By Distribution Channel 2026 to 2036
Figure 235: Argentina Cultivated Meat Market Value (USD Million) Projection, By Type 2021 to 2036
Figure 236: Argentina Cultivated Meat Market Volume (Tons) Projection, By Type 2021 to 2036
Figure 237: Argentina Cultivated Meat Market Incremental Opportunities (USD Million) Forecast, By Type 2026 to 2036
Figure 238: Argentina Cultivated Meat Market Value (USD Million) Projection, By End-use 2021 to 2036
Figure 239: Argentina Cultivated Meat Market Volume (Tons) Projection, By End-use 2021 to 2036
Figure 240: Argentina Cultivated Meat Market Incremental Opportunities (USD Million) Forecast, By End-use 2026 to 2036
Figure 241: Argentina Cultivated Meat Market Value (USD Million) Projection, By Distribution Channel 2021 to 2036
Figure 242: Argentina Cultivated Meat Market Volume (Tons) Projection, By Distribution Channel 2021 to 2036
Figure 243: Argentina Cultivated Meat Market Incremental Opportunities (USD Million) Forecast, By Distribution Channel 2026 to 2036
Copyright © Transparency Market Research, Inc. All Rights reserved
Trust Online


Cultivated Meat Market
