
Reports
Reports
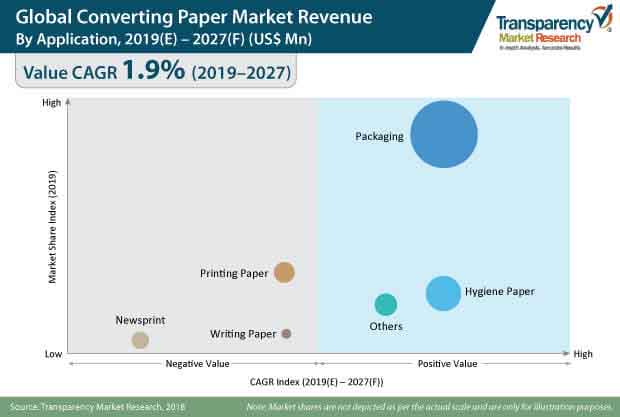
According to Transparency Market Research’s recent report titled “Converting Paper Market Global Industry Analysis, Size, Share, Growth, Trends, Historic Analysis 2014–2018 and Forecast 2019–2027,” the growth of the paper packaging industry is attributed to boost the demand for converting paper during the forecast period. The global market for converting paper was valued at US$ 375.9 Bn in 2018 and is projected to expand at a poor CAGR of 1.9%, during the forecast period (2019-2027).
The global converting paper market is segmented on the basis of application, end-use, pulp type, and paper type. In terms of application, the converting paper market is segmented into printing paper, newsprint, writing paper, hygiene paper, packaging, and others. In the packaging segment, converting paper is used for manufacturing carton board, corrugated board, and flexible paper.
More than half of the converting paper is used in the packaging applications owing to low cost and eco-friendly packaging formats. In the global converting paper market, newsprints, printing papers, and writing papers application segments are expected to reduce in market size during the forecast period. The carton board segment is projected to witness fast-paced growth throughout the forecast period.
The consumption of converting paper for tasks apart from writing and printing is increasing across the globe. For example, sanitary and packaging markets are becoming the emerging end users for the converting paper market. The adoption of converting paper for industrial packaging is increasing owing to low cost and sustainability as compared to plastic, metal, and glass. The use of converting paper material for manufacturing of intermediate bulk containers, liners, sacks, and absorbents has considerably increased in the past few years owing to the high-quality products offered by packaging leaders such as Sealed Air, Mondi, DS Smith, and others.
The evolving e-commerce industry is embracing converting paper for shipment packaging owing to the quality expectations of customers and the need for lightweight packaging formats. Penetration of E-Commerce in the retail market is growing at a substantial rate. With this growth, the demand for efficient packaging solutions is also increasing. Packaging is one of the key factors influencing consumer preference. Companies want to stay a step ahead of their competitors to ensure maximum market share, which is why, they are willing to invest in superior packaging solutions. Also, using sturdy corrugated boxes for transit ensures safe delivery of the product.
The growing adoption of digitalization is expected to reduce the demand for printing and writing paper. Digital media and paperless communication are replacing paper, and threatening the traditional market for newsprint and office paper. The market share of printing and writing paper is shifting to packaging paper owing to the growth of the e-commerce market and consumer preference for converting paper packaging formats. Digitalization is negatively affecting printing and writing paper markets, but it still has benefits for converting paper manufacturers and suppliers. With the help of digital tools, converting paper and packaging companies are improving their customer services and manufacturing activities to ensure improved product quality, tracking information of shipped goods, and convenient customer support.
The global converting paper market critically analysed key players during the course of the study. These include Stora Enso Oyj, Georgia-Pacific LLC, Canfor Corporation, International Paper Company, Clearwater Paper Corporation, UPM-Kymmene Oyj, P.H. Glatfelter Co., Domtar Corporation, Mitsubishi Paper Mills Limited, Verso Corporation, BillerudKorsnäs AB, Burgo Group SPA, Twin Rivers Paper Company Inc., American Eagle Paper Mills, Delta Paper Corp., Catalyst Paper Corporation, Asia Pacific Resources International Holdings Ltd., Rolland Enterprises Inc., Alberta Newsprint Company Ltd., and Finch Paper LLC.
Changing Industry Dynamics in Converting Paper Market Stimulates Adoption of Cutting-Edge Converter Machines
Converter paper, or the converting process for fiber, has attracted scant attention outside the parlance of the packaging sector, despite the ubiquity of the process in all paper products. A variety of commercial and industrial end users in the converter paper has benefitted from the use of converting process to meet their needs. Some of the common applications in the converting paper market are tissue packaging, nonwoven converting, bag converting, digital printing, writing paper, and hygiene paper. In particular, for the past several years, a rapidly expanding array of use of converting paper in industrial and commercial packaging solutions in the pre-Covid era has lent high lucrativeness to the market. A number of printing techniques have come to the fore that that compatible with the customized demand of end-use industries of the packaging sector. Proliferating demand for corrugated board and flexible paper has spurred consumer demands in the converting paper market. A large proportion of converted paper in the packaging sector is used to offer environmentally friendly solutions to end-use industries such as food services industries. The cost-effectiveness and wide option of economic branding options possible with converted paper in contrast with metal and plastic packaging has spurred the prospects in the converting paper market.
In recent years, the Industry 4.0 has spurred the popularity of automated converting machines, opening new avenues in the converting paper market. Further, there has been a demand for converting paper even in the Covid-19 era to meet the bulk of demand from the e-commerce industry. However, the pandemic-led lockdowns has led to slump in manufacturing especially in the Q2 of 2020. Raw material supply chain also suffered, along with the retail product sales. Thus, stakeholders in the converting paper market, especially in developing economies, lent toward adopting business models that could fit well within their budgets. In the coming months, with the recent emergence of Covid-19 vaccines in healthcare systems, policy makers have been able to paint an optimistic picture of economic growth. Such developments will also expand the horizon of the value chain in the converting paper market.
Converting paper market is anticipated to expand at a CAGR of 1.9% during the forecast period
Converting paper market is driven by rise in demand for consumer paper products, increase in demand for tissue paper and packaging paper
The carton board segment is projected to witness fast-paced growth throughout the forecast period
The United States is estimated to dominate the converting paper market due to the evolving packaging industry and intolerance for plastic products in packaging
Top key players in converting paper market are Canfor Corporation, International Paper Company, Stora Enso Oyj, Georgia-Pacific LLC, Clearwater Paper Corporation, BillerudKorsnäs AB, Burgo Group SPA, Twin Rivers Paper Company Inc.,
1. Executive Summary
1.1. Market Overview
1.2. Market Analysis
1.3. TMR Analysis and Recommendations
1.4. Opportunity Analysis
2. Market Introduction
2.1. Market Taxonomy
2.2. Market Definition
3. Market Background
3.1. Global Packaging Industry Outlook
3.2. Global Paper Packaging Industry Outlook
3.3. PESTLE Analysis, by Top 5 Countries
3.4. Porter’s Forces Analysis
3.5. Macro-economic Factors & Correlation Analysis
3.6. Forecast Factors: Relevance and Impact
3.7. Value Chain Analysis
3.7.1. Key Participants
3.7.1.1. Raw Material Suppliers
3.7.1.2. Packaging Manufacturers/Converters
3.7.1.3. Distributors
3.7.1.4. End Users
3.7.2. Profitability Margin
3.8. Market Dynamics
3.8.1. Drivers
3.8.1.1. Supply-side
3.8.1.2. Demand-side
3.8.2. Restraints
3.8.3. Key Trends
3.8.3.1. Product Level Trends
3.8.3.2. Business-level
3.8.4. Opportunities
4. Market Forecast
4.1. Market Volume Projections
4.2. Pricing Analysis
4.3. Market Size Projections
4.3.1. Y-o-Y Projections
4.3.2. Absolute $ Opportunity Analysis
5. Global Converting Paper Market Analysis, by Application
5.1. Introduction
5.1.1. Market Value Share Analysis, by Application
5.1.2. Y-o-Y Growth Analysis, by Application
5.2. Market Size (US$ Mn) and Volume (‘000 Tons) Historical Analysis 2014-2018, by Application
5.2.1. Printing Papers
5.2.2. Newsprint
5.2.3. Writing Paper
5.2.4. Hygiene Papers
5.2.5. Packaging
5.2.5.1. Carton Board
5.2.5.2. Corrugated Board
5.2.5.3. Flexible Papers
5.2.6. Others
5.3. Market Size (US$ Mn) and Volume (‘000 Tons) Forecast 2019-2027, by Application
5.3.1. Printing Papers
5.3.2. Newsprint
5.3.3. Writing Paper
5.3.4. Hygiene Papers
5.3.5. Packaging
5.3.5.1. Carton Board
5.3.5.2. Corrugated Board
5.3.5.3. Flexible Papers
5.3.6. Others
5.4. Market Attractiveness Analysis, by Application
6. Global Converting Paper Market Analysis, by Pulp Type
6.1. Introduction
6.1.1. Market Value Share Analysis, by Pulp Type
6.1.2. Y-o-Y Growth Analysis, by Pulp Type
6.2. Market Size (US$ Mn) and Volume (‘000 Tons) Historical Analysis 2014-2018, by Pulp Type
6.2.1. Chemical Wood Pulp
6.2.1.1. Sulphate Pulp
6.2.1.2. Sulphite Pulp
6.2.2. Mechanical Wood Pulp
6.2.3. Non-wood Pulp
6.2.4. Semi-chemical Pulp
6.2.5. Recycled Pulp
6.3. Market Size (US$ Mn) and Volume (‘000 Tons) Forecast 2019-2027, by Pulp Type
6.3.1. Chemical Wood Pulp
6.3.1.1. Sulphate Pulp
6.3.1.2. Sulphite Pulp
6.3.2. Mechanical Wood Pulp
6.3.3. Non-wood Pulp
6.3.4. Semi-chemical Pulp
6.3.5. Recycled Pulp
6.4. Market Attractiveness Analysis, by Pulp Type
7. Global Converting Paper Market Analysis, by Paper Type
7.1. Introduction
7.1.1. Market Value Share Analysis, by Sealing Type
7.1.2. Y-o-Y Growth Analysis, by Paper Type
7.2. Market Size (US$ Mn) and Volume (‘000 Tons) Historical Analysis 2014-2018, by Paper Type
7.2.1. Coated Paper
7.2.2. Uncoated Paper
7.3. Market Size (US$ Mn) and Volume (‘000 Tons) Forecast 2019-2027, by Paper Type
7.3.1. Coated Paper
7.3.2. Uncoated Paper
7.4. Market Attractiveness Analysis, by Paper Type
8. Global Converting Paper Market Analysis, by End Use
8.1. Introduction
8.1.1. Market Value Share Analysis, by End Use
8.1.2. Y-o-Y Growth Analysis, by End Use
8.2. Market Size (US$ Mn) and Volume (‘000 Tons) Historical Analysis 2014-2018, by End Use
8.2.1. Printing
8.2.2. Packing & Wrapping
8.2.3. Consumer Goods
8.2.4. Food Services and Others
8.3. Market Size (US$ Mn) and Volume (‘000 Tons) Forecast 2019-2027, by End Use
8.3.1. Printing
8.3.2. Packing & Wrapping
8.3.3. Consumer Goods
8.3.4. Food Service and Others
8.4. Market Attractiveness Analysis, by End Use
9. Global Converting Paper Market Analysis, by Region
9.1. Introduction
9.1.1. Market Value Share Analysis, by Region
9.1.2. Y-o-Y Growth Analysis, by Region
9.2. Market Size (US$ Mn) and Volume (‘000 Tons) Historical Analysis 2014-2018, by Region
9.2.1. North America
9.2.2. Latin America
9.2.3. Europe
9.2.4. Asia Pacific (APAC)
9.2.5. Middle East & Africa (MEA)
9.3. Market Size (US$ Mn) and Volume (‘000 Tons) Forecast 2019-2027, by Region
9.3.1. North America
9.3.2. Latin America
9.3.3. Europe
9.3.4. Asia Pacific (APAC)
9.3.5. Middle East & Africa (MEA)
9.4. Market Attractiveness Analysis, by Region
10. North America Converting Paper Market Analysis
10.1. Introduction
10.2. Market Size (US$ Mn) and Volume (‘000 Tons) Historical Analysis 2014-2018, by Country
10.2.1. U.S.
10.2.2. Canada
10.3. Market Size (US$ Mn) and Volume (‘000 Tons) Forecast 2019-2028, by Country
10.3.1. U.S.
10.3.2. Canada
10.4. Market Size (US$ Mn) and Volume (‘000 Tons) Historical Analysis 2014-2018, by Application
10.4.1. Printing Papers
10.4.2. Newsprint
10.4.3. Writing Paper
10.4.4. Hygiene Papers
10.4.5. Packaging
10.4.5.1. Carton Board
10.4.5.2. Corrugated Board
10.4.5.3. Flexible Papers
10.4.6. Others
10.5. Market Size (US$ Mn) and Volume (‘000 Tons) Forecast 2019-2027, by Application
10.5.1. Printing Papers
10.5.2. Newsprint
10.5.3. Writing Paper
10.5.4. Hygiene Papers
10.5.5. Packaging
10.5.5.1. Carton Board
10.5.5.2. Corrugated Board
10.5.5.3. Flexible Papers
10.5.6. Others
10.6. Market Size (US$ Mn) and Volume (‘000 Tons) Historical Analysis 2014-2018, by Pulp Type
10.6.1. Chemical Wood Pulp
10.6.1.1. Sulphate Pulp
10.6.1.2. Sulphite Pulp
10.6.2. Mechanical Wood Pulp
10.6.3. Non-wood Pulp
10.6.4. Semi-chemical Pulp
10.6.5. Recycled Pulp
10.7. Market Size (US$ Mn) and Volume (‘000 Tons) Forecast 2019-2027, by Pulp Type
10.7.1. Chemical Wood Pulp
10.7.1.1. Sulphate Pulp
10.7.1.2. Sulphite Pulp
10.7.2. Mechanical Wood Pulp
10.7.3. Non-wood Pulp
10.7.4. Semi-chemical Pulp
10.7.5. Recycled Pulp
10.8. Market Size (US$ Mn) and Volume (‘000 Tons) Historical Analysis 2014-2018, by Paper Type
10.8.1. Coated Paper
10.8.2. Uncoated Paper
10.9. Market Size (US$ Mn) and Volume (‘000 Tons) Forecast 2019-2027, by Paper Type
10.9.1. Coated Paper
10.9.2. Uncoated Paper
10.10. Market Size (US$ Mn) and Volume (‘000 Tons) Historical Analysis 2014-2018, by End Use
10.10.1. Printing
10.10.2. Packing & Wrapping
10.10.3. Consumer Goods
10.10.4. Food Services and Others
10.11. Market Size (US$ Mn) and Volume (‘000 Tons) Forecast 2019-2027, by End Use
10.11.1. Printing
10.11.2. Packing & Wrapping
10.11.3. Consumer Goods
10.11.4. Food Service and Others
11. Latin America Converting Paper Market Analysis
11.1. Introduction
11.2. Market Size (US$ Mn) and Volume (‘000 Tons) Historical Analysis 2014-2018, by Country
11.2.1. Brazil
11.2.2. Mexico
11.2.3. Argentina
11.2.4. Rest of Latin America
11.3. Market Size (US$ Mn) and Volume (‘000 Tons) Forecast 2019-2028, by Country
11.3.1. Brazil
11.3.2. Mexico
11.3.3. Argentina
11.3.4. Rest of Latin America
11.4. Market Size (US$ Mn) and Volume (‘000 Tons) Historical Analysis 2014-2018, by Application
11.4.1. Printing Papers
11.4.2. Newsprint
11.4.3. Writing Paper
11.4.4. Hygiene Papers
11.4.5. Packaging
11.4.5.1. Carton Board
11.4.5.2. Corrugated Board
11.4.5.3. Flexible Papers
11.4.6. Others
11.5. Market Size (US$ Mn) and Volume (‘000 Tons) Forecast 2019-2027, by Application
11.5.1. Printing Papers
11.5.2. Newsprint
11.5.3. Writing Paper
11.5.4. Hygiene Papers
11.5.5. Packaging
11.5.5.1. Carton Board
11.5.5.2. Corrugated Board
11.5.5.3. Flexible Papers
11.5.6. Others
11.6. Market Size (US$ Mn) and Volume (‘000 Tons) Historical Analysis 2014-2018, by Pulp Type
11.6.1. Chemical Wood Pulp
11.6.1.1. Sulphate Pulp
11.6.1.2. Sulphite Pulp
11.6.2. Mechanical Wood Pulp
11.6.3. Non-wood Pulp
11.6.4. Semi-chemical Pulp
11.6.5. Recycled Pulp
11.7. Market Size (US$ Mn) and Volume (‘000 Tons) Forecast 2019-2027, by Pulp Type
11.7.1. Chemical Wood Pulp
11.7.1.1. Sulphate Pulp
11.7.1.2. Sulphite Pulp
11.7.2. Mechanical Wood Pulp
11.7.3. Non-wood Pulp
11.7.4. Semi-chemical Pulp
11.7.5. Recycled Pulp
11.8. Market Size (US$ Mn) and Volume (‘000 Tons) Historical Analysis 2014-2018, by Paper Type
11.8.1. Coated Paper
11.8.2. Uncoated Paper
11.9. Market Size (US$ Mn) and Volume (‘000 Tons) Forecast 2019-2027, by Paper Type
11.9.1. Coated Paper
11.9.2. Uncoated Paper
11.10. Market Size (US$ Mn) and Volume (‘000 Tons) Historical Analysis 2014-2018, by End Use
11.10.1. Printing
11.10.2. Packing & Wrapping
11.10.3. Consumer Goods
11.10.4. Food Services and Others
11.11. Market Size (US$ Mn) and Volume (‘000 Tons) Forecast 2019-2027, by End Use
11.11.1. Printing
11.11.2. Packing & Wrapping
11.11.3. Consumer Goods
11.11.4. Food Service and Others
12. Europe Converting Paper Market Analysis
12.1. Introduction
12.2. Market Size (US$ Mn) and Volume (‘000 Tons) Historical Analysis 2014-2018, by Country
12.2.1. Germany
12.2.2. Italy
12.2.3. France
12.2.4. U.K.
12.2.5. Spain
12.2.6. Benelux
12.2.7. Nordic
12.2.8. Russia
12.2.9. Poland
12.2.10. Rest of Europe
12.3. Market Size (US$ Mn) and Volume (‘000 Tons) Forecast 2019-2028, by Country
12.3.1. Germany
12.3.2. Italy
12.3.3. France
12.3.4. U.K.
12.3.5. Spain
12.3.6. Benelux
12.3.7. Nordic
12.3.8. Russia
12.3.9. Poland
12.3.10. Rest of Europe
12.4. Market Size (US$ Mn) and Volume (‘000 Tons) Historical Analysis 2014-2018, by Application
12.4.1. Printing Papers
12.4.2. Newsprint
12.4.3. Writing Paper
12.4.4. Hygiene Papers
12.4.5. Packaging
12.4.5.1. Carton Board
12.4.5.2. Corrugated Board
12.4.5.3. Flexible Papers
12.4.6. Others
12.5. Market Size (US$ Mn) and Volume (‘000 Tons) Forecast 2019-2027, by Application
12.5.1. Printing Papers
12.5.2. Newsprint
12.5.3. Writing Paper
12.5.4. Hygiene Papers
12.5.5. Packaging
12.5.5.1. Carton Board
12.5.5.2. Corrugated Board
12.5.5.3. Flexible Papers
12.5.6. Others
12.6. Market Size (US$ Mn) and Volume (‘000 Tons) Historical Analysis 2014-2018, by Pulp Type
12.6.1. Chemical Wood Pulp
12.6.1.1. Sulphate Pulp
12.6.1.2. Sulphite Pulp
12.6.2. Mechanical Wood Pulp
12.6.3. Non-wood Pulp
12.6.4. Semi-chemical Pulp
12.6.5. Recycled Pulp
12.7. Market Size (US$ Mn) and Volume (‘000 Tons) Forecast 2019-2027, by Pulp Type
12.7.1. Chemical Wood Pulp
12.7.1.1. Sulphate Pulp
12.7.1.2. Sulphite Pulp
12.7.2. Mechanical Wood Pulp
12.7.3. Non-wood Pulp
12.7.4. Semi-chemical Pulp
12.7.5. Recycled Pulp
12.8. Market Size (US$ Mn) and Volume (‘000 Tons) Historical Analysis 2014-2018, by Paper Type
12.8.1. Coated Paper
12.8.2. Uncoated Paper
12.9. Market Size (US$ Mn) and Volume (‘000 Tons) Forecast 2019-2027, by Paper Type
12.9.1. Coated Paper
12.9.2. Uncoated Paper
12.10. Market Size (US$ Mn) and Volume (‘000 Tons) Historical Analysis 2014-2018, by End Use
12.10.1. Printing
12.10.2. Packing & Wrapping
12.10.3. Consumer Goods
12.10.4. Food Services and Others
12.11. Market Size (US$ Mn) and Volume (‘000 Tons) Forecast 2019-2027, by End Use
12.11.1. Printing
12.11.2. Packing & Wrapping
12.11.3. Consumer Goods
12.11.4. Food Service and Others
13. APAC Converting Paper Market Analysis
13.1. Introduction
13.2. Pricing Analysis
13.3. Market Size (US$ Mn) and Volume (‘000 Tons) Historical Analysis 2014-2018, by Country
13.3.1. China
13.3.2. India
13.3.3. ASEAN
13.3.4. Australia and New Zealand
13.3.5. Japan
13.3.6. Rest of APAC
13.4. Market Size (US$ Mn) and Volume (‘000 Tons) Forecast 2019-2028, by Country
13.4.1. China
13.4.2. India
13.4.3. ASEAN
13.4.4. Australia and New Zealand
13.4.5. Japan
13.4.6. Rest of APAC
13.5. Market Size (US$ Mn) and Volume (‘000 Tons) Historical Analysis 2014-2018, by Application
13.5.1. Printing Papers
13.5.2. Newsprint
13.5.3. Writing Paper
13.5.4. Hygiene Papers
13.5.5. Packaging
13.5.5.1. Carton Board
13.5.5.2. Corrugated Board
13.5.5.3. Flexible Papers
13.5.6. Others
13.6. Market Size (US$ Mn) and Volume (‘000 Tons) Forecast 2019-2027, by Application
13.6.1. Printing Papers
13.6.2. Newsprint
13.6.3. Writing Paper
13.6.4. Hygiene Papers
13.6.5. Packaging
13.6.5.1. Carton Board
13.6.5.2. Corrugated Board
13.6.5.3. Flexible Papers
13.6.6. Others
13.7. Market Size (US$ Mn) and Volume (‘000 Tons) Historical Analysis 2014-2018, by Pulp Type
13.7.1. Chemical Wood Pulp
13.7.1.1. Sulphate Pulp
13.7.1.2. Sulphite Pulp
13.7.2. Mechanical Wood Pulp
13.7.3. Non-wood Pulp
13.7.4. Semi-chemical Pulp
13.7.5. Recycled Pulp
13.8. Market Size (US$ Mn) and Volume (‘000 Tons) Forecast 2019-2027, by Pulp Type
13.8.1. Chemical Wood Pulp
13.8.1.1. Sulphate Pulp
13.8.1.2. Sulphite Pulp
13.8.2. Mechanical Wood Pulp
13.8.3. Non-wood Pulp
13.8.4. Semi-chemical Pulp
13.8.5. Recycled Pulp
13.9. Market Size (US$ Mn) and Volume (‘000 Tons) Historical Analysis 2014-2018, by Paper Type
13.9.1. Coated Paper
13.9.2. Uncoated Paper
13.10. Market Size (US$ Mn) and Volume (‘000 Tons) Forecast 2019-2027, by Paper Type
13.10.1. Coated Paper
13.10.2. Uncoated Paper
13.11. Market Size (US$ Mn) and Volume (‘000 Tons) Historical Analysis 2014-2018, by End Use
13.11.1. Printing
13.11.2. Packing & Wrapping
13.11.3. Consumer Goods
13.11.4. Food Services and Others
13.12. Market Size (US$ Mn) and Volume (‘000 Tons) Forecast 2019-2027, by End Use
13.12.1. Printing
13.12.2. Packing & Wrapping
13.12.3. Consumer Goods
13.12.4. Food Service and Others
14. MEA Converting Paper Market Analysis
14.1. Introduction
14.2. Pricing Analysis
14.3. Market Size (US$ Mn) and Volume (‘000 Tons) Historical Analysis 2014-2018, by Country
14.3.1. GCC Countries
14.3.2. Northern Africa
14.3.3. South Africa
14.3.4. Turkey
14.3.5. Rest of MEA
14.4. Market Size (US$ Mn) and Volume (‘000 Tons) Forecast 2019-2028, by Country
14.4.1. GCC Countries
14.4.2. Northern Africa
14.4.3. South Africa
14.4.4. Turkey
14.4.5. Rest of MEA
14.5. Market Size (US$ Mn) and Volume (‘000 Tons) Historical Analysis 2014-2018, by Application
14.5.1. Printing Papers
14.5.2. Newsprint
14.5.3. Writing Paper
14.5.4. Hygiene Papers
14.5.5. Packaging
14.5.5.1. Carton Board
14.5.5.2. Corrugated Board
14.5.5.3. Flexible Papers
14.5.6. Others
14.6. Market Size (US$ Mn) and Volume (‘000 Tons) Forecast 2019-2027, by Application
14.6.1. Printing Papers
14.6.2. Newsprint
14.6.3. Writing Paper
14.6.4. Hygiene Papers
14.6.5. Packaging
14.6.5.1. Carton Board
14.6.5.2. Corrugated Board
14.6.5.3. Flexible Papers
14.6.6. Others
14.7. Market Size (US$ Mn) and Volume (‘000 Tons) Historical Analysis 2014-2018, by Pulp Type
14.7.1. Chemical Wood Pulp
14.7.1.1. Sulphate Pulp
14.7.1.2. Sulphite Pulp
14.7.2. Mechanical Wood Pulp
14.7.3. Non-wood Pulp
14.7.4. Semi-chemical Pulp
14.7.5. Recycled Pulp
14.8. Market Size (US$ Mn) and Volume (‘000 Tons) Forecast 2019-2027, by Pulp Type
14.8.1. Chemical Wood Pulp
14.8.1.1. Sulphate Pulp
14.8.1.2. Sulphite Pulp
14.8.2. Mechanical Wood Pulp
14.8.3. Non-wood Pulp
14.8.4. Semi-chemical Pulp
14.8.5. Recycled Pulp
14.9. Market Size (US$ Mn) and Volume (‘000 Tons) Historical Analysis 2014-2018, by Paper Type
14.9.1. Coated Paper
14.9.2. Uncoated Paper
14.10. Market Size (US$ Mn) and Volume (‘000 Tons) Forecast 2019-2027, by Paper Type
14.10.1. Coated Paper
14.10.2. Uncoated Paper
14.11. Market Size (US$ Mn) and Volume (‘000 Tons) Historical Analysis 2014-2018, by End Use
14.11.1. Printing
14.11.2. Packing & Wrapping
14.11.3. Consumer Goods
14.11.4. Food Services and Others
14.12. Market Size (US$ Mn) and Volume (‘000 Tons) Forecast 2019-2027, by End Use
14.12.1. Printing
14.12.2. Packing & Wrapping
14.12.3. Consumer Goods
14.12.4. Food Service and Others
15. Market Structure Analysis
16. Competition Analysis
16.1. Competition Dashboard
16.2. Competition Developments
16.3. Competition Analysis
16.3.1. American Eagle Paper Mills
16.3.2. International Paper Inc.
16.3.3. Delta Paper Corp.
16.3.4. Domtar Inc.
16.3.5. Canfor Corp.
16.3.6. Clearwater Paper Corporation
16.3.7. Georgia-Pacific Corp.
16.3.8. Alberta Newsprint Company
16.3.9. Catalyst Paper
16.3.10. Finch Paper LLC
16.3.11. Asia Pacific Resources International Holdings
16.3.12. Glatfelter
16.3.13. Mitsubishi Paper Mills Ltd.
16.3.14. Verso Corporation
16.3.15. Asia Pulp & Paper
16.3.16. Burgo Group Spa
16.3.17. Stora Enso
16.3.18. Twin Rivers Paper Company
16.3.19. UPM-Kymmene Oyj
16.3.20. Rolland Paper
17. Assumptions and Acronyms
18. Research Methodology
List of Tables
Table 01: Global Converting Paper Market Value (US$ Bn) and Volume (Mn tons) Forecast, by Application, 2014H – 2027F
Table 02: Global Converting Paper Market Value (US$ Bn) and Volume (Mn tons) Forecast, by Application, 2014H – 2027F
Table 03: Global Converting Paper Market Value (US$ Bn) and Volume (Mn tons) Forecast, by Pulp Type, 2014H – 2027F
Table 04: Global Converting Paper Market Value (US$ Bn) and Volume (Mn tons) Forecast, by Paper Type, 2014H – 2027F
Table 05: Global Converting Paper Market Value (US$ Bn) and Volume (Mn tons) Forecast, by End Use, 2014H – 2027F
Table 06: Global Converting Paper Market Value (US$ Bn) and Volume (Mn tons) Forecast, by Region, 2014H – 2027F
Table 07: North America Converting Paper Market Value (US$ Bn) and Volume (Mn tons) Forecast, by Country, 2014H – 2027F
Table 08: North America Converting Paper Market Value (US$ Bn) and Volume (Mn tons) Forecast, by Application, 2014H – 2027F
Table 09: North America Converting Paper Market Value (US$ Bn) and Volume (Mn tons) Forecast, by Application, 2014H – 2027F
Table 10: North America Converting Paper Market Value (US$ Bn) and Volume (Mn tons) Forecast, by Pulp Type, 2014H – 2027F
Table 11: North America Converting Paper Market Value (US$ Bn) and Volume (Mn tons) Forecast, by Paper Type, 2014H – 2027F
Table 12: North America Converting Paper Market Value (US$ Bn) and Volume (Mn tons) Forecast, by End Use, 2014H – 2027F
Table 13: Latin America Converting Paper Market Value (US$ Mn) and Volume ('000 tons) Forecast, by Country, 2014H – 2027F
Table 14: Latin America Converting Paper Market Value (US$ Mn) and Volume ('000 tons) Forecast, by Application, 2014H – 2027F
Table 15: Latin America Converting Paper Market Value (US$ Mn) and Volume ('000 tons) Forecast, by Application, 2014H – 2027F
Table 16: Latin America Converting Paper Market Value (US$ Mn) and Volume ('000 tons) Forecast, by Pulp Type, 2014H – 2027F
Table 17: Latin America Converting Paper Market Value (US$ Mn) and Volume ('000 tons) Forecast, by Paper Type, 2014H – 2027F
Table 18: Latin America Converting Paper Market Value (US$ Mn) and Volume ('000 tons) Forecast, by End Use, 2014H – 2027F
Table 19: Europe Converting Paper Market Value (US$ Bn) and Volume (Mn tons) Forecast, by Country, 2014H – 2027F
Table 20: Europe Converting Paper Market Value (US$ Bn) and Volume (Mn tons) Forecast, by Country, 2014H – 2027F
Table 21: Europe Converting Paper Market Value (US$ Bn) and Volume (Mn tons) Forecast, by Application, 2014H – 2027F
Table 22: Europe Converting Paper Market Value (US$ Bn) and Volume (Mn tons) Forecast, by Application, 2014H – 2027F
Table 23: Europe Converting Paper Market Value (US$ Bn) and Volume (Mn tons) Forecast, by Pulp Type, 2014H – 2027F
Table 24: Europe Converting Paper Market Value (US$ Bn) and Volume (Mn tons) Forecast, by Paper Type, 2014H – 2027F
Table 25: Europe Converting Paper Market Value (US$ Bn) and Volume (Mn tons) Forecast, by End Use, 2014H – 2027F
Table 26: Asia Pacific Converting Paper Market Value (US$ Bn) and Volume (Mn tons) Forecast, by Country, 2014H – 2027F
Table 27: Asia Pacific Converting Paper Market Value (US$ Bn) and Volume (Mn tons) Forecast, by Application, 2014H – 2027F
Table 28: Asia Pacific Converting Paper Market Value (US$ Bn) and Volume (Mn tons) Forecast, by Application, 2014H – 2027F
Table 29: Asia Pacific Converting Paper Market Value (US$ Bn) and Volume (Mn tons) Forecast, by Pulp Type, 2014H – 2027F
Table 30: Asia Pacific Converting Paper Market Value (US$ Bn) and Volume (Mn tons) Forecast, by Paper Type, 2014H – 2027F
Table 31: Asia Pacific Converting Paper Market Value (US$ Bn) and Volume (Mn tons) Forecast, by End Use, 2014H – 2027F
Table 32: MEA Converting Paper Market Value (US$ Mn) and Volume (Mn tons) Forecast, by Country, 2014H – 2027F
Table 33: MEA Converting Paper Market Value (US$ Mn) and Volume (Mn tons) Forecast, by Application, 2014H – 2027F
Table 34: MEA Converting Paper Market Value (US$ Mn) and Volume (Mn tons) Forecast, by Application, 2014H – 2027F
Table 35: MEA Converting Paper Market Value (US$ Mn) and Volume (Mn tons) Forecast, by Pulp Type, 2014H – 2027F
Table 36: MEA Converting Paper Market Value (US$ Mn) and Volume (Mn tons) Forecast, by Paper Type, 2014H – 2027F
Table 37: MEA Converting Paper Market Value (US$ Mn) and Volume (Mn tons) Forecast, by End Use, 2014H – 2027F
List of Figures
Figure 01: Global Converting Paper Market Share Analysis, by Application, 2014(H), 2019(E) & 2027(F)
Figure 02: Global Converting Paper Market Y-o-Y Growth, by Application, 2014(H)-2027(F)
Figure 03: Global Converting Paper Attractiveness Index, by Application, 2019(E) – 2027(F)
Figure 04: Global Converting Paper Market Share Analysis, by Pulp Type, 2014(H), 2019(E) & 2027(F)
Figure 05: Global Converting Paper Market Y-o-Y Growth, by Pulp Type, 2015(H)-2027(F)
Figure 06: Global Converting Paper Attractiveness Index, by Pulp Type, 2019(E) – 2027(F)
Figure 07: Global Converting Paper Market Share Analysis, by Paper Type, 2014(H), 2019(E) & 2027(F)
Figure 08: Global Converting Paper Market Y-o-Y Growth, by Paper Type, 2014(H)-2027(F)
Figure 09: Global Converting Paper Attractiveness Index, by Paper Type, 2019(E) – 2027(F)
Figure 10: Global Converting Paper Market Share Analysis, by End Use, 2014(H), 2019(E) & 2027(F)
Figure 11: Global Converting Paper Market Y-o-Y Growth, by End Use, 2014(H)-2027(F)
Figure 12: Global Converting Paper Attractiveness Index, by End Use, 2019(E) – 2027(F)
Figure 13: Global Converting Paper Market Share Analysis, by Region, 2014(H), 2019(E) & 2027(F)
Figure 14: Global Converting Paper Market Y-o-Y Growth, by Region, 2014(H)-2027(F)
Figure 15: Global Converting Paper Attractiveness Index, by Region, 2019(E) – 2027(F)
Figure 16: North America Converting Paper Market Share Analysis, by Country, 2014(H), 2019(E) & 2027(F)
Figure 17: North America Converting Paper Attractiveness Index, by Country, 2019(E) – 2027(F)
Figure 18: North America Converting Paper Market Share Analysis, by Application, 2014(H), 2019(E) & 2027(F)
Figure 19: North America Converting Paper Attractiveness Index, by Application, 2019(E) – 2027(F)
Figure 20: North America Converting Paper Market Share Analysis, by Pulp Type, 2014(H), 2019(E) & 2027(F)
Figure 21: North America Converting Paper Attractiveness Index, by Pulp Type, 2019(E) – 2027(F)
Figure 22: North America Converting Paper Market Share Analysis, by Paper Type, 2014(H), 2019(E) & 2027(F)
Figure 23: North America Converting Paper Attractiveness Index, by Paper Type, 2019(E) – 2027(F)
Figure 24: North America Converting Paper Market Share Analysis, by End Use, 2014(H), 2019(E) & 2027(F)
Figure 25: North America Converting Paper Attractiveness Index, by End Use, 2019(E) – 2027(F)
Figure 26: Latin America Converting Paper Market Share Analysis, by Country, 2014(H), 2019(E) & 2027(F)
Figure 27: Latin America Converting Paper Attractiveness Index, by Country, 2019(E) – 2027(F)
Figure 28: Latin America Converting Paper Market Share Analysis, by Application, 2014(H), 2019(E) & 2027(F)
Figure 29: Latin America Converting Paper Attractiveness Index, by Application, 2019(E) – 2027(F)
Figure 30: Latin America Converting Paper Market Share Analysis, by Pulp Type, 2014(H), 2019(E) & 2027(F)
Figure 31: Latin America Converting Paper Attractiveness Index, by Pulp Type, 2019(E) – 2027(F)
Figure 32: Latin America Converting Paper Market Share Analysis, by Paper Type, 2014(H), 2019(E) & 2027(F)
Figure 33: Latin America Converting Paper Attractiveness Index, by Paper Type, 2019(E) – 2027(F)
Figure 34: Latin America Converting Paper Market Share Analysis, by End Use, 2014(H), 2019(E) & 2027(F)
Figure 35: Latin America Converting Paper Attractiveness Index, by End Use, 2019(E) – 2027(F)
Figure 36: Europe Converting Paper Market Share Analysis, by Country, 2014(H), 2019(E) & 2027(F)
Figure 37: Europe Converting Paper Attractiveness Index, by Country, 2019(E) – 2027(F)
Figure 38: Europe Converting Paper Market Share Analysis, by Application, 2014(H), 2019(E) & 2027(F)
Figure 39: Europe Converting Paper Attractiveness Index, by Application, 2019(E) – 2027(F)
Figure 40: Europe Converting Paper Market Share Analysis, by Pulp Type, 2014(H), 2019(E) & 2027(F)
Figure 41: Europe Converting Paper Attractiveness Index, by Pulp Type, 2019(E) – 2027(F)
Figure 42: Europe Converting Paper Market Share Analysis, by Paper Type, 2014(H), 2019(E) & 2027(F)
Figure 43: Europe Converting Paper Attractiveness Index, by Paper Type, 2019(E) – 2027(F)
Figure 44: Europe Converting Paper Market Share Analysis, by End Use, 2014(H), 2019(E) & 2027(F)
Figure 45: Europe Converting Paper Attractiveness Index, by End Use, 2019(E) – 2027(F)
Figure 46: Asia Pacific Converting Paper Market Share Analysis, by Country, 2014(H), 2019(E) & 2027(F)
Figure 47: Asia Pacific Converting Paper Attractiveness Index, by Country, 2019(E) – 2027(F)
Figure 48: Asia Pacific Converting Paper Market Share Analysis, by Application, 2014(H), 2019(E) & 2027(F)
Figure 49: Asia Pacific Converting Paper Attractiveness Index, by Application, 2019(E) – 2027(F)
Figure 50: Asia Pacific Converting Paper Market Share Analysis, by Pulp Type, 2014(H), 2019(E) & 2027(F)
Figure 51: Asia Pacific Converting Paper Attractiveness Index, by Pulp Type, 2019(E) – 2027(F)
Figure 52: Asia Pacific Converting Paper Market Share Analysis, by Paper Type, 2014(H), 2019(E) & 2027(F)
Figure 53: Asia Pacific Converting Paper Attractiveness Index, by Paper Type, 2019(E) – 2027(F)
Figure 54: Asia Pacific Converting Paper Market Share Analysis, by End Use, 2014(H), 2019(E) & 2027(F)
Figure 55: Asia Pacific Converting Paper Attractiveness Index, by End Use, 2019(E) – 2027(F)
Figure 56: MEA Converting Paper Market Share Analysis, by Country, 2014(H), 2019(E) & 2027(F)
Figure 57: MEA Converting Paper Attractiveness Index, by Country, 2019(E) – 2027(F)
Figure 58: MEA Converting Paper Market Share Analysis, by Application, 2014(H), 2019(E) & 2027(F)
Figure 59: MEA Converting Paper Attractiveness Index, by Application, 2019(E) – 2027(F)
Figure 60: MEA Converting Paper Market Share Analysis, by Pulp Type, 2014(H), 2019(E) & 2027(F)
Figure 61: MEA Converting Paper Attractiveness Index, by Pulp Type, 2019(E) – 2027(F)
Figure 62: MEA Converting Paper Market Share Analysis, by Paper Type, 2014(H), 2019(E) & 2027(F)
Figure 63: MEA Converting Paper Attractiveness Index, by Paper Type, 2019(E) – 2027(F)
Figure 64: MEA Converting Paper Market Share Analysis, by End Use, 2014(H), 2019(E) & 2027(F)
Figure 65: MEA Converting Paper Attractiveness Index, by End Use, 2019(E) – 2027(F)
Copyright © Transparency Market Research, Inc. All Rights reserved
Trust Online

Converting Paper Market