
Reports
Reports
Beverage manufacturers are increasingly focusing on offering better product with the packaging that is easy-to-handle, eco-friendly and keeps product fresh for a long time. Packaging innovation is becoming norm for beverage companies with smaller package size, situational package types, and multi-packs.
See-through packaging is gaining popularity as manufacturers are producing beverages that are visually appealing, that attracts consumer towards the brand. Recyclable aluminum cans and PET bottles for packaging beverages have been the popular packaging choice of manufacturers for quite long time. Meanwhile, plant-based material for producing beverage packages are also becoming popular among the beverage manufacturers. Consumer are also looking for less complicated materials and patterns when it comes to package design. With the rapid rise in e-commerce, manufacturers are focusing on providing safe packaging and spill-proof packaging for beverages. Growing demand for beverages also drives the adoption of automated packaging machinery that are energy efficient. In addition, the consumer preference for aesthetically appealing and attractively designed & labeled beverage packaging is surging across the globe.
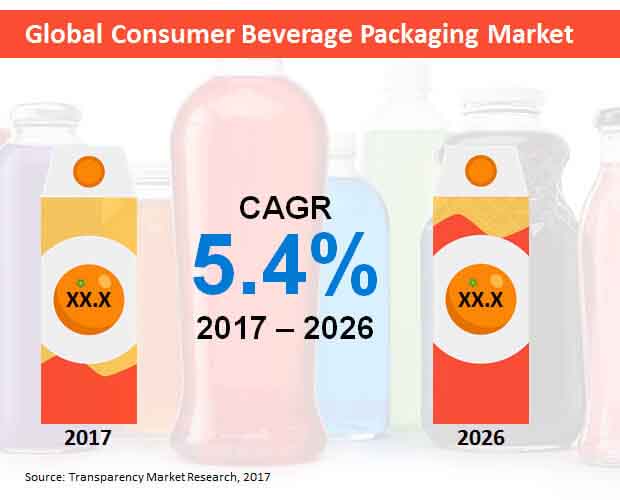
A recent report collated by Transparency Market Research (TMR) projects the global market for consumer beverage packaging to witness a steady growth. The market is likely to record 5.4% CAGR, in terms of value, between the period 2017 and 2026. Over 65,000,000 tons of consumer beverage packaging are estimated to sold around the world by 2026-end.
North America is expected to remain the fastest expanding as well as the most lucrative market for consumer beverage packaging, in terms of value. This is mainly because of robust demand for consumer beverages in the region, along with growing penetration of automation in the beverage packaging industry. However, in terms of volume, sales in Asia-Pacific excluding Japan (APEJ) and North America are projected to register a parallel rise through 2026. APEJ will also remain a key remunerative region for the consumer beverage packaging market, mainly driven by factors such as the emergence of brewing industry, and surging demand for alcoholic beverages in countries such as India and China.
Growing concerns regarding use of plastic on the back of their carbon footprint during production, and risk related to metal particles invading the products, has led manufacturers to adopt paper & paperboard for packaging of various edible products, and beverages are no exception. Paper & paperboard will continue to lead the global consumer beverage packaging market in terms of volume as well as value. In terms of value, between plastic and metal, revenues from the latter will remain relatively larger, while sales of the former will record a comparatively higher CAGR through 2026.
Through acquisition of product design-specialized enterprises, and new product launches, vendors in the global consumer beverage packaging market are constantly focusing on enhancing their product portfolio. Key players identified by the report, who actively underpin the market expansion, include Honda Motor Co., Ltd., Generac Holdings Inc., Champion Power Equipment, Inc., Yamaha Motor Co., Ltd., Wuxi Kipor Power Co. Ltd., Hyundai Motor Company, Lifan Industry (Group) Co., Ltd., Briggs & Stratton Corporation, Ryobi Limited, Toshiba Corporation, and Subaru Corporation.
Consumer Beverage Packaging Market Observes Growth owing to Rising Disposable Income
Packaging plays an important role in the widespread beverage consumption. Different types of beverages are packed in different sizes and materials. Such varieties in packaging are a reflection of the size of the huge packaging market. In addition, the demand for packaging has observed a considerable rise as it is a consumer end market. The growth of the global consumer beverage packaging market is likely to be driven by the rapidly changing lifestyle of people, urbanization, and disposable income.
There has been a shift in preferences of consumers with many moving toward beverages that have long shelf life. This change in preference has resulted in compelling beverage industry to make an offering of convenient and sustainable packaging solution, which also reduces the cost of storage. In an effort to cater to the needs of consumers and to offer them superior quality beverages, packaging companies are coming up with products that resists moisture, provides thermal insulation, and are durable. Riding on the back of such factors, the global consumer beverage packaging market is anticipated to observe considerable growth in the years to come.
Rising Demand for Alcoholic Beverage to Accelerate Growth of the Market
Increased disposable income together with the rising demand for various premium products is driving the consumption of alcoholic beverage. In various countries, such as Portugal, the UK, Moldova, Slovakia, Belarus, Russia, and Lithuania, both traditions and culture play an important role in generating high demand for alcohol. In developing countries like India and China, the demand for alcohol is witnessing a considerable rise. Rising demand for alcohol and alcoholic beverage are anticipated to work in favor of the global consumer beverage packaging market in the years to come.
Different bioplastics, such as PHA and PLA, are biodegradable ones, while some others like bio-PET and bio-PE are not. Use of these plastics leave less carbon footprint in the nature and so they are preferred over the conventional ones. With increased emphasis on environmental sustainability, there has been a rising demand for bio-based options. This factor is likely to play an important role in the development of the global consumer beverage packaging market in the years to come.
1. Global Economic Outlook
2. Global Consumer Beverage Packaging Market - Executive Summary
3. Global Consumer Beverage Packaging Market Overview
3.1. Introduction
3.1.1. Global Consumer Beverage Packaging Market Taxonomy
3.1.2. Global Consumer Beverage Packaging Market Definition
3.2. Global Consumer Beverage Packaging Market Size (US$ Mn) and Forecast, 2012-2026
3.2.1. Global Consumer Beverage Packaging Market Y-o-Y Growth
3.3. Global Consumer Beverage Packaging Market Dynamics
3.4. Retail Industry- Top 250 Players Quick Statistics
3.5 Top 10 Retailers (2017)
3.6. Geographic Analysis- Retail Industry Analysis
3.7 Retail revenue growth and profitability by region/country, FY2017
3.8. Product Sector Analysis
3.9 Retail revenue growth and profitability by region/country, FY2017
3.10. Retail revenue growth and profitability by primary product sector, FY2017
3.11 Top 10 Upcoming Retail Outlets
3.12. Global Retail Development Index 2017
3.13 Supply Chain of Floor Consumer Beverage Packaging Market
3.14. Cost Structure of Consumer Beverage Packaging Market
3.15 Porter’s Five Forces analysis
3.16. Product Life Cycle of Consumer Beverage Packaging Market
3.17. Key Participants Market Presence (Intensity Map) By Region
4. Global Consumer Beverage Packaging Market Supply Demand Analysis
4.1. Number of Manufacturers by Region
4.2. Production Volume by Key Players
4.3. Importer Concentration by Region
4.4. Key Participants Market Presence (Intensity Map) By Region
4.5. North America Production, Consumption, Export, Import and Net Trade Outlook
4.6. Latin America Production, Consumption, Export, Import and Net Trade Outlook
4.7. Europe Production, Consumption, Export, Import and Net Trade Outlook
4.8. Japan Production, Consumption, Export, Import and Net Trade Outlook
4.9. APEJ Production, Consumption, Export, Import and Net Trade Outlook
4.10. MEA Production, Consumption, Export, Import and Net Trade Outlook
5. Pricing Point Analysis
5.1. Price Point Assessment by Region
5.2. Price Point Assessment by Packaging Material
5.3. Price Forecast till 2026
5.4. Factors Influencing Pricing
5.5. Value Chain Pricing Mark-ups
6. Global Consumer Beverage Packaging Market Analysis and Forecast 2012-2026
6.1. Global Consumer Beverage Packaging Market Size and Forecast By Packaging Material, 2012-2026
6.1.1. Paper & Paperboard Market Size and Forecast, 2012-2026
6.1.1.1. 1000 Comparison, By Region
6.1.1.2. Market Share Comparison, By Region
6.1.1.3. Y-o-Y growth Comparison, By Region
6.1.2. Plastic Market Size and Forecast, 2012-2026
6.1.2.1. 1000 Comparison, By Region
6.1.2.2. Market Share Comparison, By Region
6.1.2.3. Y-o-Y growth Comparison, By Region
6.1.3. Metal Market Size and Forecast, 2012-2026
6.1.3.1. 1000 Comparison, By Region
6.1.3.2. Market Share Comparison, By Region
6.1.3.3. Y-o-Y growth Comparison, By Region
6.1.4. Other Packaging Material (Glass, wood, fiber etc.) Market Size and Forecast, 2012-2026
6.1.4.1. 1000 Comparison, By Region
6.1.4.2. Market Share Comparison, By Region
6.1.4.3. Y-o-Y growth Comparison, By Region
6.2. Global Consumer Beverage Packaging Market Size and Forecast By Packaging Type, 2012-2026
6.2.1. Boxes & Cartons Market Size and Forecast, 2012-2026
6.2.1.1. 1000 Comparison, By Region
6.2.1.2. Market Share Comparison, By Region
6.2.1.3. Y-o-Y growth Comparison, By Region
6.2.2. Bags & Pouches Market Size and Forecast, 2012-2026
6.2.2.1. 1000 Comparison, By Region
6.2.2.2. Market Share Comparison, By Region
6.2.2.3. Y-o-Y growth Comparison, By Region
6.2.3. Containers (plastic containers, metal cans) Market Size and Forecast, 2012-2026
6.2.3.1. 1000 Comparison, By Region
6.2.3.2. Market Share Comparison, By Region
6.2.3.3. Y-o-Y growth Comparison, By Region
6.2.4. Bottles & Jars Market Size and Forecast, 2012-2026
6.2.4.1. 1000 Comparison, By Region
6.2.4.2. Market Share Comparison, By Region
6.2.4.3. Y-o-Y growth Comparison, By Region
6.2.5. Others (Cups, Tubs, Bowls etc.) Market Size and Forecast, 2012-2026
6.2.5.1. 1000 Comparison, By Region
6.2.5.2. Market Share Comparison, By Region
6.2.5.3. Y-o-Y growth Comparison, By Region
6.3. Global Consumer Beverage Packaging Market Size and Forecast By Application, 2012-2026
6.3.1. Alcoholic Beverages Market Size and Forecast, 2012-2026
6.3.1.1. 1000 Comparison, By Region
6.3.1.2. Market Share Comparison, By Region
6.3.1.3. Y-o-Y growth Comparison, By Region
6.3.2. Carbonated Soft Drinks Market Size and Forecast, 2012-2026
6.3.2.1. 1000 Comparison, By Region
6.3.2.2. Market Share Comparison, By Region
6.3.2.3. Y-o-Y growth Comparison, By Region
6.3.3. Bottled Water Market Size and Forecast, 2012-2026
6.3.3.1. 1000 Comparison, By Region
6.3.3.2. Market Share Comparison, By Region
6.3.3.3. Y-o-Y growth Comparison, By Region
6.3.4. Ready to Drink Beverages Market Size and Forecast, 2012-2026
6.3.4.1. 1000 Comparison, By Region
6.3.4.2. Market Share Comparison, By Region
6.3.4.3. Y-o-Y growth Comparison, By Region
6.3.5. Energy Drink Market Size and Forecast, 2012-2026
6.3.5.1. 1000 Comparison, By Region
6.3.5.2. Market Share Comparison, By Region
6.3.5.3. Y-o-Y growth Comparison, By Region
6.3.6. Tea/Coffee Market Size and Forecast, 2012-2026
6.3.6.1. 1000 Comparison, By Region
6.3.6.2. Market Share Comparison, By Region
6.3.6.3. Y-o-Y growth Comparison, By Region
6.3.7. Milk Products Market Size and Forecast, 2012-2026
6.3.7.1. 1000 Comparison, By Region
6.3.7.2. Market Share Comparison, By Region
6.3.7.3. Y-o-Y growth Comparison, By Region
7. North America Consumer Beverage Packaging Market Size and Forecast, 2012-2026
7.1. North America Outlook
7.2. North America Parent Market Outlook
7.3. North America Target Market Outlook
7.4. 1000 Comparison, By Country
7.4.1. US Market Size and Forecast (US$ Mn), 2012-2026
7.4.2. Canada Market Size and Forecast (US$ Mn), 2012-2026
7.5. 1000 Comparison, By Packaging Material
7.6. 1000 Comparison, By Packaging Type
7.7. 1000 Comparison, By Application
8. Latin America Consumer Beverage Packaging Market Size and Forecast, 2012-2026
8.1. Latin America Outlook
8.2. Latin America Parent Market Outlook
8.3. Latin America Target Market Outlook
8.4. 1000 Comparison, By Country
8.4.1. Brazil Market Size and Forecast (US$ Mn), 2012-2026
8.4.2. Mexico Market Size and Forecast (US$ Mn), 2012-2026
8.4.3. Argentina Market Size and Forecast (US$ Mn), 2012-2026
8.4.4. Rest of Latin America Market Size and Forecast (US$ Mn), 2012-2026
8.5. 1000 Comparison, By Packaging Material
8.6. 1000 Comparison, By Packaging Type
8.7. 1000 Comparison, By Application
9. Europe Consumer Beverage Packaging Market Size and Forecast, 2012-2026
9.1. Europe Outlook
9.2. Europe Parent Market Outlook
9.3. Europe Target Market Outlook
9.4. 1000 Comparison, By Country
9.4.1. Germany Market Size and Forecast (US$ Mn), 2012-2026
9.4.2. UK Market Size and Forecast (US$ Mn), 2012-2026
9.4.3. France Market Size and Forecast (US$ Mn), 2012-2026
9.4.4. Russia Market Size and Forecast (US$ Mn), 2012-2026
9.4.5. Italy Market Size and Forecast (US$ Mn), 2012-2026
9.4.6. Rest of Europe Market Size and Forecast (US$ Mn), 2012-2026
9.5. 1000 Comparison, By Packaging Material
9.6. 1000 Comparison, By Packaging Type
9.7. 1000 Comparison, By Application
10. Japan Consumer Beverage Packaging Market Size and Forecast, 2012-2026
10.1. Japan Outlook
10.2. Japan Parent Market Outlook
10.3. Japan Target Market Outlook
10.4. 1000 Comparison, By Country
10.4.1. Japan Market Size and Forecast (US$ Mn), 2012-2026
10.5. 1000 Comparison, By Packaging Material
10.6. 1000 Comparison, By Packaging Type
10.7. 1000 Comparison, By Application
11. APEJ Consumer Beverage Packaging Market Size and Forecast, 2012-2026
11.1. APEJ Outlook
11.2. APEJ Parent Market Outlook
11.3. APEJ Target Market Outlook
11.4. 1000 Comparison, By Country
11.4.1. China Market Size and Forecast (US$ Mn), 2012-2026
11.4.2. India Market Size and Forecast (US$ Mn), 2012-2026
11.4.3. Thailand Market Size and Forecast (US$ Mn), 2012-2026
11.4.4. Singapore Market Size and Forecast (US$ Mn), 2012-2026
11.4.5. Australia & New Zealand Market Size and Forecast (US$ Mn), 2012-2026
11.4.6. Rest of APEJ Market Size and Forecast (US$ Mn), 2012-2026
11.5. 1000 Comparison, By Packaging Material
11.6. 1000 Comparison, By Packaging Type
11.7. 1000 Comparison, By Application
12. MEA Consumer Beverage Packaging Market Size and Forecast, 2012-2026
12.1. MEA Outlook
12.2. MEA Parent Market Outlook
12.3. MEA Target Market Outlook
12.4. 1000 Comparison, By Country
12.4.1. GCC Countries Market Size and Forecast (US$ Mn), 2012-2026
12.4.2. South Africa Market Size and Forecast (US$ Mn), 2012-2026
12.4.3. Nigeria Market Size and Forecast (US$ Mn), 2012-2026
12.4.4. Rest of MEA Market Size and Forecast (US$ Mn), 2012-2026
12.5. 1000 Comparison, By Packaging Material
12.6. 1000 Comparison, By Packaging Type
12.7. 1000 Comparison, By Application
13. Global Consumer Beverage Packaging Market Company Share, Competition Landscape and Company Profiles
13.1. Competition Dashboard
13.2. Competition Benchmarks
13.3. Profitability and Gross Margin Analysis By Competition
13.4. Competition Developments
13.5. Company Profiles
13.5.1. Bemis Co Ltd.
13.5.2. Berry Global Group ltd
13.5.3. Amcor Ltd.
13.5.4. Sealed Air Corporation.
13.5.5. WinPak Ltd
13.5.6. ALPLA,
13.5.7. Greif Inc
13.5.8. Reynolds Group Holdings
13.5.9. Airlite Plastics
13.5.10. DS Smith
14. Research Methodology
15. Secondary and Primary Sources
16. Assumptions and Acronyms
17. Disclaimer
List of Tables
TABLE 1 Global Consumer Beverage Packaging Market Value (US$ Mn) & Volume (Tonnes), 2012-2017
TABLE 2 Global Consumer Beverage Packaging Market Value (US$ Mn) & Volume (Tonnes), 2018-2026
TABLE 3 Global Consumer Beverage Packaging Market Value (US$ Mn) & Volume (Tonnes) and Y-o-Y, 2017-2026
TABLE 4 Global Paper & Paperboard Segment Value (US$ Mn) & Volume (Tonnes), By Region 2012-2017
TABLE 5 Global Paper & Paperboard Segment Value (US$ Mn) & Volume (Tonnes), By Region 2018-2026
TABLE 6 Global Paper & Paperboard Segment Market Share, By Region 2012-2017
TABLE 7 Global Paper & Paperboard Segment Market Share, By Region 2018-2026
TABLE 8 Global Paper & Paperboard Segment Y-o-Y, By Region 2017-2026
TABLE 9 Global Plastic Segment Value (US$ Mn) & Volume (Tonnes), By Region 2012-2017
TABLE 10 Global Plastic Segment Value (US$ Mn) & Volume (Tonnes), By Region 2018-2026
TABLE 11 Global Plastic Segment Market Share, By Region 2012-2017
TABLE 12 Global Plastic Segment Market Share, By Region 2018-2026
TABLE 13 Global Plastic Segment Y-o-Y, By Region 2017-2026
TABLE 14 Global Metal Segment Value (US$ Mn) & Volume (Tonnes), By Region 2012-2017
TABLE 15 Global Metal Segment Value (US$ Mn) & Volume (Tonnes), By Region 2018-2026
TABLE 16 Global Metal Segment Market Share, By Region 2012-2017
TABLE 17 Global Metal Segment Market Share, By Region 2018-2026
TABLE 18 Global Metal Segment Y-o-Y, By Region 2017-2026
TABLE 19 Global Other Packaging Material (Glass, wood, fiber etc.) Segment Value (US$ Mn) & Volume (Tonnes), By Region 2012-2017
TABLE 20 Global Other Packaging Material (Glass, wood, fiber etc.) Segment Value (US$ Mn) & Volume (Tonnes), By Region 2018-2026
TABLE 21 Global Other Packaging Material (Glass, wood, fiber etc.) Segment Market Share, By Region 2012-2017
TABLE 22 Global Other Packaging Material (Glass, wood, fiber etc.) Segment Market Share, By Region 2018-2026
TABLE 23 Global Other Packaging Material (Glass, wood, fiber etc.) Segment Y-o-Y, By Region 2017-2026
TABLE 24 Global Boxes & Cartons Segment Value (US$ Mn) & Volume (Tonnes), By Region 2012-2017
TABLE 25 Global Boxes & Cartons Segment Value (US$ Mn) & Volume (Tonnes), By Region 2018-2026
TABLE 26 Global Boxes & Cartons Segment Market Share, By Region 2012-2017
TABLE 27 Global Boxes & Cartons Segment Market Share, By Region 2018-2026
TABLE 28 Global Boxes & Cartons Segment Y-o-Y, By Region 2017-2026
TABLE 29 Global Bags & Pouches Segment Value (US$ Mn) & Volume (Tonnes), By Region 2012-2017
TABLE 30 Global Bags & Pouches Segment Value (US$ Mn) & Volume (Tonnes), By Region 2018-2026
TABLE 31 Global Bags & Pouches Segment Market Share, By Region 2012-2017
TABLE 32 Global Bags & Pouches Segment Market Share, By Region 2018-2026
TABLE 33 Global Bags & Pouches Segment Y-o-Y, By Region 2017-2026
TABLE 34 Global Containers (plastic containers, metal cans) Segment Value (US$ Mn) & Volume (Tonnes), By Region 2012-2017
TABLE 35 Global Containers (plastic containers, metal cans) Segment Value (US$ Mn) & Volume (Tonnes), By Region 2018-2026
TABLE 36 Global Containers (plastic containers, metal cans) Segment Market Share, By Region 2012-2017
TABLE 37 Global Containers (plastic containers, metal cans) Segment Market Share, By Region 2018-2026
TABLE 38 Global Containers (plastic containers, metal cans) Segment Y-o-Y, By Region 2017-2026
TABLE 39 Global Bottles & Jars Segment Value (US$ Mn) & Volume (Tonnes), By Region 2012-2017
TABLE 40 Global Bottles & Jars Segment Value (US$ Mn) & Volume (Tonnes), By Region 2018-2026
TABLE 41 Global Bottles & Jars Segment Market Share, By Region 2012-2017
TABLE 42 Global Bottles & Jars Segment Market Share, By Region 2018-2026
TABLE 43 Global Bottles & Jars Segment Y-o-Y, By Region 2017-2026
TABLE 44 Global Others (Cups, Tubs, Bowls etc.) Segment Value (US$ Mn) & Volume (Tonnes), By Region 2012-2017
TABLE 45 Global Others (Cups, Tubs, Bowls etc.) Segment Value (US$ Mn) & Volume (Tonnes), By Region 2018-2026
TABLE 46 Global Others (Cups, Tubs, Bowls etc.) Segment Market Share, By Region 2012-2017
TABLE 47 Global Others (Cups, Tubs, Bowls etc.) Segment Market Share, By Region 2018-2026
TABLE 48 Global Others (Cups, Tubs, Bowls etc.) Segment Y-o-Y, By Region 2017-2026
TABLE 49 Global Alcoholic Beverages Segment Value (US$ Mn) & Volume (Tonnes), By Region 2012-2017
TABLE 50 Global Alcoholic Beverages Segment Value (US$ Mn) & Volume (Tonnes), By Region 2018-2026
TABLE 51 Global Alcoholic Beverages Segment Market Share, By Region 2012-2017
TABLE 52 Global Alcoholic Beverages Segment Market Share, By Region 2018-2026
TABLE 53 Global Alcoholic Beverages Segment Y-o-Y, By Region 2017-2026
TABLE 54 Global Carbonated Soft Drinks Segment Value (US$ Mn) & Volume (Tonnes), By Region 2012-2017
TABLE 55 Global Carbonated Soft Drinks Segment Value (US$ Mn) & Volume (Tonnes), By Region 2018-2026
TABLE 56 Global Carbonated Soft Drinks Segment Market Share, By Region 2012-2017
TABLE 57 Global Carbonated Soft Drinks Segment Market Share, By Region 2018-2026
TABLE 58 Global Carbonated Soft Drinks Segment Y-o-Y, By Region 2017-2026
TABLE 59 Global Bottled Water Segment Value (US$ Mn) & Volume (Tonnes), By Region 2012-2017
TABLE 60 Global Bottled Water Segment Value (US$ Mn) & Volume (Tonnes), By Region 2018-2026
TABLE 61 Global Bottled Water Segment Market Share, By Region 2012-2017
TABLE 62 Global Bottled Water Segment Market Share, By Region 2018-2026
TABLE 63 Global Bottled Water Segment Y-o-Y, By Region 2017-2026
TABLE 64 Global Ready to Drink Beverages Segment Value (US$ Mn) & Volume (Tonnes), By Region 2012-2017
TABLE 65 Global Ready to Drink Beverages Segment Value (US$ Mn) & Volume (Tonnes), By Region 2018-2026
TABLE 66 Global Ready to Drink Beverages Segment Market Share, By Region 2012-2017
TABLE 67 Global Ready to Drink Beverages Segment Market Share, By Region 2018-2026
TABLE 68 Global Ready to Drink Beverages Segment Y-o-Y, By Region 2017-2026
TABLE 69 Global Energy Drink Segment Value (US$ Mn) & Volume (Tonnes), By Region 2012-2017
TABLE 70 Global Energy Drink Segment Value (US$ Mn) & Volume (Tonnes), By Region 2018-2026
TABLE 71 Global Energy Drink Segment Market Share, By Region 2012-2017
TABLE 72 Global Energy Drink Segment Market Share, By Region 2018-2026
TABLE 73 Global Energy Drink Segment Y-o-Y, By Region 2017-2026
TABLE 74 Global Tea/Coffee Segment Value (US$ Mn) & Volume (Tonnes), By Region 2012-2017
TABLE 75 Global Tea/Coffee Segment Value (US$ Mn) & Volume (Tonnes), By Region 2018-2026
TABLE 76 Global Tea/Coffee Segment Market Share, By Region 2012-2017
TABLE 77 Global Tea/Coffee Segment Market Share, By Region 2018-2026
TABLE 78 Global Tea/Coffee Segment Y-o-Y, By Region 2017-2026
TABLE 79 Global Milk Products Segment Value (US$ Mn) & Volume (Tonnes), By Region 2012-2017
TABLE 80 Global Milk Products Segment Value (US$ Mn) & Volume (Tonnes), By Region 2018-2026
TABLE 81 Global Milk Products Segment Market Share, By Region 2012-2017
TABLE 82 Global Milk Products Segment Market Share, By Region 2018-2026
TABLE 83 Global Milk Products Segment Y-o-Y, By Region 2017-2026
TABLE 84 North America Consumer Beverage Packaging Market Value (US$ Mn) & Volume (Tonnes), By Country 2012-2017
TABLE 85 North America Consumer Beverage Packaging Market Value (US$ Mn) & Volume (Tonnes), By Country 2018-2026
TABLE 86 North America Consumer Beverage Packaging Market Value (US$ Mn) & Volume (Tonnes), By Packaging Material 2012-2017
TABLE 87 North America Consumer Beverage Packaging Market Value (US$ Mn) & Volume (Tonnes), By Packaging Material 2018-2026
TABLE 88 North America Consumer Beverage Packaging Market Value (US$ Mn) & Volume (Tonnes), By Packaging Type 2012-2017
TABLE 89 North America Consumer Beverage Packaging Market Value (US$ Mn) & Volume (Tonnes), By Packaging Type 2018-2026
TABLE 90 North America Consumer Beverage Packaging Market Value (US$ Mn) & Volume (Tonnes), By Application 2012-2017
TABLE 91 North America Consumer Beverage Packaging Market Value (US$ Mn) & Volume (Tonnes), By Application 2018-2026
TABLE 92 Latin America Consumer Beverage Packaging Market Value (US$ Mn) & Volume (Tonnes), By Country 2012-2017
TABLE 93 Latin America Consumer Beverage Packaging Market Value (US$ Mn) & Volume (Tonnes), By Country 2018-2026
TABLE 94 Latin America Consumer Beverage Packaging Market Value (US$ Mn) & Volume (Tonnes), By Packaging Material 2012-2017
TABLE 95 Latin America Consumer Beverage Packaging Market Value (US$ Mn) & Volume (Tonnes), By Packaging Material 2018-2026
TABLE 96 Latin America Consumer Beverage Packaging Market Value (US$ Mn) & Volume (Tonnes), By Packaging Type 2012-2017
TABLE 97 Latin America Consumer Beverage Packaging Market Value (US$ Mn) & Volume (Tonnes), By Packaging Type 2018-2026
TABLE 98 Latin America Consumer Beverage Packaging Market Value (US$ Mn) & Volume (Tonnes), By Application 2012-2017
TABLE 99 Latin America Consumer Beverage Packaging Market Value (US$ Mn) & Volume (Tonnes), By Application 2018-2026
TABLE 100 Europe Consumer Beverage Packaging Market Value (US$ Mn) & Volume (Tonnes), By Country 2012-2017
TABLE 101 Europe Consumer Beverage Packaging Market Value (US$ Mn) & Volume (Tonnes), By Country 2018-2026
TABLE 102 Europe Consumer Beverage Packaging Market Value (US$ Mn) & Volume (Tonnes), By Packaging Material 2012-2017
TABLE 103 Europe Consumer Beverage Packaging Market Value (US$ Mn) & Volume (Tonnes), By Packaging Material 2018-2026
TABLE 104 Europe Consumer Beverage Packaging Market Value (US$ Mn) & Volume (Tonnes), By Packaging Type 2012-2017
TABLE 105 Europe Consumer Beverage Packaging Market Value (US$ Mn) & Volume (Tonnes), By Packaging Type 2018-2026
TABLE 106 Europe Consumer Beverage Packaging Market Value (US$ Mn) & Volume (Tonnes), By Application 2012-2017
TABLE 107 Europe Consumer Beverage Packaging Market Value (US$ Mn) & Volume (Tonnes), By Application 2018-2026
TABLE 108 Japan Consumer Beverage Packaging Market Value (US$ Mn) & Volume (Tonnes), By Country 2012-2017
TABLE 109 Japan Consumer Beverage Packaging Market Value (US$ Mn) & Volume (Tonnes), By Country 2018-2026
TABLE 110 Japan Consumer Beverage Packaging Market Value (US$ Mn) & Volume (Tonnes), By Packaging Material 2012-2017
TABLE 111 Japan Consumer Beverage Packaging Market Value (US$ Mn) & Volume (Tonnes), By Packaging Material 2018-2026
TABLE 112 Japan Consumer Beverage Packaging Market Value (US$ Mn) & Volume (Tonnes), By Packaging Type 2012-2017
TABLE 113 Japan Consumer Beverage Packaging Market Value (US$ Mn) & Volume (Tonnes), By Packaging Type 2018-2026
TABLE 114 Japan Consumer Beverage Packaging Market Value (US$ Mn) & Volume (Tonnes), By Application 2012-2017
TABLE 115 Japan Consumer Beverage Packaging Market Value (US$ Mn) & Volume (Tonnes), By Application 2018-2026
TABLE 116 APEJ Consumer Beverage Packaging Market Value (US$ Mn) & Volume (Tonnes), By Country 2012-2017
TABLE 117 APEJ Consumer Beverage Packaging Market Value (US$ Mn) & Volume (Tonnes), By Country 2018-2026
TABLE 118 APEJ Consumer Beverage Packaging Market Value (US$ Mn) & Volume (Tonnes), By Packaging Material 2012-2017
TABLE 119 APEJ Consumer Beverage Packaging Market Value (US$ Mn) & Volume (Tonnes), By Packaging Material 2018-2026
TABLE 120 APEJ Consumer Beverage Packaging Market Value (US$ Mn) & Volume (Tonnes), By Packaging Type 2012-2017
TABLE 121 APEJ Consumer Beverage Packaging Market Value (US$ Mn) & Volume (Tonnes), By Packaging Type 2018-2026
TABLE 122 APEJ Consumer Beverage Packaging Market Value (US$ Mn) & Volume (Tonnes), By Application 2012-2017
TABLE 123 APEJ Consumer Beverage Packaging Market Value (US$ Mn) & Volume (Tonnes), By Application 2018-2026
TABLE 124 MEA Consumer Beverage Packaging Market Value (US$ Mn) & Volume (Tonnes), By Country 2012-2017
TABLE 125 MEA Consumer Beverage Packaging Market Value (US$ Mn) & Volume (Tonnes), By Country 2018-2026
TABLE 126 MEA Consumer Beverage Packaging Market Value (US$ Mn) & Volume (Tonnes), By Packaging Material 2012-2017
TABLE 127 MEA Consumer Beverage Packaging Market Value (US$ Mn) & Volume (Tonnes), By Packaging Material 2018-2026
TABLE 128 MEA Consumer Beverage Packaging Market Value (US$ Mn) & Volume (Tonnes), By Packaging Type 2012-2017
TABLE 129 MEA Consumer Beverage Packaging Market Value (US$ Mn) & Volume (Tonnes), By Packaging Type 2018-2026
TABLE 130 MEA Consumer Beverage Packaging Market Value (US$ Mn) & Volume (Tonnes), By Application 2012-2017
TABLE 131 MEA Consumer Beverage Packaging Market Value (US$ Mn) & Volume (Tonnes), By Application 2018-2026
List of Figures
FIG. 1 Global Consumer Beverage Packaging Market Value (US$ Mn), 2012-2017
FIG. 2 Global Consumer Beverage Packaging Market Value (US$ Mn) Forecast, 2018-2026
FIG. 3 Global Consumer Beverage Packaging Market Value (US$ Mn) and Y-o-Y, 2017-2026
FIG. 4 Global Paper & Paperboard Segment Market Value (US$ Mn) By Region, 2012-2017
FIG. 5 Global Paper & Paperboard Segment Market Value (US$ Mn) By Region, 2018-2026
FIG. 6 Global Paper & Paperboard Segment Y-o-Y Growth Rate, By Region, 2017-2026
FIG. 7 Global Plastic Segment Market Value (US$ Mn) By Region, 2012-2017
FIG. 8 Global Plastic Segment Market Value (US$ Mn) By Region, 2018-2026
FIG. 9 Global Plastic Segment Y-o-Y Growth Rate, By Region, 2017-2026
FIG. 10 Global Metal Segment Market Value (US$ Mn) By Region, 2012-2017
FIG. 11 Global Metal Segment Market Value (US$ Mn) By Region, 2018-2026
FIG. 12 Global Metal Segment Y-o-Y Growth Rate, By Region, 2017-2026
FIG. 13 Global Other Packaging Material (Glass, wood, fiber etc.) Segment Market Value (US$ Mn) By Region, 2012-2017
FIG. 14 Global Other Packaging Material (Glass, wood, fiber etc.) Segment Market Value (US$ Mn) By Region, 2018-2026
FIG. 15 Global Other Packaging Material (Glass, wood, fiber etc.) Segment Y-o-Y Growth Rate, By Region, 2017-2026
FIG. 16 Global Boxes & Cartons Segment Market Value (US$ Mn) By Region, 2012-2017
FIG. 17 Global Boxes & Cartons Segment Market Value (US$ Mn) By Region, 2018-2026
FIG. 18 Global Boxes & Cartons Segment Y-o-Y Growth Rate, By Region, 2017-2026
FIG. 19 Global Bags & Pouches Segment Market Value (US$ Mn) By Region, 2012-2017
FIG. 20 Global Bags & Pouches Segment Market Value (US$ Mn) By Region, 2018-2026
FIG. 21 Global Bags & Pouches Segment Y-o-Y Growth Rate, By Region, 2017-2026
FIG. 22 Global Containers (plastic containers, metal cans) Segment Market Value (US$ Mn) By Region, 2012-2017
FIG. 23 Global Containers (plastic containers, metal cans) Segment Market Value (US$ Mn) By Region, 2018-2026
FIG. 24 Global Containers (plastic containers, metal cans) Segment Y-o-Y Growth Rate, By Region, 2017-2026
FIG. 25 Global Bottles & Jars Segment Market Value (US$ Mn) By Region, 2012-2017
FIG. 26 Global Bottles & Jars Segment Market Value (US$ Mn) By Region, 2018-2026
FIG. 27 Global Bottles & Jars Segment Y-o-Y Growth Rate, By Region, 2017-2026
FIG. 28 Global Others (Cups, Tubs, Bowls etc.) Segment Market Value (US$ Mn) By Region, 2012-2017
FIG. 29 Global Others (Cups, Tubs, Bowls etc.) Segment Market Value (US$ Mn) By Region, 2018-2026
FIG. 30 Global Others (Cups, Tubs, Bowls etc.) Segment Y-o-Y Growth Rate, By Region, 2017-2026
FIG. 31 Global Alcoholic Beverages Segment Market Value (US$ Mn) By Region, 2012-2017
FIG. 32 Global Alcoholic Beverages Segment Market Value (US$ Mn) By Region, 2018-2026
FIG. 33 Global Alcoholic Beverages Segment Y-o-Y Growth Rate, By Region, 2017-2026
FIG. 34 Global Carbonated Soft Drinks Segment Market Value (US$ Mn) By Region, 2012-2017
FIG. 35 Global Carbonated Soft Drinks Segment Market Value (US$ Mn) By Region, 2018-2026
FIG. 36 Global Carbonated Soft Drinks Segment Y-o-Y Growth Rate, By Region, 2017-2026
FIG. 37 Global Bottled Water Segment Market Value (US$ Mn) By Region, 2012-2017
FIG. 38 Global Bottled Water Segment Market Value (US$ Mn) By Region, 2018-2026
FIG. 39 Global Bottled Water Segment Y-o-Y Growth Rate, By Region, 2017-2026
FIG. 40 Global Ready to Drink Beverages Segment Market Value (US$ Mn) By Region, 2012-2017
FIG. 41 Global Ready to Drink Beverages Segment Market Value (US$ Mn) By Region, 2018-2026
FIG. 42 Global Ready to Drink Beverages Segment Y-o-Y Growth Rate, By Region, 2017-2026
FIG. 43 Global Energy Drink Segment Market Value (US$ Mn) By Region, 2012-2017
FIG. 44 Global Energy Drink Segment Market Value (US$ Mn) By Region, 2018-2026
FIG. 45 Global Energy Drink Segment Y-o-Y Growth Rate, By Region, 2017-2026
FIG. 46 Global Tea/Coffee Segment Market Value (US$ Mn) By Region, 2012-2017
FIG. 47 Global Tea/Coffee Segment Market Value (US$ Mn) By Region, 2018-2026
FIG. 48 Global Tea/Coffee Segment Y-o-Y Growth Rate, By Region, 2017-2026
FIG. 49 Global Milk Products Segment Market Value (US$ Mn) By Region, 2012-2017
FIG. 50 Global Milk Products Segment Market Value (US$ Mn) By Region, 2018-2026
FIG. 51 Global Milk Products Segment Y-o-Y Growth Rate, By Region, 2017-2026
FIG. 52 North America Consumer Beverage Packaging Market Value (US$ Mn), By Country 2012-2017
FIG. 53 North America Consumer Beverage Packaging Market Value (US$ Mn), By Country 2018-2026
FIG. 54 North America Consumer Beverage Packaging Market Value (US$ Mn), By Packaging Material 2012-2017
FIG. 55 North America Consumer Beverage Packaging Market Value (US$ Mn), By Packaging Material 2018-2026
FIG. 56 North America Consumer Beverage Packaging Market Value (US$ Mn), By Packaging Type 2012-2017
FIG. 57 North America Consumer Beverage Packaging Market Value (US$ Mn), By Packaging Type 2018-2026
FIG. 58 North America Consumer Beverage Packaging Market Value (US$ Mn), By Application 2012-2017
FIG. 59 North America Consumer Beverage Packaging Market Value (US$ Mn), By Application 2018-2026
FIG. 60 Latin America Consumer Beverage Packaging Market Value (US$ Mn), By Country 2012-2017
FIG. 61 Latin America Consumer Beverage Packaging Market Value (US$ Mn), By Country 2018-2026
FIG. 62 Latin America Consumer Beverage Packaging Market Value (US$ Mn), By Packaging Material 2012-2017
FIG. 63 Latin America Consumer Beverage Packaging Market Value (US$ Mn), By Packaging Material 2018-2026
FIG. 64 Latin America Consumer Beverage Packaging Market Value (US$ Mn), By Packaging Type 2012-2017
FIG. 65 Latin America Consumer Beverage Packaging Market Value (US$ Mn), By Packaging Type 2018-2026
FIG. 66 Latin America Consumer Beverage Packaging Market Value (US$ Mn), By Application 2012-2017
FIG. 67 Latin America Consumer Beverage Packaging Market Value (US$ Mn), By Application 2018-2026
FIG. 68 Europe Consumer Beverage Packaging Market Value (US$ Mn), By Country 2012-2017
FIG. 69 Europe Consumer Beverage Packaging Market Value (US$ Mn), By Country 2018-2026
FIG. 70 Europe Consumer Beverage Packaging Market Value (US$ Mn), By Packaging Material 2012-2017
FIG. 71 Europe Consumer Beverage Packaging Market Value (US$ Mn), By Packaging Material 2018-2026
FIG. 72 Europe Consumer Beverage Packaging Market Value (US$ Mn), By Packaging Type 2012-2017
FIG. 73 Europe Consumer Beverage Packaging Market Value (US$ Mn), By Packaging Type 2018-2026
FIG. 74 Europe Consumer Beverage Packaging Market Value (US$ Mn), By Application 2012-2017
FIG. 75 Europe Consumer Beverage Packaging Market Value (US$ Mn), By Application 2018-2026
FIG. 76 Japan Consumer Beverage Packaging Market Value (US$ Mn), By Country 2012-2017
FIG. 77 Japan Consumer Beverage Packaging Market Value (US$ Mn), By Country 2018-2026
FIG. 78 Japan Consumer Beverage Packaging Market Value (US$ Mn), By Packaging Material 2012-2017
FIG. 79 Japan Consumer Beverage Packaging Market Value (US$ Mn), By Packaging Material 2018-2026
FIG. 80 Japan Consumer Beverage Packaging Market Value (US$ Mn), By Application 2012-2017
FIG. 81 Japan Consumer Beverage Packaging Market Value (US$ Mn), By Packaging Type 2018-2026
FIG. 82 Japan Consumer Beverage Packaging Market Value (US$ Mn), By Application 2012-2017
FIG. 83 Japan Consumer Beverage Packaging Market Value (US$ Mn), By Application 2018-2026
FIG. 84 APEJ Consumer Beverage Packaging Market Value (US$ Mn), By Country 2012-2017
FIG. 85 APEJ Consumer Beverage Packaging Market Value (US$ Mn), By Country 2018-2026
FIG. 86 APEJ Consumer Beverage Packaging Market Value (US$ Mn), By Packaging Material 2012-2017
FIG. 87 APEJ Consumer Beverage Packaging Market Value (US$ Mn), By Packaging Material 2018-2026
FIG. 88 APEJ Consumer Beverage Packaging Market Value (US$ Mn), By Packaging Type 2012-2017
FIG. 89 APEJ Consumer Beverage Packaging Market Value (US$ Mn), By Packaging Type 2018-2026
FIG. 90 APEJ Consumer Beverage Packaging Market Value (US$ Mn), By Application 2012-2017
FIG. 91 APEJ Consumer Beverage Packaging Market Value (US$ Mn), By Application 2018-2026
FIG. 92 MEA Consumer Beverage Packaging Market Value (US$ Mn), By Country 2012-2017
FIG. 93 MEA Consumer Beverage Packaging Market Value (US$ Mn), By Country 2018-2026
FIG. 94 MEA Consumer Beverage Packaging Market Value (US$ Mn), By Packaging Material 2012-2017
FIG. 95 MEA Consumer Beverage Packaging Market Value (US$ Mn), By Packaging Material 2018-2026
FIG. 96 MEA Consumer Beverage Packaging Market Value (US$ Mn), By Packaging Type 2012-2017
FIG. 97 MEA Consumer Beverage Packaging Market Value (US$ Mn), By Packaging Type 2018-2026
FIG. 98 MEA Consumer Beverage Packaging Market Value (US$ Mn), By Application 2012-2017
FIG. 99 MEA Consumer Beverage Packaging Market Value (US$ Mn), By Application 2018-2026
Copyright © Transparency Market Research, Inc. All Rights reserved
Trust Online

Consumer Beverage Packaging Market Growth, Forecast 2026