
Reports
Reports
Analysts’ Viewpoint on Connected Car Devices Market Scenario
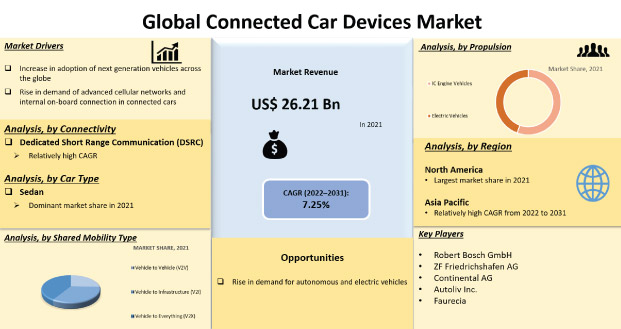
The global connected car devices market is significantly driven by an increase in sales and production of cars across the globe, rise in technological safety features in cars, and growing demand for car infotainment and telematics systems. Moreover, increase in penetration of ADAS (advance driver assistance systems) features for vehicle safety and comfort and surge in collaborative agreements among OEMs and service providers have propelled the connected car devices market. Additionally, government support programs for connected vehicles and infrastructure development across the globe are expected to contribute to the market growth during the forecast period.
The connected car is a system that connects with nearby vehicles, infrastructure, and devices with the help of wireless and cellular networks. Internet of Things (IoT) plays an important role for connected vehicles, as it guides the vehicle devices to create bi-directional communication with several other vehicles on the road and with the driver’s mobile. One of the primary requirements of the connected car system is safety. Connected car technology allows automotive V2X communication, which is also known as vehicle-to-vehicle, or vehicle-to-infrastructure, or vehicle-to-everything communications. Moreover, several active trials are in progress across the globe for connected car solutions. For instance, connected vehicle technology is used as one of the Safety Trends in Traffic Management and is considered a government initiative for Intelligent Transportation Systems, which further helps provide traffic-related information to traffic management departments and drivers on the same road.
Emerging connected car software development services and the incorporation of LTE and 5G networks for car connectivity, offering real-time traffic and safety information, can further optimize vehicle performance and save travel time. However, global connected car devices market is driven by rise in penetration of telecommunication services in the automotive sector, strong competition among connected car manufacturers, several government regulations, and industry compliance supporting automobile connectivity.
Connected vehicles use city infrastructure and smartphones for sharing significant information and on-road events. Such information may include intersection events and city traffic, which continuously send and receive data in real-time for triggering automated vehicle response to avoid further traffic blocks. Connected cars can talk with each other using in-vehicle devices that endlessly share mobility and imperative safety information. Moreover, connected car system also uses wireless communication solutions to communicat with traffic signals, toll booths, school and work zones, and other infrastructure types. However, such vehicle data is anonymous, which restricts it from vehicle tracking and secures the system against data tampering.
Analysis of connected car trends indicate an increase in demand for ADAS features among consumers, which is prompting connected car manufacturers to integrate IoT solutions and devices for high-speed automotive V2X communications. This is for driving the integration of several connected car services including, adaptive cruise control, automatic route planning, vehicle redirection due to traffic congestion, automatic vehicle braking to prevent collisions, and autonomous and semi-autonomous vehicle control, among others. However, such technological upgrade in vehicles is driving the demand for next generation vehicles and further boosting the connected car devices market size.
Rise in demand for long-distance vehicle data transfer fuels the demand for advanced cellular network, while most of the connected car manufacturers are adopting the latest and upcoming 5G network to transmit and receive vehicle data. Such network enables drivers and other users to communicate with infrastructure and vehicles in real-time, which further enhances the vehicle safety and performance. For example, two opposite-direction cars share road and traffic conditions based on their recently visited locations, which will prevent roadblocks, collisions, and accidents. Connected cars are designed to connect with the driver’s or passenger’s smartphone. Connected cars can be turned on and off with the help of smartphones; they can also share diagnostic vehicle data and remind the car owner about different upcoming service requirements in a car and share car location, in case of a stolen car. These internal onboard features are anticipated to boost the connected car devices market.
In terms of technology, the connected car devices market has been classified into Advance Driver Assistance Systems (ADAS), telematics, and others. The Advance Driver Assistance Systems (ADAS) segment accounted for a dominant share of the connected car devices market in 2021, owing to an increase in awareness about vehicle safety, rise in disposable income, surge in spending capacity of consumers, rapid urbanization, and growth in traffic congestion.
In terms of connectivity, the global connected car devices market has been divided into dedicated short range communication (DSRC), cellular networks, and others. The dedicated short range communication or DSRC segment held major share of the global market in 2021, as it allows cars in the intelligent transportation system (ITS) to communicate with other on-road cars or with city infrastructure. DSRC technology operates on the radio frequency of 5.9 GHz bandwidth and it is much more effective, hence extensively used for short to medium distance communications. DSRC has very little interference, due to high reliability and low latency. It is also considered to be more secure and supports interoperability in extreme weather conditions.
North America held a dominant share of the global connected car devices market owing to the focus on development of connected and autonomous cars by several automakers and government agencies across North America. For Instance, the U.S. DOT (department of transportation) is aggressively engaged in the deployment of automotive V2X (vehicle to everything) communication, which further provides efficiency and safety benefits for cars. Ongoing smart city projects across North America are aimed to creating connected infrastructures, which is estimated to further enable vehicle communications and consequently, boost the connected car device market. Furthermore, the market in Europe is also anticipated to witness significant growth due to rise in government projects and investments by service providers. For instance, the European Union has also initiated the 5G-CORAL project under its Horizon program, where Azcom is focused on the development of automotive V2X capabilities, which in turn is propelling the market in the region.
The global connected car devices market comprises several small and large-scale companies that control majority of the share. Most firms are adopting new technologies and strategies with comprehensive R&D in connected car devices. However, mergers and acquisitions and development in product portfolios by manufacturers and service providers are major strategies implemented by several key players. Moreover, some of the connected car devices companies operating in the global market are Robert Bosch GmbH, ZF Friedrichshafen AG, Continental AG, Autoliv Inc., Faurecia, Delphi Technologies PLC, Azcom, DENSO Corporation, Valeo SA, Harman International Industries Inc., TE Connectivity, and WiTricity Corporation.
Each of these players has been profiled in the connected car devices market report based on parameters such as company overview, financial overview, business strategies, product portfolio, business segments, and recent developments.
|
Attribute |
Detail |
|
Market Size Value in 2021 |
US$ 26.21 Bn |
|
Market Forecast Value in 2031 |
US$ 52.78 Bn |
|
Growth Rate (CAGR) |
7.25% |
|
Forecast Period |
2022–2031 |
|
Historical Data Available for |
2017–2021 |
|
Quantitative Units |
US$ Bn for Value and Thousand Units for Volume |
|
Market Analysis |
It includes cross segment analysis at global as well as regional level. Furthermore, qualitative analysis includes drivers, restraints, opportunities, key trends, Porter’s Five Forces analysis, value chain analysis, and key trend analysis. |
|
Competition Landscape |
|
|
Format |
Electronic (PDF) + Excel |
|
Market Segmentation |
|
|
Regions Covered |
|
|
Countries Covered |
|
|
Companies Profiled |
|
|
Customization Scope |
Available upon request |
|
Pricing |
Available upon request |
The connected car devices market was valued at US$ 26.21 Bn in 2021.
The connected car devices market is expected to expand at a CAGR of 7.25% by 2031.
The connected car devices market is expected to reach US$ 52.78 Bn in 2031.
Increase in sales and production of cars across developed and developing countries, surge in demand for safety features, and increase in adoption of car infotainment and telematics systems.
The advance driver assistance systems (ADAS) segment accounts for 39.8% share of the connected car devices market.
North America is a highly lucrative region of the global connected car devices market.
Robert Bosch GmbH, ZF Friedrichshafen AG, Continental AG, Autoliv Inc., Faurecia, Delphi Technologies PLC, Azcom, DENSO Corporation, Valeo SA, Harman International Industries Inc., TE Connectivity, and WiTricity Corporation.
1. Executive Summary
1.1. Global Market Outlook
1.1.1. Market Size in Thousand Units, Value US$ Bn, 2017-2031
1.2. TMR Analysis and Recommendations
1.3. Competitive Dashboard Analysis
2. Market Overview
2.1. Market Coverage / Taxonomy
2.2. Market Definition / Scope / Limitations
2.3. Market Dynamics
2.3.1. Drivers
2.3.2. Restraints
2.3.3. Opportunity
2.4. Market Factor Analysis
2.4.1. Porter’s Five Force Analysis
2.4.2. SWOT Analysis
2.5. Regulatory Scenario
2.6. Key Trend Analysis
2.7. Value Chain Analysis
2.8. Cost Structure Analysis
2.9. Profit Margin Analysis
3. COVID-19 Impact Analysis – Connected Car Devices Market
4. Global Connected Car Devices Market, by Technology
4.1. Market Snapshot
4.1.1. Introduction, Definition, and Key Findings
4.1.2. Market Growth & Y-o-Y Projections
4.1.3. Base Point Share Analysis
4.2. Global Connected Car Devices Market Volume (Thousand Units), Value (US$ Bn) Analysis & Forecast, 2017-2031, by Technology
4.2.1. Advance Driver Assistance Systems (ADAS)
4.2.2. Adaptive cruise control
4.2.3. Lane departure warning
4.2.4. Blind spot detection
4.2.5. Road sign recognition
4.2.6. Park assist
4.2.7. Pedestrian detection system
4.2.8. Telematics
4.2.9. Others
5. Global Connected Car Devices Market, by Communication
5.1. Market Snapshot
5.1.1. Introduction, Definition, and Key Findings
5.1.2. Market Growth & Y-o-Y Projections
5.1.3. Base Point Share Analysis
5.2. Global Connected Car Devices Market Volume (Thousand Units), Value (US$ Bn) Analysis & Forecast, 2017-2031, by Communication
5.2.1. Vehicle to Vehicle (V2V)
5.2.2. Vehicle to Infrastructure (V2I)
5.2.3. Vehicle to Everything (V2X)
6. Global Connected Car Devices Market, by Connectivity
6.1. Market Snapshot
6.1.1. Introduction, Definition, and Key Findings
6.1.2. Market Growth & Y-o-Y Projections
6.1.3. Base Point Share Analysis
6.2. Global Connected Car Devices Market Volume (Thousand Units), Value (US$ Bn) Analysis & Forecast, 2017-2031, by Connectivity
6.2.1. Dedicated Short Range Communication (DSRC)
6.2.2. Cellular Network
6.2.3. Others
7. Global Connected Car Devices Market, by Car Type
7.1. Market Snapshot
7.1.1. Introduction, Definition, and Key Findings
7.1.2. Market Growth & Y-o-Y Projections
7.1.3. Base Point Share Analysis
7.2. Global Connected Car Devices Market Volume (Thousand Units), Value (US$ Bn) Analysis & Forecast, 2017-2031, by Car Type
7.2.1. Hatchback
7.2.2. Sedan
7.2.3. Utility Vehicles
8. Global Connected Car Devices Market, by Propulsion
8.1. Market Snapshot
8.1.1. Introduction, Definition, and Key Findings
8.1.2. Market Growth & Y-o-Y Projections
8.1.3. Base Point Share Analysis
8.2. Global Connected Car Devices Market Volume (Thousand Units), Value (US$ Bn) Analysis & Forecast, 2017-2031, by Propulsion
8.2.1. IC Engine Vehicles
8.2.1.1. Gasoline Cars
8.2.1.2. Diesel Cars
8.2.2. Electric Vehicles
8.2.2.1. Battery Electric Car
8.2.2.2. Hybrid Electric Car
9. Global Connected Car Devices Market, by Sales Channel
9.1. Market Snapshot
9.1.1. Introduction, Definition, and Key Findings
9.1.2. Market Growth & Y-o-Y Projections
9.1.3. Base Point Share Analysis
9.2. Global Connected Car Devices Market Volume (Thousand Units), Value (US$ Bn) Analysis & Forecast, 2017-2031, by Sales Channel
9.2.1. OEM
9.2.2. Aftermarket
10. Global Connected Car Devices Market, by Region
10.1. Market Snapshot
10.1.1. Introduction, Definition, and Key Findings
10.1.2. Market Growth & Y-o-Y Projections
10.1.3. Base Point Share Analysis
10.2. Global Connected Car Devices Market Volume (Thousand Units), Value (US$ Bn) Analysis & Forecast, 2017-2031, by Region
10.2.1. North America
10.2.2. Europe
10.2.3. Asia Pacific
10.2.4. Middle East & Africa
10.2.5. South America
11. North America Connected Car Devices Market
11.1. Market Snapshot
11.2. Connected Car Devices Market Volume (Thousand Units), Value (US$ Bn) Analysis & Forecast, 2017-2031, by Technology
11.2.1. Advance Driver Assistance Systems (ADAS)
11.2.2. Adaptive cruise control
11.2.3. Lane departure warning
11.2.4. Blind spot detection
11.2.5. Road sign recognition
11.2.6. Park assist
11.2.7. Pedestrian detection system
11.2.8. Telematics
11.2.9. Others
11.3. Connected Car Devices Market Volume (Thousand Units), Value (US$ Bn) Analysis & Forecast, 2017-2031, by Communication
11.3.1. Vehicle to Vehicle (V2V)
11.3.2. Vehicle to Infrastructure (V2I)
11.3.3. Vehicle to Everything (V2X)
11.4. Connected Car Devices Market Volume (Thousand Units), Value (US$ Bn) Analysis & Forecast, 2017-2031, Connectivity
11.4.1. Dedicated Short Range Communication (DSRC)
11.4.2. Cellular Network
11.4.3. Others
11.5. Connected Car Devices Market Volume (Thousand Units), Value (US$ Bn) Analysis & Forecast, 2017-2031, by Car Type
11.5.1. Hatchback
11.5.2. Sedan
11.5.3. Utility Vehicles
11.6. Connected Car Devices Market Volume (Thousand Units), Value (US$ Bn) Analysis & Forecast, 2017-2031, by Propulsion
11.6.1. IC Engine Vehicles
11.6.1.1. Gasoline Cars
11.6.1.2. Diesel Cars
11.6.2. Electric Vehicles
11.6.2.1. Battery Electric Car
11.6.2.2. Hybrid Electric Car
11.7. Connected Car Devices Market Volume (Thousand Units), Value (US$ Bn) Analysis & Forecast, 2017-2031, by Sales Channel
11.7.1. OEM
11.7.2. Aftermarket
11.8. Key Country Analysis – North America Connected Car Devices Market Size Analysis & Forecast, 2017-2031
11.8.1. U.S.
11.8.2. Canada
11.8.3. Mexico
12. Europe Connected Car Devices Market
12.1. Market Snapshot
12.2. Connected Car Devices Market Volume (Thousand Units), Value (US$ Bn) Analysis & Forecast, 2017-2031, by Technology
12.2.1. Advance Driver Assistance Systems (ADAS)
12.2.2. Adaptive cruise control
12.2.3. Lane departure warning
12.2.4. Blind spot detection
12.2.5. Road sign recognition
12.2.6. Park assist
12.2.7. Pedestrian detection system
12.2.8. Telematics
12.2.9. Others
12.3. Connected Car Devices Market Volume (Thousand Units), Value (US$ Bn) Analysis & Forecast, 2017-2031, by Communication
12.3.1. Vehicle to Vehicle (V2V)
12.3.2. Vehicle to Infrastructure (V2I)
12.3.3. Vehicle to Everything (V2X)
12.4. Connected Car Devices Market Volume (Thousand Units), Value (US$ Bn) Analysis & Forecast, 2017-2031, Connectivity
12.4.1. Dedicated Short Range Communication (DSRC)
12.4.2. Cellular Network
12.4.3. Others
12.5. Connected Car Devices Market Volume (Thousand Units), Value (US$ Bn) Analysis & Forecast, 2017-2031, by Car Type
12.5.1. Hatchback
12.5.2. Sedan
12.5.3. Utility Vehicles
12.6. Connected Car Devices Market Volume (Thousand Units), Value (US$ Bn) Analysis & Forecast, 2017-2031, by Propulsion
12.6.1. IC Engine Vehicles
12.6.1.1. Gasoline Cars
12.6.1.2. Diesel Cars
12.6.2. Electric Vehicles
12.6.2.1. Battery Electric Car
12.6.2.2. Hybrid Electric Car
12.7. Connected Car Devices Market Volume (Thousand Units), Value (US$ Bn) Analysis & Forecast, 2017-2031, by Sales Channel
12.7.1. OEM
12.7.2. Aftermarket
12.8. Key Country Analysis – Europe Connected Car Devices Market Size Analysis & Forecast, 2017-2031
12.8.1. Germany
12.8.2. U. K.
12.8.3. France
12.8.4. Italy
12.8.5. Spain
12.8.6. Nordic Countries
12.8.7. Russia & CIS
12.8.8. Rest of Europe
13. Asia Pacific Connected Car Devices Market
13.1. Market Snapshot
13.2. Connected Car Devices Market Volume (Thousand Units), Value (US$ Bn) Analysis & Forecast, 2017-2031, by Technology
13.2.1. Advance Driver Assistance Systems (ADAS)
13.2.2. Adaptive cruise control
13.2.3. Lane departure warning
13.2.4. Blind spot detection
13.2.5. Road sign recognition
13.2.6. Park assist
13.2.7. Pedestrian detection system
13.2.8. Telematics
13.2.9. Others
13.3. Connected Car Devices Market Volume (Thousand Units), Value (US$ Bn) Analysis & Forecast, 2017-2031, by Communication
13.3.1. Vehicle to Vehicle (V2V)
13.3.2. Vehicle to Infrastructure (V2I)
13.3.3. Vehicle to Everything (V2X)
13.4. Connected Car Devices Market Volume (Thousand Units), Value (US$ Bn) Analysis & Forecast, 2017-2031, Connectivity
13.4.1. Dedicated Short Range Communication (DSRC)
13.4.2. Cellular Network
13.4.3. Others
13.5. Connected Car Devices Market Volume (Thousand Units), Value (US$ Bn) Analysis & Forecast, 2017-2031, by Car Type
13.5.1. Hatchback
13.5.2. Sedan
13.5.3. Utility Vehicles
13.6. Connected Car Devices Market Volume (Thousand Units), Value (US$ Bn) Analysis & Forecast, 2017-2031, by Propulsion
13.6.1. IC Engine Vehicles
13.6.1.1. Gasoline Cars
13.6.1.2. Diesel Cars
13.6.2. Electric Vehicles
13.6.2.1. Battery Electric Car
13.6.2.2. Hybrid Electric Car
13.7. Connected Car Devices Market Volume (Thousand Units), Value (US$ Bn) Analysis & Forecast, 2017-2031, by Sales Channel
13.7.1. OEM
13.7.2. Aftermarket
13.8. Key Country Analysis – Asia Pacific Connected Car Devices Market Size Analysis & Forecast, 2017-2031
13.8.1. China
13.8.2. India
13.8.3. Japan
13.8.4. ASEAN Countries
13.8.5. South Korea
13.8.6. ANZ
13.8.7. Rest of Asia Pacific
14. Middle East & Africa Connected Car Devices Market
14.1. Market Snapshot
14.2. Connected Car Devices Market Volume (Thousand Units), Value (US$ Bn) Analysis & Forecast, 2017-2031, by Technology
14.2.1. Advance Driver Assistance Systems (ADAS)
14.2.2. Adaptive cruise control
14.2.3. Lane departure warning
14.2.4. Blind spot detection
14.2.5. Road sign recognition
14.2.6. Park assist
14.2.7. Pedestrian detection system
14.2.8. Telematics
14.2.9. Others
14.3. Connected Car Devices Market Volume (Thousand Units), Value (US$ Bn) Analysis & Forecast, 2017-2031, by Communication
14.3.1. Vehicle to Vehicle (V2V)
14.3.2. Vehicle to Infrastructure (V2I)
14.3.3. Vehicle to Everything (V2X)
14.4. Connected Car Devices Market Volume (Thousand Units), Value (US$ Bn) Analysis & Forecast, 2017-2031, Connectivity
14.4.1. Dedicated Short Range Communication (DSRC)
14.4.2. Cellular Network
14.4.3. Others
14.5. Connected Car Devices Market Volume (Thousand Units), Value (US$ Bn) Analysis & Forecast, 2017-2031, by Car Type
14.5.1. Hatchback
14.5.2. Sedan
14.5.3. Utility Vehicles
14.6. Connected Car Devices Market Volume (Thousand Units), Value (US$ Bn) Analysis & Forecast, 2017-2031, by Propulsion
14.6.1. IC Engine Vehicles
14.6.1.1. Gasoline Cars
14.6.1.2. Diesel Cars
14.6.2. Electric Vehicles
14.6.2.1. Battery Electric Car
14.6.2.2. Hybrid Electric Car
14.7. Connected Car Devices Market Volume (Thousand Units), Value (US$ Bn) Analysis & Forecast, 2017-2031, by Sales Channel
14.7.1. OEM
14.7.2. Aftermarket
14.8. Key Country Analysis – Middle East & Africa Connected Car Devices Market Size Analysis & Forecast, 2017-2031
14.8.1. GCC
14.8.2. South Africa
14.8.3. Turkey
14.8.4. Rest of Middle East & Africa
15. South America Connected Car Devices Market
15.1. Market Snapshot
15.2. Connected Car Devices Market Volume (Thousand Units), Value (US$ Bn) Analysis & Forecast, 2017-2031, by Technology
15.2.1. Advance Driver Assistance Systems (ADAS)
15.2.2. Adaptive cruise control
15.2.3. Lane departure warning
15.2.4. Blind spot detection
15.2.5. Road sign recognition
15.2.6. Park assist
15.2.7. Pedestrian detection system
15.2.8. Telematics
15.2.9. Others
15.3. Connected Car Devices Market Volume (Thousand Units), Value (US$ Bn) Analysis & Forecast, 2017-2031, by Communication
15.3.1. Vehicle to Vehicle (V2V)
15.3.2. Vehicle to Infrastructure (V2I)
15.3.3. Vehicle to Everything (V2X)
15.4. Connected Car Devices Market Volume (Thousand Units), Value (US$ Bn) Analysis & Forecast, 2017-2031, Connectivity
15.4.1. Dedicated Short Range Communication (DSRC)
15.4.2. Cellular Network
15.4.3. Others
15.5. Connected Car Devices Market Volume (Thousand Units), Value (US$ Bn) Analysis & Forecast, 2017-2031, by Car Type
15.5.1. Hatchback
15.5.2. Sedan
15.5.3. Utility Vehicles
15.6. Connected Car Devices Market Volume (Thousand Units), Value (US$ Bn) Analysis & Forecast, 2017-2031, by Propulsion
15.6.1. IC Engine Vehicles
15.6.1.1. Gasoline Cars
15.6.1.2. Diesel Cars
15.6.2. Electric Vehicles
15.6.2.1. Battery Electric Car
15.6.2.2. Hybrid Electric Car
15.7. Connected Car Devices Market Volume (Thousand Units), Value (US$ Bn) Analysis & Forecast, 2017-2031, by Sales Channel
15.7.1. OEM
15.7.2. Aftermarket
15.8. Key Country Analysis – South America Connected Car Devices Market Size Analysis & Forecast, 2017-2031
15.8.1. Brazil
15.8.2. Argentina
15.8.3. Rest of South America
16. Competitive Landscape
16.1. Company Share Analysis/ Brand Share Analysis, 2020
16.2. Company Analysis for each player (Company Overview, Company Footprints, Production Locations, Product Portfolio, Competitors & Customers, Subsidiaries & Parent Organization, Recent Developments, Financial Analysis, Profitability, Revenue Share)
17. Company Profile/ Key Players
17.1. Robert Bosch GmbH
17.1.1. Company Overview
17.1.2. Company Footprints
17.1.3. Production Locations
17.1.4. Product Portfolio
17.1.5. Competitors & Customers
17.1.6. Subsidiaries & Parent Organization
17.1.7. Recent Developments
17.1.8. Financial Analysis
17.1.9. Profitability
17.1.10. Revenue Share
17.2. ZF Friedrichshafen AG
17.2.1. Company Overview
17.2.2. Company Footprints
17.2.3. Production Locations
17.2.4. Product Portfolio
17.2.5. Competitors & Customers
17.2.6. Subsidiaries & Parent Organization
17.2.7. Recent Developments
17.2.8. Financial Analysis
17.2.9. Profitability
17.2.10. Revenue Share
17.3. Continental AG
17.3.1. Company Overview
17.3.2. Company Footprints
17.3.3. Production Locations
17.3.4. Product Portfolio
17.3.5. Competitors & Customers
17.3.6. Subsidiaries & Parent Organization
17.3.7. Recent Developments
17.3.8. Financial Analysis
17.3.9. Profitability
17.3.10. Revenue Share
17.4. Autoliv Inc.
17.4.1. Company Overview
17.4.2. Company Footprints
17.4.3. Production Locations
17.4.4. Product Portfolio
17.4.5. Competitors & Customers
17.4.6. Subsidiaries & Parent Organization
17.4.7. Recent Developments
17.4.8. Financial Analysis
17.4.9. Profitability
17.4.10. Revenue Share
17.5. Faurecia
17.5.1. Company Overview
17.5.2. Company Footprints
17.5.3. Production Locations
17.5.4. Product Portfolio
17.5.5. Competitors & Customers
17.5.6. Subsidiaries & Parent Organization
17.5.7. Recent Developments
17.5.8. Financial Analysis
17.5.9. Profitability
17.5.10. Revenue Share
17.6. Delphi Technologies PLC
17.6.1. Company Overview
17.6.2. Company Footprints
17.6.3. Production Locations
17.6.4. Product Portfolio
17.6.5. Competitors & Customers
17.6.6. Subsidiaries & Parent Organization
17.6.7. Recent Developments
17.6.8. Financial Analysis
17.6.9. Profitability
17.6.10. Revenue Share
17.7. Azcom
17.7.1. Company Overview
17.7.2. Company Footprints
17.7.3. Production Locations
17.7.4. Product Portfolio
17.7.5. Competitors & Customers
17.7.6. Subsidiaries & Parent Organization
17.7.7. Recent Developments
17.7.8. Financial Analysis
17.7.9. Profitability
17.7.10. Revenue Share
17.8. DENSO Corporation
17.8.1. Company Overview
17.8.2. Company Footprints
17.8.3. Production Locations
17.8.4. Product Portfolio
17.8.5. Competitors & Customers
17.8.6. Subsidiaries & Parent Organization
17.8.7. Recent Developments
17.8.8. Financial Analysis
17.8.9. Profitability
17.8.10. Revenue Share
17.9. Valeo SA
17.9.1. Company Overview
17.9.2. Company Footprints
17.9.3. Production Locations
17.9.4. Product Portfolio
17.9.5. Competitors & Customers
17.9.6. Subsidiaries & Parent Organization
17.9.7. Recent Developments
17.9.8. Financial Analysis
17.9.9. Profitability
17.9.10. Revenue Share
17.10. Harman International Industries Inc.
17.10.1. Company Overview
17.10.2. Company Footprints
17.10.3. Production Locations
17.10.4. Product Portfolio
17.10.5. Competitors & Customers
17.10.6. Subsidiaries & Parent Organization
17.10.7. Recent Developments
17.10.8. Financial Analysis
17.10.9. Profitability
17.10.10. Revenue Share
17.11. TE Connectivity
17.11.1. Company Overview
17.11.2. Company Footprints
17.11.3. Production Locations
17.11.4. Product Portfolio
17.11.5. Competitors & Customers
17.11.6. Subsidiaries & Parent Organization
17.11.7. Recent Developments
17.11.8. Financial Analysis
17.11.9. Profitability
17.11.10. Revenue Share
17.12. WiTricity Corporation
17.12.1. Company Overview
17.12.2. Company Footprints
17.12.3. Production Locations
17.12.4. Product Portfolio
17.12.5. Competitors & Customers
17.12.6. Subsidiaries & Parent Organization
17.12.7. Recent Developments
17.12.8. Financial Analysis
17.12.9. Profitability
17.12.10. Revenue Share
17.13. Other Key Players
17.13.1. Company Overview
17.13.2. Company Footprints
17.13.3. Production Locations
17.13.4. Product Portfolio
17.13.5. Competitors & Customers
17.13.6. Subsidiaries & Parent Organization
17.13.7. Recent Developments
17.13.8. Financial Analysis
17.13.9. Profitability
17.13.10. Revenue Share
18. Key Takeaways
18.1. Market Attractiveness Opportunity
18.2. Manufacturer’s Perspective
List of Tables
Table 1: Global Connected Car Devices Market Size & Forecast, Volume (Thousand Units), by Technology, 2017-2031
Table 2: Global Connected Car Devices Market Size & Forecast, Value (US$ Bn), by Technology, 2017-2031
Table 3: Global Connected Car Devices Market Size & Forecast, Volume (Thousand Units), by Communication, 2017-2031
Table 4: Global Connected Car Devices Market Size & Forecast, Value (US$ Bn), by Communication, 2017-2031
Table 5: Global Connected Car Devices Market Size & Forecast, Volume (Thousand Units), by Connectivity, 2017-2031
Table 6: Global Connected Car Devices Market Size & Forecast, Value (US$ Bn), by Connectivity, 2017-2031
Table 7: Global Connected Car Devices Market Size & Forecast, Volume (Thousand Units), by Car Type, 2017-2031
Table 8: Global Connected Car Devices Market Size & Forecast, Value (US$ Bn), by Car Type, 2017-2031
Table 9: Global Connected Car Devices Market Size & Forecast, Volume (Thousand Units), by Propulsion, 2017-2031
Table 10: Global Connected Car Devices Market Size & Forecast, Value (US$ Bn), by Propulsion, 2017-2031
Table 11: Global Connected Car Devices Market Size & Forecast, Volume (Thousand Units), by Sales Channel, 2017-2031
Table 12: Global Connected Car Devices Market Size & Forecast, Value (US$ Bn), by Sales Channel, 2017-2031
Table 13: Global Connected Car Devices Market Size & Forecast, Volume (Thousand Units), by Region, 2017-2031
Table 14: Global Connected Car Devices Market Size & Forecast, Value (US$ Bn), by Region, 2017-2031
Table 15: North America Connected Car Devices Market Size & Forecast, Volume (Thousand Units), by Technology, 2017-2031
Table 16: North America Connected Car Devices Market Size & Forecast, Value (US$ Bn), by Technology, 2017-2031
Table 17: North America Connected Car Devices Market Size & Forecast, Volume (Thousand Units), by Communication, 2017-2031
Table 18: North America Connected Car Devices Market Size & Forecast, Value (US$ Bn), by Communication, 2017-2031
Table 19: North America Connected Car Devices Market Size & Forecast, Volume (Thousand Units), by Connectivity, 2017-2031
Table 20: North America Connected Car Devices Market Size & Forecast, Value (US$ Bn), by Connectivity, 2017-2031
Table 21: North America Connected Car Devices Market Size & Forecast, Volume (Thousand Units), by Car Type, 2017-2031
Table 22: North America Connected Car Devices Market Size & Forecast, Value (US$ Bn), by Car Type, 2017-2031
Table 23: North America Connected Car Devices Market Size & Forecast, Volume (Thousand Units), by Propulsion, 2017-2031
Table 24: North America Connected Car Devices Market Size & Forecast, Value (US$ Bn), by Propulsion, 2017-2031
Table 25: North America Connected Car Devices Market Size & Forecast, Volume (Thousand Units), by Sales Channel, 2017-2031
Table 26: North America Connected Car Devices Market Size & Forecast, Value (US$ Bn), by Sales Channel, 2017-2031
Table 27: North America Connected Car Devices Market Size & Forecast, Volume (Thousand Units), by Country, 2017-2031
Table 28: North America Connected Car Devices Market Size & Forecast, Value (US$ Bn), by Country, 2017-2031
Table 29: Europe Connected Car Devices Market Size & Forecast, Volume (Thousand Units), by Technology, 2017-2031
Table 30: Europe Connected Car Devices Market Size & Forecast, Value (US$ Bn), by Technology, 2017-2031
Table 31: Europe Connected Car Devices Market Size & Forecast, Volume (Thousand Units), by Communication, 2017-2031
Table 32: Europe Connected Car Devices Market Size & Forecast, Value (US$ Bn), by Communication, 2017-2031
Table 33: Europe Connected Car Devices Market Size & Forecast, Volume (Thousand Units), by Connectivity, 2017-2031
Table 34: Europe Connected Car Devices Market Size & Forecast, Value (US$ Bn), by Connectivity, 2017-2031
Table 35: Europe Connected Car Devices Market Size & Forecast, Volume (Thousand Units), by Car Type, 2017-2031
Table 36: Europe Connected Car Devices Market Size & Forecast, Value (US$ Bn), by Car Type, 2017-2031
Table 37: Europe Connected Car Devices Market Size & Forecast, Volume (Thousand Units), by Propulsion, 2017-2031
Table 38: Europe Connected Car Devices Market Size & Forecast, Value (US$ Bn), by Propulsion, 2017-2031
Table 39: Europe Connected Car Devices Market Size & Forecast, Volume (Thousand Units), by Sales Channel, 2017-2031
Table 40: Europe Connected Car Devices Market Size & Forecast, Value (US$ Bn), by Sales Channel, 2017-2031
Table 41: Europe Connected Car Devices Market Size & Forecast, Volume (Thousand Units), by Country, 2017-2031
Table 42: Europe Connected Car Devices Market Size & Forecast, Value (US$ Bn), by Country, 2017-2031
Table 43: Asia Pacific Connected Car Devices Market Size & Forecast, Volume (Thousand Units), by Technology, 2017-2031
Table 44: Asia Pacific Connected Car Devices Market Size & Forecast, Value (US$ Bn), by Technology, 2017-2031
Table 45: Asia Pacific Connected Car Devices Market Size & Forecast, Volume (Thousand Units), by Communication, 2017-2031
Table 46: Asia Pacific Connected Car Devices Market Size & Forecast, Value (US$ Bn), by Communication, 2017-2031
Table 47: Asia Pacific Connected Car Devices Market Size & Forecast, Volume (Thousand Units), by Connectivity, 2017-2031
Table 48: Asia Pacific Connected Car Devices Market Size & Forecast, Value (US$ Bn), by Connectivity, 2017-2031
Table 49: Asia Pacific Connected Car Devices Market Size & Forecast, Volume (Thousand Units), by Car Type, 2017-2031
Table 50: Asia Pacific Connected Car Devices Market Size & Forecast, Value (US$ Bn), by Car Type, 2017-2031
Table 51: Asia Pacific Connected Car Devices Market Size & Forecast, Volume (Thousand Units), by Propulsion, 2017-2031
Table 52: Asia Pacific Connected Car Devices Market Size & Forecast, Value (US$ Bn), by Propulsion, 2017-2031
Table 53: Asia Pacific Connected Car Devices Market Size & Forecast, Volume (Thousand Units), by Sales Channel, 2017-2031
Table 54: Asia Pacific Connected Car Devices Market Size & Forecast, Value (US$ Bn), by Sales Channel, 2017-2031
Table 55: Asia Pacific Connected Car Devices Market Size & Forecast, Volume (Thousand Units), by Country, 2017-2031
Table 56: Asia Pacific Connected Car Devices Market Size & Forecast, Value (US$ Bn), by Country, 2017-2031
Table 57: Middle East & Africa Connected Car Devices Market Size & Forecast, Volume (Thousand Units), by Technology, 2017-2031
Table 58: Middle East & Africa Connected Car Devices Market Size & Forecast, Value (US$ Bn), by Technology, 2017-2031
Table 59: Middle East & Africa Connected Car Devices Market Size & Forecast, Volume (Thousand Units), by Communication, 2017-2031
Table 60: Middle East & Africa Connected Car Devices Market Size & Forecast, Value (US$ Bn), by Communication, 2017-2031
Table 61: Middle East & Africa Connected Car Devices Market Size & Forecast, Volume (Thousand Units), by Connectivity, 2017-2031
Table 62: Middle East & Africa Connected Car Devices Market Size & Forecast, Value (US$ Bn), by Connectivity, 2017-2031
Table 63: Middle East & Africa Connected Car Devices Market Size & Forecast, Volume (Thousand Units), by Car Type, 2017-2031
Table 64: Middle East & Africa Connected Car Devices Market Size & Forecast, Value (US$ Bn), by Car Type, 2017-2031
Table 65: Middle East & Africa Connected Car Devices Market Size & Forecast, Volume (Thousand Units), by Propulsion, 2017-2031
Table 66: Middle East & Africa Connected Car Devices Market Size & Forecast, Value (US$ Bn), by Propulsion, 2017-2031
Table 67: Middle East & Africa Connected Car Devices Market Size & Forecast, Volume (Thousand Units), by Sales Channel, 2017-2031
Table 68: Middle East & Africa Connected Car Devices Market Size & Forecast, Value (US$ Bn), by Sales Channel, 2017-2031
Table 69: Middle East & Africa Connected Car Devices Market Size & Forecast, Volume (Thousand Units), by Country, 2017-2031
Table 70: Middle East & Africa Connected Car Devices Market Size & Forecast, Value (US$ Bn), by Country, 2017-2031
Table 71: South America Connected Car Devices Market Size & Forecast, Volume (Thousand Units), by Technology, 2017-2031
Table 72: South America Connected Car Devices Market Size & Forecast, Value (US$ Bn), by Technology, 2017-2031
Table 73: South America Connected Car Devices Market Size & Forecast, Volume (Thousand Units), by Communication, 2017-2031
Table 74: South America Connected Car Devices Market Size & Forecast, Value (US$ Bn), by Communication, 2017-2031
Table 75: South America Connected Car Devices Market Size & Forecast, Volume (Thousand Units), by Connectivity, 2017-2031
Table 76: South America Connected Car Devices Market Size & Forecast, Value (US$ Bn), by Connectivity, 2017-2031
Table 77: South America Connected Car Devices Market Size & Forecast, Volume (Thousand Units), by Car Type, 2017-2031
Table 78: South America Connected Car Devices Market Size & Forecast, Value (US$ Bn), by Car Type, 2017-2031
Table 79: South America Connected Car Devices Market Size & Forecast, Volume (Thousand Units), by Propulsion, 2017-2031
Table 80: South America Connected Car Devices Market Size & Forecast, Value (US$ Bn), by Propulsion, 2017-2031
Table 81: South America Connected Car Devices Market Size & Forecast, Volume (Thousand Units), by Sales Channel, 2017-2031
Table 82: South America Connected Car Devices Market Size & Forecast, Value (US$ Bn), by Sales Channel, 2017-2031
Table 83: South America Connected Car Devices Market Size & Forecast, Volume (Thousand Units), by Country, 2017-2031
Table 84: South America Connected Car Devices Market Size & Forecast, Value (US$ Bn), by Country, 2017-2031
List of Figures
Figure 1: Global Connected Car Devices Market Volume (Thousand Units) Forecast, 2017–2031
Figure 2: Global Connected Car Devices Market Value (US$ Bn) Forecast, 2017–2031
Figure 3: Key Segment Analysis for Global
Figure 4: Global Connected Car Devices Market Size & Forecast, Value (US$ Bn), 2017-2031
Figure 5: Global Connected Car Devices Market Size & Forecast, Value (US$ Bn), by Technology, 2017-2031
Figure 6: Global Market Attractiveness, Value (US$ Bn), by Technology, 2022-2031
Figure 7: Global Connected Car Devices Market Size & Forecast, Value (US$ Bn), by Communication, 2017-2031
Figure 8: Global Market Attractiveness, Value (US$ Bn), by Communication, 2022-2031
Figure 9: Global Connected Car Devices Market Size & Forecast, Value (US$ Bn), by Connectivity, 2017-2031
Figure 10: Global Market Attractiveness, Value (US$ Bn), by Connectivity, 2022-2031
Figure 11: Global Connected Car Devices Market Size & Forecast, Value (US$ Bn), by Car Type, 2017-2031
Figure 12: Global Market Attractiveness, Value (US$ Bn), by Car Type, 2022-2031
Figure 13: Global Connected Car Devices Market Size & Forecast, Value (US$ Bn), by Propulsion, 2017-2031
Figure 14: Global Market Attractiveness, Value (US$ Bn), by Propulsion, 2022-2031
Figure 15: Global Connected Car Devices Market Size & Forecast, Value (US$ Bn), by Sales Channel, 2017-2031
Figure 16: Global Market Attractiveness, Value (US$ Bn), by Sales Channel, 2022-2031
Figure 17: Global Connected Car Devices Market Size & Forecast, Value (US$ Bn), by Region, 2017-2031
Figure 18: Global Market Attractiveness, Value (US$ Bn), by Region, 2022-2031
Figure 19: North America Connected Car Devices Market Size & Forecast, Value (US$ Bn), by Technology, 2017-2031
Figure 20: North America Market Attractiveness, Value (US$ Bn), by Technology, 2022-2031
Figure 21: North America Connected Car Devices Market Size & Forecast, Value (US$ Bn), by Communication, 2017-2031
Figure 22: North America Market Attractiveness, Value (US$ Bn), by Communication, 2022-2031
Figure 23: North America Connected Car Devices Market Size & Forecast, Value (US$ Bn), by Connectivity, 2017-2031
Figure 24: North America Market Attractiveness, Value (US$ Bn), by Connectivity, 2022-2031
Figure 25: North America Connected Car Devices Market Size & Forecast, Value (US$ Bn), by Car Type, 2017-2031
Figure 26: North America Market Attractiveness, Value (US$ Bn), by Car Type, 2022-2031
Figure 27: North America Connected Car Devices Market Size & Forecast, Value (US$ Bn), by Propulsion, 2017-2031
Figure 28: North America Market Attractiveness, Value (US$ Bn), by Propulsion, 2022-2031
Figure 29: North America Connected Car Devices Market Size & Forecast, Value (US$ Bn), by Sales Channel, 2017-2031
Figure 30: North America Market Attractiveness, Value (US$ Bn), by Sales Channel, 2022-2031
Figure 31: North America Connected Car Devices Market Size & Forecast, Value (US$ Bn), by Country, 2017-2031
Figure 32: North America Market Attractiveness, Value (US$ Bn), by Country, 2022-2031
Figure 33: Europe Connected Car Devices Market Size & Forecast, Value (US$ Bn), by Technology, 2017-2031
Figure 34: Europe Market Attractiveness, Value (US$ Bn), by Technology, 2022-2031
Figure 35: Europe Connected Car Devices Market Size & Forecast, Value (US$ Bn), by Communication, 2017-2031
Figure 36: Europe Market Attractiveness, Value (US$ Bn), by Communication, 2022-2031
Figure 37: Europe Connected Car Devices Market Size & Forecast, Value (US$ Bn), by Connectivity, 2017-2031
Figure 38: Europe Market Attractiveness, Value (US$ Bn), by Connectivity, 2022-2031
Figure 39: Europe Connected Car Devices Market Size & Forecast, Value (US$ Bn), by Car Type, 2017-2031
Figure 40: Europe Market Attractiveness, Value (US$ Bn), by Car Type, 2022-2031
Figure 41: Europe Connected Car Devices Market Size & Forecast, Value (US$ Bn), by Propulsion, 2017-2031
Figure 42: Europe Market Attractiveness, Value (US$ Bn), by Propulsion, 2022-2031
Figure 43: Europe Connected Car Devices Market Size & Forecast, Value (US$ Bn), by Sales Channel, 2017-2031
Figure 44: Europe Market Attractiveness, Value (US$ Bn), by Sales Channel, 2022-2031
Figure 45: Europe Connected Car Devices Market Size & Forecast, Value (US$ Bn), by Country, 2017-2031
Figure 46: Europe Market Attractiveness, Value (US$ Bn), by Country, 2022-2031
Figure 47: Asia Pacific Connected Car Devices Market Size & Forecast, Value (US$ Bn), by Technology, 2017-2031
Figure 48: Asia Pacific Market Attractiveness, Value (US$ Bn), by Technology, 2022-2031
Figure 49: Asia Pacific Connected Car Devices Market Size & Forecast, Value (US$ Bn), by Communication, 2017-2031
Figure 50: Asia Pacific Market Attractiveness, Value (US$ Bn), by Communication, 2022-2031
Figure 51: Asia Pacific Connected Car Devices Market Size & Forecast, Value (US$ Bn), by Connectivity, 2017-2031
Figure 52: Asia Pacific Market Attractiveness, Value (US$ Bn), by Connectivity, 2022-2031
Figure 53: Asia Pacific Connected Car Devices Market Size & Forecast, Value (US$ Bn), by Car Type, 2017-2031
Figure 54: Asia Pacific Market Attractiveness, Value (US$ Bn), by Car Type, 2022-2031
Figure 55: Asia Pacific Connected Car Devices Market Size & Forecast, Value (US$ Bn), by Propulsion, 2017-2031
Figure 56: Asia Pacific Market Attractiveness, Value (US$ Bn), by Propulsion, 2022-2031
Figure 57: Asia Pacific Connected Car Devices Market Size & Forecast, Value (US$ Bn), by Sales Channel, 2017-2031
Figure 58: Asia Pacific Market Attractiveness, Value (US$ Bn), by Sales Channel, 2022-2031
Figure 59: Asia Pacific Connected Car Devices Market Size & Forecast, Value (US$ Bn), by Country, 2017-2031
Figure 60: Asia Pacific Market Attractiveness, Value (US$ Bn), by Country, 2022-2031
Figure 61: Middle East & Africa Connected Car Devices Market Size & Forecast, Value (US$ Bn), by Technology, 2017-2031
Figure 62: Middle East & Africa Market Attractiveness, Value (US$ Bn), by Technology, 2022-2031
Figure 63: Middle East & Africa Connected Car Devices Market Size & Forecast, Value (US$ Bn), by Communication, 2017-2031
Figure 64: Middle East & Africa Market Attractiveness, Value (US$ Bn), by Communication, 2022-2031
Figure 65: Middle East & Africa Connected Car Devices Market Size & Forecast, Value (US$ Bn), by Connectivity, 2017-2031
Figure 66: Middle East & Africa Market Attractiveness, Value (US$ Bn), by Connectivity, 2022-2031
Figure 67: Middle East & Africa Connected Car Devices Market Size & Forecast, Value (US$ Bn), by Car Type, 2017-2031
Figure 68: Middle East & Africa Market Attractiveness, Value (US$ Bn), by Car Type, 2022-2031
Figure 69: Middle East & Africa Connected Car Devices Market Size & Forecast, Value (US$ Bn), by Propulsion, 2017-2031
Figure 70: Middle East & Africa Market Attractiveness, Value (US$ Bn), by Propulsion, 2022-2031
Figure 71: Middle East & Africa Connected Car Devices Market Size & Forecast, Value (US$ Bn), by Sales Channel, 2017-2031
Figure 72: Middle East & Africa Market Attractiveness, Value (US$ Bn), by Sales Channel, 2022-2031
Figure 73: Middle East & Africa Connected Car Devices Market Size & Forecast, Value (US$ Bn), by Country, 2017-2031
Figure 74: Middle East & Africa Market Attractiveness, Value (US$ Bn), by Country, 2022-2031
Figure 75: South America Connected Car Devices Market Size & Forecast, Value (US$ Bn), by Technology, 2017-2031
Figure 76: South America Market Attractiveness, Value (US$ Bn), by Technology, 2022-2031
Figure 77: South America Connected Car Devices Market Size & Forecast, Value (US$ Bn), by Communication, 2017-2031
Figure 78: South America Market Attractiveness, Value (US$ Bn), by Communication, 2022-2031
Figure 79: South America Connected Car Devices Market Size & Forecast, Value (US$ Bn), by Connectivity, 2017-2031
Figure 80: South America Market Attractiveness, Value (US$ Bn), by Connectivity, 2022-2031
Figure 81: South America Connected Car Devices Market Size & Forecast, Value (US$ Bn), by Car Type, 2017-2031
Figure 82: South America Market Attractiveness, Value (US$ Bn), by Car Type, 2022-2031
Figure 83: South America Connected Car Devices Market Size & Forecast, Value (US$ Bn), by Propulsion, 2017-2031
Figure 84: South America Market Attractiveness, Value (US$ Bn), by Propulsion, 2022-2031
Figure 85: South America Connected Car Devices Market Size & Forecast, Value (US$ Bn), by Sales Channel, 2017-2031
Figure 86: South America Market Attractiveness, Value (US$ Bn), by Sales Channel, 2022-2031
Figure 87: South America Connected Car Devices Market Size & Forecast, Value (US$ Bn), by Country, 2017-2031
Figure 88: South America Market Attractiveness, Value (US$ Bn), by Country, 2022-2031
Copyright © Transparency Market Research, Inc. All Rights reserved
Trust Online

Connected Car Devices Market