
Reports
Reports
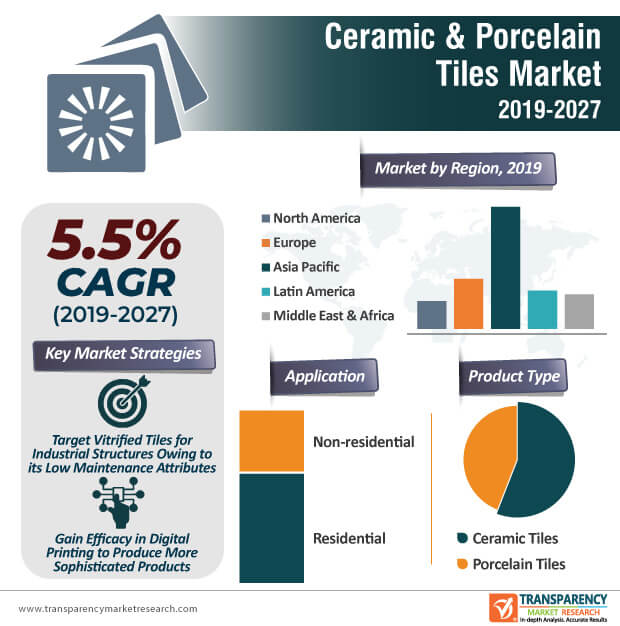
Advanced digital printing is transforming the ceramic & porcelain tiles market. With the help of digital printing, manufacturers are able to produce more sophisticated products that meet consumer requirements. The evolution of the printing technology has encouraged manufacturers to develop products with unique designs, patterns, and vibrant colors that meet aesthetic needs of end users. Such innovations are boosting the growth of the ceramic & porcelain tiles market, which is anticipated to reach a revenue of ~US$ 79 Bn by the end of 2027.
The authenticity in design has become one of the key focus points for companies in the market landscape. Hence, manufacturers in the market for ceramic & porcelain tiles are collaborating with graphic designers to design tiles in Photoshop. Replicating looks of natural stone or wood onto the surface of ceramic & porcelain tiles with the help of designing software is becoming increasingly commonplace to gain a competitive edge over other players in the market.
Cooling Ceramic Tiles Cater to Air Conditioning Cost Savings in a Sustainable Way
Manufacturers in the ceramic & porcelain tiles market are developing ceramic tiles that cool indoor temperatures of buildings. For instance, China Ceramics— a provider of ceramic tiles in China, announced the launch of innovative exterior ceramic tiles used for cooling building interiors. This explains why the revenue of ceramic tiles is projected for aggressive growth in the market for ceramic & porcelain tiles. Hence, manufacturers are increasing efforts to fully test and certify their products in order to tap opportunities in the Southeast Asia region, since the region’s climate is usually hot and humid.
Innovative cooling ceramic tiles are being highly publicized to save air conditioning costs for end users in regions of Asia Pacific. As such, the revenue of Asia Pacific is predicted for exponential growth in the ceramic & porcelain tiles market. Cooling ceramic tiles are gaining popularity for saving air conditioning costs in a sustainable way in the market for ceramic & porcelain tiles.
Ceramic Tiles versus S Porcelain Tiles: Which is better?
The growing awareness about latest tile trends are generating revenue streams for manufacturers in the ceramic & porcelain tiles market. This is evident since the market is growing at a modest pace, due to a large number of local and regional players accounting for a market share of ~92%, who are open to experimentation with designs and patterns to meet end user needs.
Water resistance and increased availability of design options are bolstering the demand for ceramic tiles. These tiles are affordable and are being extensively used for flooring applications in damp environment. As such, the revenue of floor tiles is projected for aggressive growth in the market for ceramic & porcelain tiles. However, ceramic tiles are heavy in weight and require tough floors that can withstand the weight of the tiles while installation.
On the other hand, porcelain tiles are gaining popularity in commercial applications for withstanding high foot traffic in the ceramic & porcelain tiles market. However, any installation mistakes might lead to larger repair costs. Hence, end users are carefully weighing their decisions before choosing the right type of ceramic & porcelain tiles.
Revolutionary Porcelain Tiles Prove Cost-efficient with Easy Installation
Apart from ceramic tiles, manufacturers are increasing their production capabilities to produce porcelain tiles. They are increasing R&D activities to manufacture tiles that can be easily installed in minimum number of steps in the market for ceramic & porcelain tiles. For instance, the U.S. leader in porcelain tiles and natural stone, Daltile Group, is focused on the development of their revolutionary Revo Tile with Clic-Fit technology that helps in two times faster installation.
Companies in the ceramic & porcelain tiles market are manufacturing tiles that require minimum tools for installation. Easy-to-remove and reduced sound transmission are key advantages of these innovative tiles that are creating value-grab opportunities for companies in the ceramic & porcelain tiles market.
Analysts’ Viewpoint
The ceramic & porcelain tiles market is expected to expand at a CAGR of ~5%, in terms of volume, during the forecast period. India being one of the leading economies of Asia Pacific is creating a demand for vitrified tiles for a variety of domestic and industrial structures. High gloss surface and low maintenance of vitrified tiles are grabbing the attention of end users.
The installation of ceramic & porcelain tiles is generally a costly affair due to the requirement of skilled laborers and the need for installation tools. Hence, companies should gain expertise in technologies that deploy minimal installation steps and that cater to easy-to-remove attributes during repair works.
Ceramic & Porcelain Tiles Market: Overview
Rise in Demand for Ceramic Tiles in Residential and Non-residential Sectors
Increase in Demand for Floor Tiles in Various Applications
Increase in Demand for Ceramic & Porcelain Tiles in Residential Application
Key Regional Highlights of Ceramic & Porcelain Tiles Market
Ceramic & Porcelain Tiles Market: Competition Landscape
1. Executive Summary: Global Ceramic & Porcelain Tiles Market
1.1. Global Ceramic & Porcelain Tiles Market Volume (Million Square Meters) Forecast, 2018–2027
1.2. Global Ceramic & Porcelain Tiles Market Value (US$ Mn) Forecast, by Region, 2018–2027
2. Market Overview
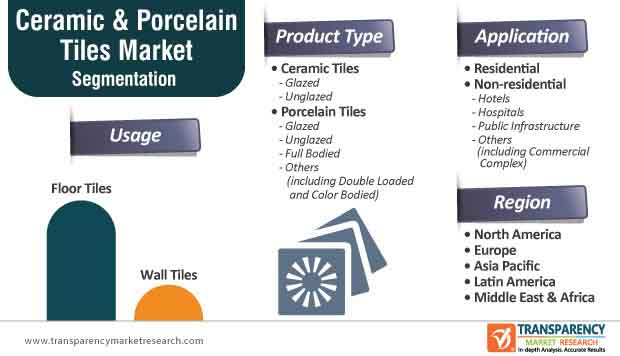
2.1. Ceramic & Porcelain Tiles: Product Type Definition
2.2. Ceramic & Porcelain Tiles: Usage Definition
2.3. Ceramic & Porcelain Tiles: Application Definition
2.4. Market Trend
2.5. Market Dynamics
2.5.1. Drivers
2.5.2. Restraints
2.5.3. Key Opportunities
2.6. Porters Five Forces Analysis
2.7. Regulations
2.8. Value Chain Analysis
2.8.1. List of Manufacturers
3. Pricing Analysis
3.1. Pricing Analysis, by Product Type
3.2. Pricing Analysis, by Country and Sub-region
4. Global Ceramic & Porcelain Tiles Market Volume (Million Square Meters) and Value (US$ Mn) Forecast, by Product Type, 2018–2027
4.1. Global Ceramic & Porcelain Tiles Market Analysis, by Product Type, 2018–2027
4.1.1. Key Findings
4.2. Global Ceramic & Porcelain Tiles Market Volume (Million Square Meters) and Value (US$ Mn) Forecast, by Product Type, 2018–2027
4.2.1. Ceramic Tiles
4.2.1.1. Glazed
4.2.1.2. Unglazed
4.2.2. Porcelain Tiles
4.2.2.1. Glazed
4.2.2.2. Unglazed
4.2.2.3. Full Bodied
4.2.2.4. Others
4.3. Global Ceramic & Porcelain Tiles Market Analysis, by Usage, 2018–2027
4.3.1. Key Findings
4.4. Global Ceramic & Porcelain Tiles Market Volume (Million Square Meters) and Value (US$ Mn) Forecast, by Usage, 2018–2027
4.4.1. Floor Tiles
4.4.2. Wall Tiles
4.5. Global Ceramic & Porcelain Tiles Market Analysis, by Application, 2018–2027
4.5.1. Key Findings
4.6. Global Ceramic & Porcelain Tiles Market Volume (Million Square Meters) and Value (US$ Mn) Forecast, by Application, 2018–2027
4.6.1. Residential
4.6.2. Non-residential
4.6.2.1. Hotels
4.6.2.2. Hospitals
4.6.2.3. Public Infrastructure
4.6.2.4. Others
5. Global Ceramic & Porcelain Tiles Market Analysis, by Region, 2018–2027
5.1. Key Findings
5.2. Global Ceramic & Porcelain Tiles Market Volume (Million Square Meters) and Value (US$ Mn) Forecast, by Region, 2018–2027
5.2.1. North America
5.2.2. Europe
5.2.3. Asia Pacific
5.2.4. Latin America
5.2.5. Middle East & Africa
5.3. Global Ceramic & Porcelain Tiles Market Attractiveness Analysis, by Region
6. North America Ceramic & Porcelain Tiles Market Analysis
6.1. Key Findings
6.2. North America Ceramic & Porcelain Tiles Market Volume (Million Square Meters) and Value (US$ Mn) Forecast, by Product Type, 2018–2027
6.2.1. Ceramic Tiles
6.2.1.1. Glazed
6.2.1.2. Unglazed
6.2.2. Porcelain Tiles
6.2.2.1. Glazed
6.2.2.2. Unglazed
6.2.2.3. Full Bodied
6.2.2.4. Others
6.3. North America Ceramic & Porcelain Tiles Market Volume (Million Square Meters) and Value (US$ Mn) Forecast, by Usage, 2018–2027
6.3.1. Floor Tiles
6.3.2. Wall Tiles
6.4. North America Ceramic & Porcelain Tiles Market Volume (Million Square Meters) and Value (US$ Mn) Forecast, by Application, 2018–2027
6.4.1. Residential
6.4.2. Non-residential
6.4.2.1. Hotels
6.4.2.2. Hospitals
6.4.2.3. Public Infrastructure
6.4.2.4. Others
6.5. North America Ceramic & Porcelain Tiles Market Volume (Million Square Meters) and Value (US$ Mn) Forecast, by Country, 2018–2027
6.6. U.S. Ceramic & Porcelain Tiles Market Volume (Million Square Meters) and Value (US$ Mn) Forecast, by Product Type, 2018–2027
6.6.1. Ceramic Tiles
6.6.1.1. Glazed
6.6.1.2. Unglazed
6.6.2. Porcelain Tiles
6.6.2.1. Glazed
6.6.2.2. Unglazed
6.6.2.3. Full Bodied
6.6.2.4. Others
6.7. U.S. Ceramic & Porcelain Tiles Market Volume (Million Square Meters) and Value (US$ Mn) Forecast, by Usage, 2018–2027
6.7.1. Floor Tiles
6.7.2. Wall Tiles
6.8. U.S. Ceramic & Porcelain Tiles Market Volume (Million Square Meters) and Value (US$ Mn) Forecast, by Application, 2018–2027
6.8.1. Residential
6.8.2. Non-residential
6.8.2.1. Hotels
6.8.2.2. Hospitals
6.8.2.3. Public Infrastructure
6.8.2.4. Others
6.9. Canada Ceramic & Porcelain Tiles Market Volume (Million Square Meters) and Value (US$ Mn) Forecast, by Product Type, 2018–2027
6.9.1. Ceramic Tiles
6.9.1.1. Glazed
6.9.1.2. Unglazed
6.9.2. Porcelain Tiles
6.9.2.1. Glazed
6.9.2.2. Unglazed
6.9.2.3. Full Bodied
6.9.2.4. Others
6.10. Canada Ceramic & Porcelain Tiles Market Volume (Million Square Meters) and Value (US$ Mn) Forecast, by Usage, 2018–2027
6.10.1. Floor Tiles
6.10.2. Wall Tiles
6.11. Canada Ceramic & Porcelain Tiles Market Volume (Million Square Meters) and Value (US$ Mn) Forecast, by Application, 2018–2027
6.11.1. Residential
6.11.2. Non-residential
6.11.2.1. Hotels
6.11.2.2. Hospitals
6.11.2.3. Public Infrastructure
6.11.2.4. Others
7. Europe Ceramic & Porcelain Tiles Market Analysis
7.1. Key Findings
7.2. Europe Ceramic & Porcelain Tiles Market Volume (Million Square Meters) and Value (US$ Mn) Forecast, by Product Type, 2018–2027
7.2.1. Ceramic Tiles
7.2.1.1. Glazed
7.2.1.2. Unglazed
7.2.2. Porcelain Tiles
7.2.2.1. Glazed
7.2.2.2. Unglazed
7.2.2.3. Full Bodied
7.2.2.4. Others
7.3. Europe Ceramic & Porcelain Tiles Market Volume (Million Square Meters) and Value (US$ Mn) Forecast, by Usage, 2018–2027
7.3.1. Floor Tiles
7.3.2. Wall Tiles
7.4. Europe Ceramic & Porcelain Tiles Market Volume (Million Square Meters) and Value (US$ Mn) Forecast, by Application, 2018–2027
7.4.1. Residential
7.4.2. Non-residential
7.4.2.1. Hotels
7.4.2.2. Hospitals
7.4.2.3. Public Infrastructure
7.4.2.4. Others
7.5. Europe Ceramic & Porcelain Tiles Market Volume (Million Square Meters) and Value (US$ Mn) Forecast, by Country and Sub-region, 2018–2027
7.6. Germany Ceramic & Porcelain Tiles Market Volume (Million Square Meters) and Value (US$ Mn) Forecast, by Product Type, 2018–2027
7.6.1. Ceramic Tiles
7.6.1.1. Glazed
7.6.1.2. Unglazed
7.6.2. Porcelain Tiles
7.6.2.1. Glazed
7.6.2.2. Unglazed
7.6.2.3. Full Bodied
7.6.2.4. Others
7.7. Germany Ceramic & Porcelain Tiles Market Volume (Million Square Meters) and Value (US$ Mn) Forecast, by Usage, 2018–2027
7.7.1. Floor Tiles
7.7.2. Wall Tiles
7.8. Germany Ceramic & Porcelain Tiles Market Volume (Million Square Meters) and Value (US$ Mn) Forecast, by Application, 2018–2027
7.8.1. Residential
7.8.2. Non-residential
7.8.2.1. Hotels
7.8.2.2. Hospitals
7.8.2.3. Public Infrastructure
7.8.2.4. Others
7.9. France Ceramic & Porcelain Tiles Market Volume (Million Square Meters) and Value (US$ Mn) Forecast, by Product Type, 2018–2027
7.9.1. Ceramic Tiles
7.9.1.1. Glazed
7.9.1.2. Unglazed
7.9.2. Porcelain Tiles
7.9.2.1. Glazed
7.9.2.2. Unglazed
7.9.2.3. Full Bodied
7.9.2.4. Others
7.10. France Ceramic & Porcelain Tiles Market Volume (Million Square Meters) and Value (US$ Mn) Forecast, by Usage, 2018–2027
7.10.1. Floor Tiles
7.10.2. Wall Tiles
7.11. France Ceramic & Porcelain Tiles Market Volume (Million Square Meters) and Value (US$ Mn) Forecast, by Application, 2018–2027
7.11.1. Residential
7.11.2. Non-residential
7.11.2.1. Hotels
7.11.2.2. Hospitals
7.11.2.3. Public Infrastructure
7.11.2.4. Others
7.12. U.K. Ceramic & Porcelain Tiles Market Volume (Million Square Meters) and Value (US$ Mn) Forecast, by Product Type, 2018–2027
7.12.1. Ceramic Tiles
7.12.1.1. Glazed
7.12.1.2. Unglazed
7.12.2. Porcelain Tiles
7.12.2.1. Glazed
7.12.2.2. Unglazed
7.12.2.3. Full Bodied
7.12.2.4. Others
7.13. U.K. Ceramic & Porcelain Tiles Market Volume (Million Square Meters) and Value (US$ Mn) Forecast, by Usage, 2018–2027
7.13.1. Floor Tiles
7.13.2. Wall Tiles
7.14. U.K. Ceramic & Porcelain Tiles Market Volume (Million Square Meters) and Value (US$ Mn) Forecast, by Application, 2018–2027
7.14.1. Residential
7.14.2. Non-residential
7.14.2.1. Hotels
7.14.2.2. Hospitals
7.14.2.3. Public Infrastructure
7.14.2.4. Others
7.15. Italy Ceramic & Porcelain Tiles Market Volume (Million Square Meters) and Value (US$ Mn) Forecast, by Product Type, 2018–2027
7.15.1. Ceramic Tiles
7.15.1.1. Glazed
7.15.1.2. Unglazed
7.15.2. Porcelain Tiles
7.15.2.1. Glazed
7.15.2.2. Unglazed
7.15.2.3. Full Bodied
7.15.2.4. Others
7.16. Italy Ceramic & Porcelain Tiles Market Volume (Million Square Meters) and Value (US$ Mn) Forecast, by Usage, 2018–2027
7.16.1. Floor Tiles
7.16.2. Wall Tiles
7.17. Italy Ceramic & Porcelain Tiles Market Volume (Million Square Meters) and Value (US$ Mn) Forecast, by Application, 2018–2027
7.17.1. Residential
7.17.2. Non-residential
7.17.2.1. Hotels
7.17.2.2. Hospitals
7.17.2.3. Public Infrastructure
7.17.2.4. Others
7.18. Spain Ceramic & Porcelain Tiles Market Volume (Million Square Meters) and Value (US$ Mn) Forecast, by Product Type, 2018–2027
7.18.1. Ceramic Tiles
7.18.1.1. Glazed
7.18.1.2. Unglazed
7.18.2. Porcelain Tiles
7.18.2.1. Glazed
7.18.2.2. Unglazed
7.18.2.3. Full Bodied
7.18.2.4. Others
7.19. Spain Ceramic & Porcelain Tiles Market Volume (Million Square Meters) and Value (US$ Mn) Forecast, by Usage, 2018–2027
7.19.1. Floor Tiles
7.19.2. Wall Tiles
7.20. Spain Ceramic & Porcelain Tiles Market Volume (Million Square Meters) and Value (US$ Mn) Forecast, by Application, 2018–2027
7.20.1. Residential
7.20.2. Non-residential
7.20.2.1. Hotels
7.20.2.2. Hospitals
7.20.2.3. Public Infrastructure
7.20.2.4. Others
7.21. Romania Ceramic & Porcelain Tiles Market Volume (Million Square Meters) and Value (US$ Mn) Forecast, by Product Type, 2018–2027
7.21.1. Ceramic Tiles
7.21.1.1. Glazed
7.21.1.2. Unglazed
7.21.2. Porcelain Tiles
7.21.2.1. Glazed
7.21.2.2. Unglazed
7.21.2.3. Full Bodied
7.21.2.4. Others
7.22. Romania Ceramic & Porcelain Tiles Market Volume (Million Square Meters) and Value (US$ Mn) Forecast, by Usage, 2018–2027
7.22.1. Floor Tiles
7.22.2. Wall Tiles
7.23. Romania Ceramic & Porcelain Tiles Market Volume (Million Square Meters) and Value (US$ Mn) Forecast, by Application, 2018–2027
7.23.1. Residential
7.23.2. Non-residential
7.23.2.1. Hotels
7.23.2.2. Hospitals
7.23.2.3. Public Infrastructure
7.23.2.4. Others
7.24. Netherlands Ceramic & Porcelain Tiles Market Volume (Million Square Meters) and Value (US$ Mn) Forecast, by Product Type, 2018–2027
7.24.1. Ceramic Tiles
7.24.1.1. Glazed
7.24.1.2. Unglazed
7.24.2. Porcelain Tiles
7.24.2.1. Glazed
7.24.2.2. Unglazed
7.24.2.3. Full Bodied
7.24.2.4. Others
7.25. Netherlands Ceramic & Porcelain Tiles Market Volume (Million Square Meters) and Value (US$ Mn) Forecast, by Usage, 2018–2027
7.25.1. Floor Tiles
7.25.2. Wall Tiles
7.26. Netherlands Ceramic & Porcelain Tiles Market Volume (Million Square Meters) and Value (US$ Mn) Forecast, by Application, 2018–2027
7.26.1. Residential
7.26.2. Non-residential
7.26.2.1. Hotels
7.26.2.2. Hospitals
7.26.2.3. Public Infrastructure
7.26.2.4. Others
7.27. Russia Ceramic & Porcelain Tiles Market Volume (Million Square Meters) and Value (US$ Mn) Forecast, by Product Type, 2018–2027
7.27.1. Ceramic Tiles
7.27.1.1. Glazed
7.27.1.2. Unglazed
7.27.2. Porcelain Tiles
7.27.2.1. Glazed
7.27.2.2. Unglazed
7.27.2.3. Full Bodied
7.27.2.4. Others
7.28. Russia Ceramic & Porcelain Tiles Market Volume (Million Square Meters) and Value (US$ Mn) Forecast, by Usage, 2018–2027
7.28.1. Floor Tiles
7.28.2. Wall Tiles
7.29. Russia Ceramic & Porcelain Tiles Market Volume (Million Square Meters) and Value (US$ Mn) Forecast, by Application, 2018–2027
7.29.1. Residential
7.29.2. Non-residential
7.29.2.1. Hotels
7.29.2.2. Hospitals
7.29.2.3. Public Infrastructure
7.29.2.4. Others
7.30. Turkey Ceramic & Porcelain Tiles Market Volume (Million Square Meters) and Value (US$ Mn) Forecast, by Product Type, 2018–2027
7.30.1. Ceramic Tiles
7.30.1.1. Glazed
7.30.1.2. Unglazed
7.30.2. Porcelain Tiles
7.30.2.1. Glazed
7.30.2.2. Unglazed
7.30.2.3. Full Bodied
7.30.2.4. Others
7.31. Turkey Ceramic & Porcelain Tiles Market Volume (Million Square Meters) and Value (US$ Mn) Forecast, by Usage, 2018–2027
7.31.1. Floor Tiles
7.31.2. Wall Tiles
7.32. Turkey Ceramic & Porcelain Tiles Market Volume (Million Square Meters) and Value (US$ Mn) Forecast, by Application, 2018–2027
7.32.1. Residential
7.32.2. Non-residential
7.32.2.1. Hotels
7.32.2.2. Hospitals
7.32.2.3. Public Infrastructure
7.32.2.4. Others
7.33. Finland Ceramic & Porcelain Tiles Market Volume (Million Square Meters) and Value (US$ Mn) Forecast, by Product Type, 2018–2027
7.33.1. Ceramic Tiles
7.33.1.1. Glazed
7.33.1.2. Unglazed
7.33.2. Porcelain Tiles
7.33.2.1. Glazed
7.33.2.2. Unglazed
7.33.2.3. Full Bodied
7.33.2.4. Others
7.34. Finland Ceramic & Porcelain Tiles Market Volume (Million Square Meters) and Value (US$ Mn) Forecast, by Usage, 2018–2027
7.34.1. Floor Tiles
7.34.2. Wall Tiles
7.35. Finland Ceramic & Porcelain Tiles Market Volume (Million Square Meters) and Value (US$ Mn) Forecast, by Application, 2018–2027
7.35.1. Residential
7.35.2. Non-residential
7.35.2.1. Hotels
7.35.2.2. Hospitals
7.35.2.3. Public Infrastructure
7.35.2.4. Others
7.36. Norway Ceramic & Porcelain Tiles Market Volume (Million Square Meters) and Value (US$ Mn) Forecast, by Product Type, 2018–2027
7.36.1. Ceramic Tiles
7.36.1.1. Glazed
7.36.1.2. Unglazed
7.36.2. Porcelain Tiles
7.36.2.1. Glazed
7.36.2.2. Unglazed
7.36.2.3. Full Bodied
7.36.2.4. Others
7.37. Norway Ceramic & Porcelain Tiles Market Volume (Million Square Meters) and Value (US$ Mn) Forecast, by Usage, 2018–2027
7.37.1. Floor Tiles
7.37.2. Wall Tiles
7.38. Norway Ceramic & Porcelain Tiles Market Volume (Million Square Meters) and Value (US$ Mn) Forecast, by Application, 2018–2027
7.38.1. Residential
7.38.2. Non-residential
7.38.2.1. Hotels
7.38.2.2. Hospitals
7.38.2.3. Public Infrastructure
7.38.2.4. Others
7.39. Sweden Ceramic & Porcelain Tiles Market Volume (Million Square Meters) and Value (US$ Mn) Forecast, by Product Type, 2018–2027
7.39.1. Ceramic Tiles
7.39.1.1. Glazed
7.39.1.2. Unglazed
7.39.2. Porcelain Tiles
7.39.2.1. Glazed
7.39.2.2. Unglazed
7.39.2.3. Full Bodied
7.39.2.4. Others
7.40. Sweden Ceramic & Porcelain Tiles Market Volume (Million Square Meters) and Value (US$ Mn) Forecast, by Usage, 2018–2027
7.40.1. Floor Tiles
7.40.2. Wall Tiles
7.41. Sweden Ceramic & Porcelain Tiles Market Volume (Million Square Meters) and Value (US$ Mn) Forecast, by Application, 2018–2027
7.41.1. Residential
7.41.2. Non-residential
7.41.2.1. Hotels
7.41.2.2. Hospitals
7.41.2.3. Public Infrastructure
7.41.2.4. Others
7.42. Denmark Ceramic & Porcelain Tiles Market Volume (Million Square Meters) and Value (US$ Mn) Forecast, by Product Type, 2018–2027
7.42.1. Ceramic Tiles
7.42.1.1. Glazed
7.42.1.2. Unglazed
7.42.2. Porcelain Tiles
7.42.2.1. Glazed
7.42.2.2. Unglazed
7.42.2.3. Full Bodied
7.42.2.4. Others
7.43. Denmark Ceramic & Porcelain Tiles Market Volume (Million Square Meters) and Value (US$ Mn) Forecast, by Usage, 2018–2027
7.43.1. Floor Tiles
7.43.2. Wall Tiles
7.44. Denmark Ceramic & Porcelain Tiles Market Volume (Million Square Meters) and Value (US$ Mn) Forecast, by Application, 2018–2027
7.44.1. Residential
7.44.2. Non-residential
7.44.2.1. Hotels
7.44.2.2. Hospitals
7.44.2.3. Public Infrastructure
7.44.2.4. Others
7.45. Rest of Europe Ceramic & Porcelain Tiles Market Volume (Million Square Meters) and Value (US$ Mn) Forecast, by Product Type, 2018–2027
7.45.1. Ceramic Tiles
7.45.1.1. Glazed
7.45.1.2. Unglazed
7.45.2. Porcelain Tiles
7.45.2.1. Glazed
7.45.2.2. Unglazed
7.45.2.3. Full Bodied
7.45.2.4. Others
7.46. Rest of Europe Ceramic & Porcelain Tiles Market Volume (Million Square Meters) and Value (US$ Mn) Forecast, by Usage, 2018–2027
7.46.1. Floor Tiles
7.46.2. Wall Tiles
7.47. Rest of Europe Ceramic & Porcelain Tiles Market Volume (Million Square Meters) and Value (US$ Mn) Forecast, by Application, 2018–2027
7.47.1. Residential
7.47.2. Non-residential
7.47.2.1. Hotels
7.47.2.2. Hospitals
7.47.2.3. Public Infrastructure
7.47.2.4. Others
7.48. Europe Ceramic & Porcelain Tiles Market Attractiveness Analysis
8. Asia Pacific Ceramic & Porcelain Tiles Market Analysis
8.1. Key Findings
8.2. Asia Pacific Ceramic & Porcelain Tiles Market Volume (Million Square Meters) and Value (US$ Mn) Forecast, by Product Type, 2018–2027
8.2.1. Ceramic Tiles
8.2.1.1. Glazed
8.2.1.2. Unglazed
8.2.2. Porcelain Tiles
8.2.2.1. Glazed
8.2.2.2. Unglazed
8.2.2.3. Full Bodied
8.2.2.4. Others
8.3. Asia Pacific Ceramic & Porcelain Tiles Market Volume (Million Square Meters) and Value (US$ Mn) Forecast, by Usage, 2018–2027
8.3.1. Floor Tiles
8.3.2. Wall Tiles
8.4. Asia Pacific Ceramic & Porcelain Tiles Market Volume (Million Square Meters) and Value (US$ Mn) Forecast, by Application, 2018–2027
8.4.1. Residential
8.4.2. Non-residential
8.4.2.1. Hotels
8.4.2.2. Hospitals
8.4.2.3. Public Infrastructure
8.4.2.4. Others
8.5. Asia Pacific Ceramic & Porcelain Tiles Market Volume (Million Square Meters) and Value (US$ Mn) Forecast, by Country and Sub-region, 2018–2027
8.6. China Ceramic & Porcelain Tiles Market Volume (Million Square Meters) and Value (US$ Mn) Forecast, by Product Type, 2018–2027
8.6.1. Ceramic Tiles
8.6.1.1. Glazed
8.6.1.2. Unglazed
8.6.2. Porcelain Tiles
8.6.2.1. Glazed
8.6.2.2. Unglazed
8.6.2.3. Full Bodied
8.6.2.4. Others
8.7. China Ceramic & Porcelain Tiles Market Volume (Million Square Meters) and Value (US$ Mn) Forecast, by Usage, 2018–2027
8.7.1. Floor Tiles
8.7.2. Wall Tiles
8.8. China Ceramic & Porcelain Tiles Market Volume (Million Square Meters) and Value (US$ Mn) Forecast, by Application, 2018–2027
8.8.1. Residential
8.8.2. Non-residential
8.8.2.1. Hotels
8.8.2.2. Hospitals
8.8.2.3. Public Infrastructure
8.8.2.4. Others
8.9. Japan Ceramic & Porcelain Tiles Market Volume (Million Square Meters) and Value (US$ Mn) Forecast, by Product Type, 2018–2027
8.9.1. Ceramic Tiles
8.9.1.1. Glazed
8.9.1.2. Unglazed
8.9.2. Porcelain Tiles
8.9.2.1. Glazed
8.9.2.2. Unglazed
8.9.2.3. Full Bodied
8.9.2.4. Others
8.10. Japan Ceramic & Porcelain Tiles Market Volume (Million Square Meters) and Value (US$ Mn) Forecast, by Usage, 2018–2027
8.10.1. Floor Tiles
8.10.2. Wall Tiles
8.11. Japan Ceramic & Porcelain Tiles Market Volume (Million Square Meters) and Value (US$ Mn) Forecast, by Application, 2018–2027
8.11.1. Residential
8.11.2. Non-residential
8.11.2.1. Hotels
8.11.2.2. Hospitals
8.11.2.3. Public Infrastructure
8.11.2.4. Others
8.12. India Ceramic & Porcelain Tiles Market Volume (Million Square Meters) and Value (US$ Mn) Forecast, by Product Type, 2018–2027
8.12.1. Ceramic Tiles
8.12.1.1. Glazed
8.12.1.2. Unglazed
8.12.2. Porcelain Tiles
8.12.2.1. Glazed
8.12.2.2. Unglazed
8.12.2.3. Full Bodied
8.12.2.4. Others
8.13. India Ceramic & Porcelain Tiles Market Volume (Million Square Meters) and Value (US$ Mn) Forecast, by Usage, 2018–2027
8.13.1. Floor Tiles
8.13.2. Wall Tiles
8.14. India Ceramic & Porcelain Tiles Market Volume (Million Square Meters) and Value (US$ Mn) Forecast, by Application, 2018–2027
8.14.1. Residential
8.14.2. Non-residential
8.14.2.1. Hotels
8.14.2.2. Hospitals
8.14.2.3. Public Infrastructure
8.14.2.4. Others
8.15. ASEAN Ceramic & Porcelain Tiles Market Volume (Million Square Meters) and Value (US$ Mn) Forecast, by Product Type, 2018–2027
8.15.1. Ceramic Tiles
8.15.1.1. Glazed
8.15.1.2. Unglazed
8.15.2. Porcelain Tiles
8.15.2.1. Glazed
8.15.2.2. Unglazed
8.15.2.3. Full Bodied
8.15.2.4. Others
8.16. ASEAN Ceramic & Porcelain Tiles Market Volume (Million Square Meters) and Value (US$ Mn) Forecast, by Usage, 2018–2027
8.16.1. Floor Tiles
8.16.2. Wall Tiles
8.17. ASEAN Ceramic & Porcelain Tiles Market Volume (Million Square Meters) and Value (US$ Mn) Forecast, by Application, 2018–2027
8.17.1. Residential
8.17.2. Non-residential
8.17.2.1. Hotels
8.17.2.2. Hospitals
8.17.2.3. Public Infrastructure
8.17.2.4. Others
8.18. Pakistan Ceramic & Porcelain Tiles Market Volume (Million Square Meters) and Value (US$ Mn) Forecast, by Product Type, 2018–2027
8.18.1. Ceramic Tiles
8.18.1.1. Glazed
8.18.1.2. Unglazed
8.18.2. Porcelain Tiles
8.18.2.1. Glazed
8.18.2.2. Unglazed
8.18.2.3. Full Bodied
8.18.2.4. Others
8.19. Pakistan Ceramic & Porcelain Tiles Market Volume (Million Square Meters) and Value (US$ Mn) Forecast, by Usage, 2018–2027
8.19.1. Floor Tiles
8.19.2. Wall Tiles
8.20. Pakistan Ceramic & Porcelain Tiles Market Volume (Million Square Meters) and Value (US$ Mn) Forecast, by Application, 2018–2027
8.20.1. Residential
8.20.2. Non-residential
8.20.2.1. Hotels
8.20.2.2. Hospitals
8.20.2.3. Public Infrastructure
8.20.2.4. Others
8.21. South Korea Ceramic & Porcelain Tiles Market Volume (Million Square Meters) and Value (US$ Mn) Forecast, by Product Type, 2018–2027
8.21.1. Ceramic Tiles
8.21.1.1. Glazed
8.21.1.2. Unglazed
8.21.2. Porcelain Tiles
8.21.2.1. Glazed
8.21.2.2. Unglazed
8.21.2.3. Full Bodied
8.21.2.4. Others
8.22. South Korea Ceramic & Porcelain Tiles Market Volume (Million Square Meters) and Value (US$ Mn) Forecast, by Usage, 2018–2027
8.22.1. Floor Tiles
8.22.2. Wall Tiles
8.23. South Korea Ceramic & Porcelain Tiles Market Volume (Million Square Meters) and Value (US$ Mn) Forecast, by Application, 2018–2027
8.23.1. Residential
8.23.2. Non-residential
8.23.2.1. Hotels
8.23.2.2. Hospitals
8.23.2.3. Public Infrastructure
8.23.2.4. Others
8.24. Australia Ceramic & Porcelain Tiles Market Volume (Million Square Meters) and Value (US$ Mn) Forecast, by Product Type, 2018–2027
8.24.1. Ceramic Tiles
8.24.1.1. Glazed
8.24.1.2. Unglazed
8.24.2. Porcelain Tiles
8.24.2.1. Glazed
8.24.2.2. Unglazed
8.24.2.3. Full Bodied
8.24.2.4. Others
8.25. Australia Ceramic & Porcelain Tiles Market Volume (Million Square Meters) and Value (US$ Mn) Forecast, by Usage, 2018–2027
8.25.1. Floor Tiles
8.25.2. Wall Tiles
8.26. Australia Ceramic & Porcelain Tiles Market Volume (Million Square Meters) and Value (US$ Mn) Forecast, by Application, 2018–2027
8.26.1. Residential
8.26.2. Non-residential
8.26.2.1. Hotels
8.26.2.2. Hospitals
8.26.2.3. Public Infrastructure
8.26.2.4. Others
8.27. Rest of Asia Pacific Ceramic & Porcelain Tiles Market Volume (Million Square Meters) and Value (US$ Mn) Forecast, by Product Type, 2018–2027
8.27.1. Ceramic Tiles
8.27.1.1. Glazed
8.27.1.2. Unglazed
8.27.2. Porcelain Tiles
8.27.2.1. Glazed
8.27.2.2. Unglazed
8.27.2.3. Full Bodied
8.27.2.4. Others
8.28. Rest of Asia Pacific Ceramic & Porcelain Tiles Market Volume (Million Square Meters) and Value (US$ Mn) Forecast, by Usage, 2018–2027
8.28.1. Floor Tiles
8.28.2. Wall Tiles
8.29. Rest of Asia Pacific Ceramic & Porcelain Tiles Market Volume (Million Square Meters) and Value (US$ Mn) Forecast, by Application, 2018–2027
8.29.1. Residential
8.29.2. Non-residential
8.29.2.1. Hotels
8.29.2.2. Hospitals
8.29.2.3. Public Infrastructure
8.29.2.4. Others
8.30. Asia Pacific Ceramic & Porcelain Tiles Market Attractiveness Analysis
9. Latin America Ceramic & Porcelain Tiles Market Analysis
9.1. Key Findings
9.2. Latin America Ceramic & Porcelain Tiles Market Volume (Million Square Meters) and Value (US$ Mn) Forecast, by Product Type, 2018–2027
9.2.1. Ceramic Tiles
9.2.1.1. Glazed
9.2.1.2. Unglazed
9.2.2. Porcelain Tiles
9.2.2.1. Glazed
9.2.2.2. Unglazed
9.2.2.3. Full Bodied
9.2.2.4. Others
9.3. Latin America Ceramic & Porcelain Tiles Market Volume (Million Square Meters) and Value (US$ Mn) Forecast, by Usage, 2018–2027
9.3.1. Floor Tiles
9.3.2. Wall Tiles
9.4. Latin America Ceramic & Porcelain Tiles Market Volume (Million Square Meters) and Value (US$ Mn) Forecast, by Application, 2018–2027
9.4.1. Residential
9.4.2. Non-residential
9.4.2.1. Hotels
9.4.2.2. Hospitals
9.4.2.3. Public Infrastructure
9.4.2.4. Others
9.5. Latin America Ceramic & Porcelain Tiles Market Volume (Million Square Meters) and Value (US$ Mn) Forecast, by Country and Sub-region, 2018–2027
9.6. Brazil Ceramic & Porcelain Tiles Market Volume (Million Square Meters) and Value (US$ Mn) Forecast, by Product Type, 2018–2027
9.6.1. Ceramic Tiles
9.6.1.1. Glazed
9.6.1.2. Unglazed
9.6.2. Porcelain Tiles
9.6.2.1. Glazed
9.6.2.2. Unglazed
9.6.2.3. Full Bodied
9.6.2.4. Others
9.7. Brazil Ceramic & Porcelain Tiles Market Volume (Million Square Meters) and Value (US$ Mn) Forecast, by Usage, 2018–2027
9.7.1. Floor Tiles
9.7.2. Wall Tiles
9.8. Brazil Ceramic & Porcelain Tiles Market Volume (Million Square Meters) and Value (US$ Mn) Forecast, by Application, 2018–2027
9.8.1. Residential
9.8.2. Non-residential
9.8.2.1. Hotels
9.8.2.2. Hospitals
9.8.2.3. Public Infrastructure
9.8.2.4. Others
9.9. Mexico Ceramic & Porcelain Tiles Market Volume (Million Square Meters) and Value (US$ Mn) Forecast, by Product Type, 2018–2027
9.9.1. Ceramic Tiles
9.9.1.1. Glazed
9.9.1.2. Unglazed
9.9.2. Porcelain Tiles
9.9.2.1. Glazed
9.9.2.2. Unglazed
9.9.2.3. Full Bodied
9.9.2.4. Others
9.10. Mexico Ceramic & Porcelain Tiles Market Volume (Million Square Meters) and Value (US$ Mn) Forecast, by Usage, 2018–2027
9.10.1. Floor Tiles
9.10.2. Wall Tiles
9.11. Mexico Ceramic & Porcelain Tiles Market Volume (Million Square Meters) and Value (US$ Mn) Forecast, by Application, 2018–2027
9.11.1. Residential
9.11.2. Non-residential
9.11.2.1. Hotels
9.11.2.2. Hospitals
9.11.2.3. Public Infrastructure
9.11.2.4. Others
9.12. Rest of Latin America Ceramic & Porcelain Tiles Market Volume (Million Square Meters) and Value (US$ Mn) Forecast, by Product Type, 2018–2027
9.12.1. Ceramic Tiles
9.12.1.1. Glazed
9.12.1.2. Unglazed
9.12.2. Porcelain Tiles
9.12.2.1. Glazed
9.12.2.2. Unglazed
9.12.2.3. Full Bodied
9.12.2.4. Others
9.13. Rest of Latin America Ceramic & Porcelain Tiles Market Volume (Million Square Meters) and Value (US$ Mn) Forecast, by Usage, 2018–2027
9.13.1. Floor Tiles
9.13.2. Wall Tiles
9.14. Rest of Latin America Ceramic & Porcelain Tiles Market Volume (Million Square Meters) and Value (US$ Mn) Forecast, by Application, 2018–2027
9.14.1. Residential
9.14.2. Non-residential
9.14.2.1. Hotels
9.14.2.2. Hospitals
9.14.2.3. Public Infrastructure
9.14.2.4. Others
9.15. Latin America Ceramic & Porcelain Tiles Market Attractiveness Analysis
10. Middle East & Africa Ceramic & Porcelain Tiles Market Analysis
10.1. Key Findings
10.2. Middle East & Africa Ceramic & Porcelain Tiles Market Volume (Million Square Meters) and Value (US$ Mn) Forecast, by Product Type, 2018–2027
10.2.1. Ceramic Tiles
10.2.1.1. Glazed
10.2.1.2. Unglazed
10.2.2. Porcelain Tiles
10.2.2.1. Glazed
10.2.2.2. Unglazed
10.2.2.3. Full Bodied
10.2.2.4. Others
10.3. Middle East & Africa Ceramic & Porcelain Tiles Market Volume (Million Square Meters) and Value (US$ Mn) Forecast, by Usage, 2018–2027
10.3.1. Floor Tiles
10.3.2. Wall Tiles
10.4. Middle East & Africa Ceramic & Porcelain Tiles Market Volume (Million Square Meters) and Value (US$ Mn) Forecast, by Application, 2018–2027
10.4.1. Residential
10.4.2. Non-residential
10.4.2.1. Hotels
10.4.2.2. Hospitals
10.4.2.3. Public Infrastructure
10.4.2.4. Others
10.5. Middle East & Africa Ceramic & Porcelain Tiles Market Volume (Million Square Meters) and Value (US$ Mn) Forecast, by Country and Sub-region, 2018–2027
10.6. Saudi Arabia Ceramic & Porcelain Tiles Market Volume (Million Square Meters) and Value (US$ Mn) Forecast, by Product Type, 2018–2027
10.6.1. Ceramic Tiles
10.6.1.1. Glazed
10.6.1.2. Unglazed
10.6.2. Porcelain Tiles
10.6.2.1. Glazed
10.6.2.2. Unglazed
10.6.2.3. Full Bodied
10.6.2.4. Others
10.7. Saudi Arabia Ceramic & Porcelain Tiles Market Volume (Million Square Meters) and Value (US$ Mn) Forecast, by Usage, 2018–2027
10.7.1. Floor Tiles
10.7.2. Wall Tiles
10.8. Saudi Arabia Ceramic & Porcelain Tiles Market Volume (Million Square Meters) and Value (US$ Mn) Forecast, by Application, 2018–2027
10.8.1. Residential
10.8.2. Non-residential
10.8.2.1. Hotels
10.8.2.2. Hospitals
10.8.2.3. Public Infrastructure
10.8.2.4. Others
10.9. UAE Ceramic & Porcelain Tiles Market Volume (Million Square Meters) and Value (US$ Mn) Forecast, by Product Type, 2018–2027
10.9.1. Ceramic Tiles
10.9.1.1. Glazed
10.9.1.2. Unglazed
10.9.2. Porcelain Tiles
10.9.2.1. Glazed
10.9.2.2. Unglazed
10.9.2.3. Full Bodied
10.9.2.4. Others
10.10. UAE Ceramic & Porcelain Tiles Market Volume (Million Square Meters) and Value (US$ Mn) Forecast, by Usage, 2018–2027
10.10.1. Floor Tiles
10.10.2. Wall Tiles
10.11. UAE Ceramic & Porcelain Tiles Market Volume (Million Square Meters) and Value (US$ Mn) Forecast, by Application, 2018–2027
10.11.1. Residential
10.11.2. Non-residential
10.11.2.1. Hotels
10.11.2.2. Hospitals
10.11.2.3. Public Infrastructure
10.11.2.4. Others
10.12. Oman Ceramic & Porcelain Tiles Market Volume (Million Square Meters) and Value (US$ Mn) Forecast, by Product Type, 2018–2027
10.12.1. Ceramic Tiles
10.12.1.1. Glazed
10.12.1.2. Unglazed
10.12.2. Porcelain Tiles
10.12.2.1. Glazed
10.12.2.2. Unglazed
10.12.2.3. Full Bodied
10.12.2.4. Others
10.13. Oman Ceramic & Porcelain Tiles Market Volume (Million Square Meters) and Value (US$ Mn) Forecast, by Usage, 2018–2027
10.13.1. Floor Tiles
10.13.2. Wall Tiles
10.14. Oman Ceramic & Porcelain Tiles Market Volume (Million Square Meters) and Value (US$ Mn) Forecast, by Application, 2018–2027
10.14.1. Residential
10.14.2. Non-residential
10.14.2.1. Hotels
10.14.2.2. Hospitals
10.14.2.3. Public Infrastructure
10.14.2.4. Others
10.15. Iraq Ceramic & Porcelain Tiles Market Volume (Million Square Meters) and Value (US$ Mn) Forecast, by Product Type, 2018–2027
10.15.1. Ceramic Tiles
10.15.1.1. Glazed
10.15.1.2. Unglazed
10.15.2. Porcelain Tiles
10.15.2.1. Glazed
10.15.2.2. Unglazed
10.15.2.3. Full Bodied
10.15.2.4. Others
10.16. Iraq Ceramic & Porcelain Tiles Market Volume (Million Square Meters) and Value (US$ Mn) Forecast, by Usage, 2018–2027
10.16.1. Floor Tiles
10.16.2. Wall Tiles
10.17. Iraq Ceramic & Porcelain Tiles Market Volume (Million Square Meters) and Value (US$ Mn) Forecast, by Application, 2018–2027
10.17.1. Residential
10.17.2. Non-residential
10.17.2.1. Hotels
10.17.2.2. Hospitals
10.17.2.3. Public Infrastructure
10.17.2.4. Others
10.18. Israel Ceramic & Porcelain Tiles Market Volume (Million Square Meters) and Value (US$ Mn) Forecast, by Product Type, 2018–2027
10.18.1. Ceramic Tiles
10.18.1.1. Glazed
10.18.1.2. Unglazed
10.18.2. Porcelain Tiles
10.18.2.1. Glazed
10.18.2.2. Unglazed
10.18.2.3. Full Bodied
10.18.2.4. Others
10.19. Israel Ceramic & Porcelain Tiles Market Volume (Million Square Meters) and Value (US$ Mn) Forecast, by Usage, 2018–2027
10.19.1. Floor Tiles
10.19.2. Wall Tiles
10.20. Israel Ceramic & Porcelain Tiles Market Volume (Million Square Meters) and Value (US$ Mn) Forecast, by Application, 2018–2027
10.20.1. Residential
10.20.2. Non-residential
10.20.2.1. Hotels
10.20.2.2. Hospitals
10.20.2.3. Public Infrastructure
10.20.2.4. Others
10.21. South Africa Ceramic & Porcelain Tiles Market Volume (Million Square Meters) and Value (US$ Mn) Forecast, by Product Type, 2018–2027
10.21.1. Ceramic Tiles
10.21.1.1. Glazed
10.21.1.2. Unglazed
10.21.2. Porcelain Tiles
10.21.2.1. Glazed
10.21.2.2. Unglazed
10.21.2.3. Full Bodied
10.21.2.4. Others
10.22. South Africa Ceramic & Porcelain Tiles Market Volume (Million Square Meters) and Value (US$ Mn) Forecast, by Usage, 2018–2027
10.22.1. Floor Tiles
10.22.2. Wall Tiles
10.23. South Africa Ceramic & Porcelain Tiles Market Volume (Million Square Meters) and Value (US$ Mn) Forecast, by Application, 2018–2027
10.23.1. Residential
10.23.2. Non-residential
10.23.2.1. Hotels
10.23.2.2. Hospitals
10.23.2.3. Public Infrastructure
10.23.2.4. Others
10.24. Rest of Middle East & Africa Ceramic & Porcelain Tiles Market Volume (Million Square Meters) and Value (US$ Mn) Forecast, by Product Type, 2018–2027
10.24.1. Ceramic Tiles
10.24.1.1. Glazed
10.24.1.2. Unglazed
10.24.2. Porcelain Tiles
10.24.2.1. Glazed
10.24.2.2. Unglazed
10.24.2.3. Full Bodied
10.24.2.4. Others
10.25. Rest of Middle East & Africa Ceramic & Porcelain Tiles Market Volume (Million Square Meters) and Value (US$ Mn) Forecast, by Usage, 2018–2027
10.25.1. Floor Tiles
10.25.2. Wall Tiles
10.26. Rest of Middle East & Africa Ceramic & Porcelain Tiles Market Volume (Million Square Meters) and Value (US$ Mn) Forecast, by Application, 2018–2027
10.26.1. Residential
10.26.2. Non-residential
10.26.2.1. Hotels
10.26.2.2. Hospitals
10.26.2.3. Public Infrastructure
10.26.2.4. Others
10.27. Middle East & Africa Ceramic & Porcelain Tiles Market Attractiveness Analysis
11. Competition Landscape
11.1. Ceramic & Porcelain Tiles Market Share Analysis, by Company, 2018
11.2. Competition Matrix
11.2.1. Application Mapping
11.3. Company Profiles
11.3.1. Mohawk Industries Inc.
11.3.1.1. Company Details (HQ, Foundation Year, Revenue, Employee Strength)
11.3.1.2. Business Overview
11.3.1.3. Product/Services, Key End-use Industries
11.3.1.4. Financial Overview
11.3.1.5. Key Developments
11.3.2. PORCELANOSA Grupo A.I.E.
11.3.2.1. Company Details (HQ, Foundation Year, Revenue, Employee Strength)
11.3.2.2. Business Overview
11.3.2.3. Product/Services, Key End-use Industries
11.3.3. Crossville Inc.
11.3.3.1. Company Details (HQ, Foundation Year, Revenue, Employee Strength)
11.3.3.2. Business Overview
11.3.3.3. Product/Services, Key End-use Industries
11.3.4. Gruppo Ceramiche Ricchetti S.p.A.
11.3.4.1. Company Details (HQ, Foundation Year, Revenue, Employee Strength)
11.3.4.2. Business Overview
11.3.4.3. Product/Services, Key End-use Industries
11.3.4.4. Financial Overview
11.3.5. CERA Sanitaryware Limited
11.3.5.1. Company Details (HQ, Foundation Year, Revenue, Employee Strength)
11.3.5.2. Business Overview
11.3.5.3. Product/Services, Key End-use Industries
11.3.6. Kohler Co.
11.3.6.1. Company Details (HQ, Foundation Year, Revenue, Employee Strength)
11.3.6.2. Business Overview
11.3.6.3. Product/Services, Key End-use Industries
11.3.7. Kajaria Ceramics
11.3.7.1. Company Details (HQ, Foundation Year, Revenue, Employee Strength)
11.3.7.2. Business Overview
11.3.7.3. Product/Services, Key End-use Industries
11.3.7.4. Financial Overview
11.3.7.5. Key Developments
11.3.8. H & R Johnson
11.3.8.1. Company Details (HQ, Foundation Year, Revenue, Employee Strength)
11.3.8.2. Business Overview
11.3.8.3. Product/Services, Key End-use Industries
11.3.9. Jaquar Group
11.3.9.1. Company Details (HQ, Foundation Year, Revenue, Employee Strength)
11.3.9.2. Business Overview
11.3.9.3. Product/Services, Key End-use Industries
11.3.10. Ceramiche Atlas Concorde S.p.A.
11.3.10.1. Company Details (HQ, Foundation Year, Revenue, Employee Strength)
11.3.10.2. Business Overview
11.3.10.3. Product/Services, Key End-use Industries
11.3.11. ARDEX GROUP
11.3.11.1. Company Details (HQ, Foundation Year, Revenue, Employee Strength)
11.3.11.2. Business Overview
11.3.11.3. Product/Services, Key End-use Industries
11.3.12. Grupo Lamosa
11.3.12.1. Company Details (HQ, Foundation Year, Revenue, Employee Strength)
11.3.12.2. Business Overview
11.3.12.3. Product/Services, Key End-use Industries
11.3.12.4. Financial Overview
11.3.13. Porcelaingres GmbH
11.3.13.1. Company Details (HQ, Foundation Year, Revenue, Employee Strength)
11.3.13.2. Business Overview
11.3.13.3. Product/Services, Key End-use Industries
11.3.14. MEISSEN KERAMIK GmbH
11.3.14.1. Company Details (HQ, Foundation Year, Revenue, Employee Strength)
11.3.14.2. Business Overview
11.3.14.3. Product/Services, Key End-use Industries
12. Primary Research - Key Insights
13. Appendix
13.1. Research Methodology and Assumptions
List of Tables
Table 01: Global Ceramic & Porcelain Tiles Market Volume (Million Square Meters) and Value (US$ Mn) Forecast, by Product Type, 2018–2027
Table 02: Global Ceramic & Porcelain Tiles Market Volume (Million Square Meters) and Value (US$ Mn) Forecast, by Usage, 2018–2027
Table 03: Global Ceramic & Porcelain Tiles Market Volume (Million Square Meters) and Value (US$ Mn) Forecast, by Application, 2018–2027
Table 04: Global Ceramic & Porcelain Tiles Market Volume (Million Square Meters) and Value (US$ Mn) Forecast, by Region, 2018–2027
Table 05: North America Ceramic & Porcelain Tiles Market Volume (Million Square Meters) and Value (US$ Mn) Forecast, by Product Type, 2018–2027
Table 06: North America Ceramic & Porcelain Tiles Market Volume (Million Square Meters) and Value (US$ Mn) Forecast, by Usage, 2018–2027
Table 07: North America Ceramic & Porcelain Tiles Market Volume (Million Square Meters) and Value (US$ Mn) Forecast, by Application, 2018–2027
Table 08: North America Ceramic & Porcelain Tiles Market Volume (Million Square Meters) and Value (US$ Mn) Forecast, by Country, 2018–2027
Table 09: U.S. Ceramic & Porcelain Tiles Market Volume (Million Square Meters) and Value (US$ Mn) Forecast, by Product Type, 2018–2027
Table 10: U.S. Ceramic & Porcelain Tiles Market Volume (Million Square Meters) and Value (US$ Mn) Forecast, by Usage, 2018–2027
Table 11: U.S. Ceramic & Porcelain Tiles Market Volume (Million Square Meters) and Value (US$ Mn) Forecast, by Application, 2018–2027
Table 12: Canada Ceramic & Porcelain Tiles Market Volume (Million Square Meters) and Value (US$ Mn) Forecast, by Product Type, 2018–2027
Table 13: Canada Ceramic & Porcelain Tiles Market Volume (Million Square Meters) and Value (US$ Mn) Forecast, by Usage, 2018–2027
Table 14: Canada Ceramic & Porcelain Tiles Market Volume (Million Square Meters) and Value (US$ Mn) Forecast, by Application, 2018–2027
Table 15: Europe Ceramic & Porcelain Tiles Market Volume (Million Square Meters) and Value (US$ Mn) Forecast, by Product Type, 2018–2027
Table 16: Europe Ceramic & Porcelain Tiles Market Volume (Million Square Meters) and Value (US$ Mn) Forecast, by Usage, 2018–2027
Table 17: Europe Ceramic & Porcelain Tiles Market Volume (Million Square Meters) and Value (US$ Mn) Forecast, by Application, 2018–2027
Table 18: Europe Ceramic & Porcelain Tiles Market Volume (Million Square Meters) and Value (US$ Mn) Forecast, by Country and Sub-region, 2018–2027
Table 19: Germany Ceramic & Porcelain Tiles Market Volume (Million Square Meters) and Value (US$ Mn) Forecast, by Product Type, 2018–2027
Table 20: Germany Ceramic & Porcelain Tiles Market Volume (Million Square Meters) and Value (US$ Mn) Forecast, by Usage, 2018–2027
Table 21: Germany Ceramic & Porcelain Tiles Market Volume (Million Square Meters) and Value (US$ Mn) Forecast, by Application, 2018–2027
Table 22: France Ceramic & Porcelain Tiles Market Volume (Million Square Meters) and Value (US$ Mn) Forecast, by Product Type, 2018–2027
Table 23: France Ceramic & Porcelain Tiles Market Volume (Million Square Meters) and Value (US$ Mn) Forecast, by Usage, 2018–2027
Table 24: France Ceramic & Porcelain Tiles Market Volume (Million Square Meters) and Value (US$ Mn) Forecast, by Application, 2018–2027
Table 25: U.K. Ceramic & Porcelain Tiles Market Volume (Million Square Meters) and Value (US$ Mn) Forecast, by Product Type, 2018–2027
Table 26: U.K. Ceramic & Porcelain Tiles Market Volume (Million Square Meters) and Value (US$ Mn) Forecast, by Usage, 2018–2027
Table 27: U.K. Ceramic & Porcelain Tiles Market Volume (Million Square Meters) and Value (US$ Mn) Forecast, by Application, 2018–2027
Table 28: Italy Ceramic & Porcelain Tiles Market Volume (Million Square Meters) and Value (US$ Mn) Forecast, by Product Type, 2018–2027
Table 29: Italy Ceramic & Porcelain Tiles Market Volume (Million Square Meters) and Value (US$ Mn) Forecast, by Usage, 2018–2027
Table 30: Italy Ceramic & Porcelain Tiles Market Volume (Million Square Meters) and Value (US$ Mn) Forecast, by Application, 2018–2027
Table 31: Spain Ceramic & Porcelain Tiles Market Volume (Million Square Meters) and Value (US$ Mn) Forecast, by Product Type, 2018–2027
Table 32: Spain Ceramic & Porcelain Tiles Market Volume (Million Square Meters) and Value (US$ Mn) Forecast, by Usage, 2018–2027
Table 33: Spain Ceramic & Porcelain Tiles Market Volume (Million Square Meters) and Value (US$ Mn) Forecast, by Application, 2018–2027
Table 34: Romania Ceramic & Porcelain Tiles Market Volume (Million Square Meters) and Value (US$ Mn) Forecast, by Product Type, 2018–2027
Table 35: Romania Ceramic & Porcelain Tiles Market Volume (Million Square Meters) and Value (US$ Mn) Forecast, by Usage, 2018–2027
Table 36: Romania Ceramic & Porcelain Tiles Market Volume (Million Square Meters) and Value (US$ Mn) Forecast, by Application, 2018–2027
Table 37: Netherlands Ceramic & Porcelain Tiles Market Volume (Million Square Meters) and Value (US$ Mn) Forecast, by Product Type, 2018–2027
Table 38: Netherlands Ceramic & Porcelain Tiles Market Volume (Million Square Meters) and Value (US$ Mn) Forecast, by Usage, 2018–2027
Table 39: Netherlands Ceramic & Porcelain Tiles Market Volume (Million Square Meters) and Value (US$ Mn) Forecast, by Application, 2018–2027
Table 40: Russia Ceramic & Porcelain Tiles Market Volume (Million Square Meters) and Value (US$ Mn) Forecast, by Product Type, 2018–2027
Table 41: Russia Ceramic & Porcelain Tiles Market Volume (Million Square Meters) and Value (US$ Mn) Forecast, by Usage, 2018–2027
Table 42: Russia Ceramic & Porcelain Tiles Market Volume (Million Square Meters) and Value (US$ Mn) Forecast, by Application, 2018–2027
Table 43: Turkey Ceramic & Porcelain Tiles Market Volume (Million Square Meters) and Value (US$ Mn) Forecast, by Product Type, 2018–2027
Table 44: Turkey Ceramic & Porcelain Tiles Market Volume (Million Square Meters) and Value (US$ Mn) Forecast, by Usage, 2018–2027
Table 45: Turkey Ceramic & Porcelain Tiles Market Volume (Million Square Meters) and Value (US$ Mn) Forecast, by Application, 2018–2027
Table 46: Finland Ceramic & Porcelain Tiles Market Volume (Million Square Meters) and Value (US$ Mn) Forecast, by Product Type, 2018–2027
Table 47: Finland Ceramic & Porcelain Tiles Market Volume (Million Square Meters) and Value (US$ Mn) Forecast, by Usage, 2018–2027
Table 48: Finland Ceramic & Porcelain Tiles Market Volume (Million Square Meters) and Value (US$ Mn) Forecast, by Application, 2018–2027
Table 49: Norway Ceramic & Porcelain Tiles Market Volume (Million Square Meters) and Value (US$ Mn) Forecast, by Product Type, 2018–2027
Table 50: Norway Ceramic & Porcelain Tiles Market Volume (Million Square Meters) and Value (US$ Mn) Forecast, by Usage, 2018–2027
Table 51: Norway Ceramic & Porcelain Tiles Market Volume (Million Square Meters) and Value (US$ Mn) Forecast, by Application, 2018–2027
Table 52: Sweden Ceramic & Porcelain Tiles Market Volume (Million Square Meters) and Value (US$ Mn) Forecast, by Product Type, 2018–2027
Table 53: Sweden Ceramic & Porcelain Tiles Market Volume (Million Square Meters) and Value (US$ Mn) Forecast, by Usage, 2018–2027
Table 54: Sweden Ceramic & Porcelain Tiles Market Volume (Million Square Meters) and Value (US$ Mn) Forecast, by Application, 2018–2027
Table 55: Denmark Ceramic & Porcelain Tiles Market Volume (Million Square Meters) and Value (US$ Mn) Forecast, by Product Type, 2018–2027
Table 56: Denmark Ceramic & Porcelain Tiles Market Volume (Million Square Meters) and Value (US$ Mn) Forecast, by Usage, 2018–2027
Table 57: Denmark Ceramic & Porcelain Tiles Market Volume (Million Square Meters) and Value (US$ Mn) Forecast, by Application, 2018–2027
Table 58: Rest of Europe Ceramic & Porcelain Tiles Market Volume (Million Square Meters) and Value (US$ Mn) Forecast, by Product Type, 2018–2027
Table 59: Rest of Europe Ceramic & Porcelain Tiles Market Volume (Million Square Meters) and Value (US$ Mn) Forecast, by Usage, 2018–2027
Table 60: Rest of Europe Ceramic & Porcelain Tiles Market Volume (Million Square Meters) and Value (US$ Mn) Forecast, by Application, 2018–2027
Table 61: Asia Pacific Ceramic & Porcelain Tiles Market Volume (Million Square Meters) and Value (US$ Mn) Forecast, by Product Type, 2018–2027
Table 62: Asia Pacific Ceramic & Porcelain Tiles Market Volume (Million Square Meters) and Value (US$ Mn) Forecast, by Usage, 2018–2027
Table 63: Asia Pacific Ceramic & Porcelain Tiles Market Volume (Million Square Meters) and Value (US$ Mn) Forecast, by Application, 2018–2027
Table 64: Asia Pacific Ceramic & Porcelain Tiles Market Volume (Million Square Meters) and Value (US$ Mn) Forecast, by Country and Sub-region, 2018–2027
Table 65: China Ceramic & Porcelain Tiles Market Volume (Million Square Meters) and Value (US$ Mn) Forecast, by Product Type, 2018–2027
Table 66: China Ceramic & Porcelain Tiles Market Volume (Million Square Meters) and Value (US$ Mn) Forecast, by Usage, 2018–2027
Table 67: China Ceramic & Porcelain Tiles Market Volume (Million Square Meters) and Value (US$ Mn) Forecast, by Application, 2018–2027
Table 68: Japan Ceramic & Porcelain Tiles Market Volume (Million Square Meters) and Value (US$ Mn) Forecast, by Product Type, 2018–2027
Table 69: Japan Ceramic & Porcelain Tiles Market Volume (Million Square Meters) and Value (US$ Mn) Forecast, by Usage, 2018–2027
Table 70: Japan Ceramic & Porcelain Tiles Market Volume (Million Square Meters) and Value (US$ Mn) Forecast, by Application, 2018–2027
Table 71: India Ceramic & Porcelain Tiles Market Volume (Million Square Meters) and Value (US$ Mn) Forecast, by Product Type, 2018–2027
Table 72: India Ceramic & Porcelain Tiles Market Volume (Million Square Meters) and Value (US$ Mn) Forecast, by Usage, 2018–2027
Table 73: India Ceramic & Porcelain Tiles Market Volume (Million Square Meters) and Value (US$ Mn) Forecast, by Application, 2018–2027
Table 74: ASEAN Ceramic & Porcelain Tiles Market Volume (Million Square Meters) and Value (US$ Mn) Forecast, by Product Type, 2018–2027
Table 75: ASEAN Ceramic & Porcelain Tiles Market Volume (Million Square Meters) and Value (US$ Mn) Forecast, by Usage, 2018–2027
Table 76: ASEAN Ceramic & Porcelain Tiles Market Volume (Million Square Meters) and Value (US$ Mn) Forecast, by Application, 2018–2027
Table 77: Pakistan Ceramic & Porcelain Tiles Market Volume (Million Square Meters) and Value (US$ Mn) Forecast, by Product Type, 2018–2027
Table 78: Pakistan Ceramic & Porcelain Tiles Market Volume (Million Square Meters) and Value (US$ Mn) Forecast, by Usage, 2018–2027
Table 79: Pakistan Ceramic & Porcelain Tiles Market Volume (Million Square Meters) and Value (US$ Mn) Forecast, by Application, 2018–2027
Table 80: South Korea Ceramic & Porcelain Tiles Market Volume (Million Square Meters) and Value (US$ Mn) Forecast, by Product Type, 2018–2027
Table 81: South Korea Ceramic & Porcelain Tiles Market Volume (Million Square Meters) and Value (US$ Mn) Forecast, by Usage, 2018–2027
Table 82: South Korea Ceramic & Porcelain Tiles Market Volume (Million Square Meters) and Value (US$ Mn) Forecast, by Application, 2018–2027
Table 83: Australia Ceramic & Porcelain Tiles Market Volume (Million Square Meters) and Value (US$ Mn) Forecast, by Product Type, 2018–2027
Table 84: Australia Ceramic & Porcelain Tiles Market Volume (Million Square Meters) and Value (US$ Mn) Forecast, by Usage, 2018–2027
Table 85: Australia Ceramic & Porcelain Tiles Market Volume (Million Square Meters) and Value (US$ Mn) Forecast, by Application, 2018–2027
Table 86: Rest of Asia Pacific Ceramic & Porcelain Tiles Market Volume (Million Square Meters) and Value (US$ Mn) Forecast, by Product Type, 2018–2027
Table 87: Rest of Asia Pacific Ceramic & Porcelain Tiles Market Volume (Million Square Meters) and Value (US$ Mn) Forecast, by Usage, 2018–2027
Table 88: Rest of Asia Pacific Ceramic & Porcelain Tiles Market Volume (Million Square Meters) and Value (US$ Mn) Forecast, by Application, 2018–2027
Table 89: Latin America Ceramic & Porcelain Tiles Market Volume (Million Square Meters) and Value (US$ Mn) Forecast, by Product Type, 2018–2027
Table 90: Latin America Ceramic & Porcelain Tiles Market Volume (Million Square Meters) and Value (US$ Mn) Forecast, by Usage, 2018–2027
Table 91: Latin America Ceramic & Porcelain Tiles Market Volume (Million Square Meters) and Value (US$ Mn) Forecast, by Application, 2018–2027
Table 92: Latin America Ceramic & Porcelain Tiles Market Volume (Million Square Meters) and Value (US$ Mn) Forecast, by Country and Sub-region, 2018–2027
Table 93: Brazil Ceramic & Porcelain Tiles Market Volume (Million Square Meters) and Value (US$ Mn) Forecast, by Product Type, 2018–2027
Table 94: Brazil Ceramic & Porcelain Tiles Market Volume (Million Square Meters) and Value (US$ Mn) Forecast, by Usage, 2018–2027
Table 95: Brazil Ceramic & Porcelain Tiles Market Volume (Million Square Meters) and Value (US$ Mn) Forecast, by Application, 2018–2027
Table 96: Mexico Ceramic & Porcelain Tiles Market Volume (Million Square Meters) and Value (US$ Mn) Forecast, by Product Type, 2018–2027
Table 97: Mexico Ceramic & Porcelain Tiles Market Volume (Million Square Meters) and Value (US$ Mn) Forecast, by Usage, 2018–2027
Table 98: Mexico Ceramic & Porcelain Tiles Market Volume (Million Square Meters) and Value (US$ Mn) Forecast, by Application, 2018–2027
Table 99: Rest of Latin America Ceramic & Porcelain Tiles Market Volume (Million Square Meters) and Value (US$ Mn) Forecast, by Product Type, 2018–2027
Table 100: Rest of Latin America Ceramic & Porcelain Tiles Market Volume (Million Square Meters) and Value (US$ Mn) Forecast, by Usage, 2018–2027
Table 101: Rest of Latin America Ceramic & Porcelain Tiles Market Volume (Million Square Meters) and Value (US$ Mn) Forecast, by Application, 2018–2027
Table 102: Middle East & Africa Ceramic & Porcelain Tiles Market Volume (Million Square Meters) and Value (US$ Mn) Forecast, by Product Type, 2018–2027
Table 103: Middle East & Africa Ceramic & Porcelain Tiles Market Volume (Million Square Meters) and Value (US$ Mn) Forecast, by Usage, 2018–2027
Table 104: Middle East & Africa Ceramic & Porcelain Tiles Market Volume (Million Square Meters) and Value (US$ Mn) Forecast, by Application, 2018–2027
Table 105: Middle East & Africa Ceramic & Porcelain Tiles Market Volume (Million Square Meters) and Value (US$ Mn) Forecast, by Country and Sub-region, 2018–2027
Table 106: Saudi Arabia Ceramic & Porcelain Tiles Market Volume (Million Square Meters) and Value (US$ Mn) Forecast, by Product Type, 2018–2027
Table 107: Saudi Arabia Ceramic & Porcelain Tiles Market Volume (Million Square Meters) and Value (US$ Mn) Forecast, by Usage, 2018–2027
Table 108: Saudi Arabia Ceramic & Porcelain Tiles Market Volume (Million Square Meters) and Value (US$ Mn) Forecast, by Application, 2018–2027
Table 109: UAE Ceramic & Porcelain Tiles Market Volume (Million Square Meters) and Value (US$ Mn) Forecast, by Product Type, 2018–2027
Table 110: UAE Ceramic & Porcelain Tiles Market Volume (Million Square Meters) and Value (US$ Mn) Forecast, by Usage, 2018–2027
Table 111: UAE Ceramic & Porcelain Tiles Market Volume (Million Square Meters) and Value (US$ Mn) Forecast, by Application, 2018–2027
Table 112: Oman Ceramic & Porcelain Tiles Market Volume (Million Square Meters) and Value (US$ Mn) Forecast, by Product Type, 2018–2027
Table 113: Oman Ceramic & Porcelain Tiles Market Volume (Million Square Meters) and Value (US$ Mn) Forecast, by Usage, 2018–2027
Table 114: Oman Ceramic & Porcelain Tiles Market Volume (Million Square Meters) and Value (US$ Mn) Forecast, by Application, 2018–2027
Table 115: Iraq Ceramic & Porcelain Tiles Market Volume (Million Square Meters) and Value (US$ Mn) Forecast, by Product Type, 2018–2027
Table 116: Iraq Ceramic & Porcelain Tiles Market Volume (Million Square Meters) and Value (US$ Mn) Forecast, by Usage, 2018–2027
Table 117: Iraq Ceramic & Porcelain Tiles Market Volume (Million Square Meters) and Value (US$ Mn) Forecast, by Application, 2018–2027
Table 118: Israel Ceramic & Porcelain Tiles Market Volume (Million Square Meters) and Value (US$ Mn) Forecast, by Product Type, 2018–2027
Table 119: Israel Ceramic & Porcelain Tiles Market Volume (Million Square Meters) and Value (US$ Mn) Forecast, by Usage, 2018–2027
Table 120: Israel Ceramic & Porcelain Tiles Market Volume (Million Square Meters) and Value (US$ Mn) Forecast, by Application, 2018–2027
Table 121: South Africa Ceramic & Porcelain Tiles Market Volume (Million Square Meters) and Value (US$ Mn) Forecast, by Product Type, 2018–2027
Table 122: South Africa Ceramic & Porcelain Tiles Market Volume (Million Square Meters) and Value (US$ Mn) Forecast, by Usage, 2018–2027
Table 123: South Africa Ceramic & Porcelain Tiles Market Volume (Million Square Meters) and Value (US$ Mn) Forecast, by Application, 2018–2027
Table 124: Rest of Middle East & Africa Ceramic & Porcelain Tiles Market Volume (Million Square Meters) and Value (US$ Mn) Forecast, by Product Type, 2018–2027
Table 125: Rest of Middle East & Africa Ceramic & Porcelain Tiles Market Volume (Million Square Meters) and Value (US$ Mn) Forecast, by Usage, 2018–2027
Table 126: Rest of Middle East & Africa Ceramic & Porcelain Tiles Market Volume (Million Square Meters) and Value (US$ Mn) Forecast, by Application, 2018–2027
List of Figures
Figure 01: Global Ceramic & Porcelain Tiles Pricing Range (US$/Million Square Meters), by Product, 2018-2027
Figure 02: Global Ceramic & Porcelain Tiles Pricing Range (US$/Million Square Meters), by Product, 2018-2027
Figure 03: Global Ceramic & Porcelain Tiles Pricing Range (US$/Million Square Meters), by Product, 2018-2027
Figure 04: Global Ceramic & Porcelain Tiles Pricing Range (US$/Million Square Meters), by Product, 2018-2027
Figure 05: Global Ceramic & Porcelain Tiles Pricing Range (US$/Million Square Meters), by Product, 2018-2027
Figure 06: Global Ceramic & Porcelain Tiles Market Volume Share Analysis, by Product Type, 2018, 2023, and 2027
Figure 07: Global Ceramic & Porcelain Tiles Market Attractiveness Analysis, by Product Type, 2019–2027
Figure 08: Global Ceramic & Porcelain Tiles Market Volume Share Analysis, by Usage, 2018, 2023, and 2027, 2018, 2023, and 2027
Figure 09: Global Ceramic & Porcelain Tiles Market Attractiveness Analysis, by Usage, 2019–2027, 2019–2027
Figure 10: Global Ceramic & Porcelain Tiles Market Volume Share Analysis, by Application, 2018, 2023, and 2027, 2018, 2023, and 2027
Figure 11: Global Ceramic & Porcelain Tiles Market Attractiveness Analysis, by Application, 2019–2027, 2019–2027
Figure 12: Global Ceramic & Porcelain Tiles Market Volume Share Analysis, by Region, 2018, 2023, and 2027
Figure 13: Global Ceramic & Porcelain Tiles Market Attractiveness Analysis, by Region, 2019–2027
Figure 14: North America Ceramic & Porcelain Tiles Market Volume Share Analysis, by Product Type, 2018, 2023, and 2027
Figure 15: North America Ceramic & Porcelain Tiles Market Attractiveness Analysis, by Product Type, 2019–2027
Figure 16: North America Ceramic & Porcelain Tiles Market Volume Share Analysis, by Usage, 2018, 2023, and 2027
Figure 17: North America Ceramic & Porcelain Tiles Market Attractiveness Analysis, by Usage, 2019–2027
Figure 18: North America Ceramic & Porcelain Tiles Market Volume Share Analysis, by Application, 2018, 2023, and 2027
Figure 19: North America Ceramic & Porcelain Tiles Market Attractiveness Analysis, by Application, 2019–2027
Figure 20: North America Ceramic & Porcelain Tiles Market Volume Share Analysis, by Country, 2018 and 2027
Figure 21: North America Ceramic & Porcelain Tiles Market Attractiveness Analysis, by Country
Figure 22: Europe Ceramic & Porcelain Tiles Market Volume Share Analysis, by Product Type, 2018, 2023, and 2027
Figure 23: Europe Ceramic & Porcelain Tiles Market Attractiveness Analysis, by Product Type, 2019–2027
Figure 24: Europe Ceramic & Porcelain Tiles Market Volume Share Analysis, by Usage, 2018, 2023, and 2027
Figure 25: Europe Ceramic & Porcelain Tiles Market Attractiveness Analysis, by Usage, 2019–2027
Figure 26: Europe Ceramic & Porcelain Tiles Market Volume Share Analysis, by Application, 2018, 2023, and 2027
Figure 27: Europe Ceramic & Porcelain Tiles Market Attractiveness Analysis, by Application, 2019–2027
Figure 28: Europe America Ceramic & Porcelain Tiles Market Volume Share Analysis, by Country and Sub-region, 2018, 2023, and 2027
Figure 29: America Ceramic & Porcelain Tiles Market Attractiveness Analysis, by Country and Sub-region, 2019-2027
Figure 30: Asia Pacific Ceramic & Porcelain Tiles Market Volume Share Analysis, by Product Type, 2018, 2023, and 2027
Figure 31: Asia Pacific Ceramic & Porcelain Tiles Market Attractiveness Analysis, by Product Type, 2019–2027
Figure 32: Asia Pacific Ceramic & Porcelain Tiles Market Volume Share Analysis, by Usage, 2018, 2023, and 2027
Figure 33: Asia Pacific Ceramic & Porcelain Tiles Market Attractiveness Analysis, by Usage, 2019–2027
Figure 34: Asia Pacific Ceramic & Porcelain Tiles Market Volume Share Analysis, by Application, 2018, 2023, and 2027
Figure 35: Asia Pacific Ceramic & Porcelain Tiles Market Attractiveness Analysis, by Application, 2019–2027
Figure 36: Asia Pacific Ceramic & Porcelain Tiles Market Volume Share Analysis, by Country and Sub-region, 2018, 2023, and 2027
Figure 37: Asia Pacific Ceramic & Porcelain Tiles Market Attractiveness Analysis, by Country and Sub-region, 2019-2027
Figure 38: Latin America Ceramic & Porcelain Tiles Market Volume Share Analysis, by Product Type, 2018, 2023, and 2027
Figure 39: Latin America Ceramic & Porcelain Tiles Market Attractiveness Analysis, by Product Type, 2019–2027
Figure 40: Latin America Ceramic & Porcelain Tiles Market Volume Share Analysis, by Usage, 2018, 2023, and 2027
Figure 41: Latin America Ceramic & Porcelain Tiles Market Attractiveness Analysis, by Usage, 2019–2027
Figure 42: Latin America Ceramic & Porcelain Tiles Market Volume Share Analysis, by Application, 2018, 2023, and 2027
Figure 43: Latin America Ceramic & Porcelain Tiles Market Attractiveness Analysis, by Application, 2019–2027
Figure 44: Latin America Ceramic & Porcelain Tiles Market Volume Share Analysis, by Country and Sub-region, 2018, 2023, and 2027
Figure 45: Latin America Ceramic & Porcelain Tiles Market Attractiveness Analysis, by Country and Sub-region, 2019-2027
Figure 46: Middle East & Africa Ceramic & Porcelain Tiles Market Volume Share Analysis, by Product Type, 2018, 2023, and 2027
Figure 47: Middle East & Africa Ceramic & Porcelain Tiles Market Attractiveness Analysis, by Product Type, 2019–2027
Figure 48: Middle East & Africa Ceramic & Porcelain Tiles Market Volume Share Analysis, by Usage, 2018, 2023, and 2027
Figure 49: Middle East & Africa Ceramic & Porcelain Tiles Market Attractiveness Analysis, by Usage, 2019–2027
Figure 50: Middle East & Africa Ceramic & Porcelain Tiles Market Volume Share Analysis, by Application, 2018, 2023, and 2027
Figure 51: Middle East & Africa Ceramic & Porcelain Tiles Market Attractiveness Analysis, by Application, 2019–2027
Figure 52: Middle East & Africa Ceramic & Porcelain Tiles Market Volume Share Analysis, by Country and Sub-region, 2018, 2023, and 2027
Figure 53: Middle East & Africa Ceramic & Porcelain Tiles Market Attractiveness Analysis, by Country and Sub-region, 2019-2027
Figure 54: Company Market Share Analysis, 2018
Copyright © Transparency Market Research, Inc. All Rights reserved
Trust Online

Ceramic & Porcelain Tiles Market