
Reports
Reports
Caspofungin is an antifungal drug that works by inhibiting the enzyme (1→3)-β-D-glucan synthase, thereby disturbing the integrity of the fungal cell wall. Caspofungin acetate was first approved by the U.S. Food and Drug Administration (FDA) on January 26, 2001, then by the European Medicine Agency (EMA) on October 24, 2001, and approved by Pharmaceuticals and Medicals Devices Agency of Japan (PMDA) on January 18, 2012. It was developed and marketed as Cancidas by Merck Sharp & Dohme (U.S.).
The global caspofungin market was valued at US$ 484.60 Mn in 2018 and is anticipated to reach US$ 496.20 Mn by 2027, expanding at a CAGR of 0.18% from 2019 to 2027. Rise in prevalence of candidiasis, increase in usage of echinocandins, surge in disposable income in the emerging countries, and rise in awareness among people about preventive measures of various microbial diseases are factors projected to propel the global market during the forecast period.
The incidence and prevalence of invasive candidiasis are rising significantly across the world, affecting millions of people. Increase in incidence of candidaemia in ICUs has been reported in several parts of the world. According to the Extended Prevalence in Intensive Care (EPIC) II point prevalence study, Candida spp. is the third most recurrent cause of infection in ICUs across the globe, accounting for 17% of all ICU infections in culture-positive infected patients. Moreover, according to the U.S. Department of Health & Human Services, invasive candidiasis is one of the common health care-associated infections. Around 46,000 cases of invasive candidiasis occur each year in the U.S. Candida species are ranked fifth among hospital-acquired pathogens and fourth among nosocomial blood stream infection pathogens. Increase in incidence of invasive candidiasis is expected to be a major factor likely to boost the global caspofungin market during the forecast period.
The global caspofungin market has been segmented based on indication, distribution channel, and region. In terms of indication, the candidiasis segment is projected to account for major share of the global market during the forecast period. Caspofungin has been approved as first line of treatment of patients suffering from invasive candidiasis and who are resistant to other antifungal agents. It has been also approved as first line of treatment for different forms of candidiasis such as esophageal candidiasis, intra-abdominal abscesses, peritonitis, and pleural space infections. The preferred use of caspofungin over other antifungals in certain diseases is likely to propel the market during the forecast period.
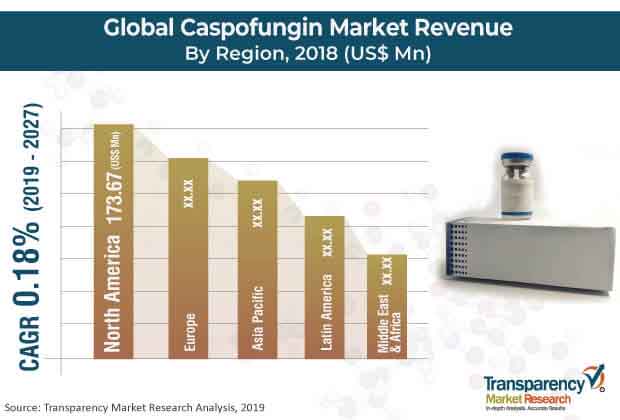
In terms of region, the global caspofungin market has been segmented into North America, Europe, Asia Pacific, Latin America, and Middle East & Africa. Developed regions such as North America and Europe accounted for leading shares of the global market in 2018. Large patient population and presence of major pharmaceutical companies can be attributed to high share of these regions. Moreover, rise in prevalence of fungal diseases and increase in the geriatric population drive the caspofungin market in North America and Europe. The market in Asia Pacific is projected to expand at a high CAGR owing to rapidly improving health care facilities in countries such as India, China, South Korea, and Malaysia. China dominated the caspofungin market in Asia Pacific in 2018. The market in India is anticipated to expand at a significant CAGR during the forecast period. Furthermore, increase in investment by leading players and introduction of generics by other players are expected to fuel the growth of the market in the region. The market in Latin America and Middle East & Africa is likely to expand at a steady pace during the forecast period.
Prominent players operating in the global caspofungin market include Teva Pharmaceutical Industries Ltd., Mylan N.V , Merck & Co., Inc., Fresenius SE & Co. KGaA , Gland Pharma Limited, and Xellia Pharmaceuticals.
Caspofungin Market - Snapshot
Caspofungin is a lipopeptide antifungal drug from Merck & Co., Inc. discovered by James Balkovec, Regina Black and Frances A. Bouffard. It is a member of a new class of antifungals termed the echinocandins. It works by inhibiting the enzyme glucan synthase and thereby disturbing the integrity of the fungal cell wall. Caspofungin was the first inhibitor of fungal glucan synthesis to be approved by the United States Food and Drug Administration.
Caspofungin is administered intravenously. It has been effective in treating fungal infections caused by Aspergillus and Candida species. It is a member of the echinocandin family, a new class of antifungal agents with broad spectrum of activity against all Candida species. In comparison to treatment with either fluconazole or Amphotericin B, all three drugs in this class have been demonstrated to be highly effective or superior in well-defined clinical settings including invasive Candida infections, Candida oesophagitis and candidaemia. Caspofungin has been shown in animal studies to have embroyotoxic properties, and therefore has been assigned to class C. It should only be given to pregnant women if the benefit to the mother clearly outweighs the potential risk to her fetus.
Its currently approved therapeutic indications by both organisations include the empirical therapy of presumed fungal infections in febrile, neutropenic adult patients and for salvage therapy in patients treatment of invasive aspergillosis in adult patients whose disease is refractory to, or who are intolerant of, other antifungal agents (i.e., conventional or lipid formulations of amphotericin B and/or itraconazole). Additionally, the FDA approval includes indication for the treatment of candidemia and some specific Candida infections (intra-abdominal abscesses, peritonitis, pleural cavity infections, and esophagitis) and the EMEA approval includes indication for the treatment of general invasive candidiasis in adult patients.
Slowly metabolized by peptide hydrolysis and N-acetylation in liver. Therefore, in case of liver impairment the dose needs to be reduced. Caspofungin also undergoes spontaneous chemical degradation to an open-ring peptide compound, L-747969. Additional metabolism involves hydrolysis into constitutive amino acids and their derivatives, including dihydroxyhomotyrosine and N-acetyl-dihydroxyhomotyrosine.
The global caspofungin market was worth US$ 484.20 Mn and is projected to reach a value of US$ 496.20 Mn by the end of 2027
Caspofungin market is anticipated to grow at a CAGR of 0.18% during the forecast period
North America accounted for a major share of the global caspofungin market
Caspofungin market is driven by rise in prevalence of chronic diseases such as cancer and diabetes, increase in the geriatric population, and surge in awareness about advanced therapies are factors anticipated to propel the market
Key players in the global caspofungin market include Teva Pharmaceutical Industries Ltd., Mylan N.V , Merck & Co., Inc., Fresenius SE & Co. KGaA , Gland Pharma Limited, and Xellia Pharmaceuticals
Section 1 Preface
1.1 Report Scope and Market Segmentation
1.2 Research Highlights
Section 2 Assumptions and Research Methodology
2.1 Assumptions
2.2 Research Methodology
Section 3 Executive Summary
3.1 Global Caspofungin Market Snapshot
3.2 Key Industry Developments
Section 4 Market Overview
4.1 Caspofungin Market Taxonomy
4.2 Caspofungin Drug Introduction
4.3 Global Caspofungin Market Size (US$ Mn) Forecast, 2017–2027
4.4 Global Caspofungin Market: Market Outlook
4.5 Rise in incidence of invasive candidiasis across the globe
4.5.1.Rise in geriatric population
4.5.2.Advantages of echinocandins over other antifungal
4.5.3.Restraints
4.5.3.1 Availability of Generic Drugs
4.5.3.2 Emergence of resistant species
4.5.4 Opportunities
4.5.4.1 Echinocandins, as first line of therapy in candidiasis
4.5.4.2 Expansion of Research and Development in Emerging Markets
Section 5 Key Insights
5.1 Clinical Trial Pipeline Analysis
5.2 Disease Prevalence & Incidence Rate globally with key countries
5.3 Supply Chain Analysis
5.4 Pricing Analysis by Manufacturers
Section 6 Global Caspofungin Market Analysis, by Indication
6.1 Key Findings
6.2 Introduction
6.3 Market Value Share Analysis, by Indication
6.4 Market Value Forecast, by Indication, 2017–2027
6.5 Market Analysis, by Indication, 2017–2027
6.5.1 Candidiasis
6.5.2 Thrush
6.6 Market Attractiveness, by Indication
Section 7 Global Caspofungin Market Analysis, by Distribution Channel
7.1 Key Findings
7.2 Introduction
7.3 Market Value Share Analysis, by Distribution Channel
7.5.1. Hospital Pharmacies
7.5.2 Retail Pharmacies
7.5.3 Online Pharmacies
7.6 Market Attractiveness, by Distribution Channel
Section 8 Global Caspofungin Market Analysis, by Region
8.1 Market Value Share Analysis, by Region
8.2 Market Forecast, by Region
8.3 Global Caspofungin Market Attractiveness Analysis, by Region
Section 9 North America Caspofungin Market Analysis
9.1 Market Overview
9.2 Market Value Share Analysis, by Indication
9.3 Caspofungin Market Forecast, by Indication
9.4 Market Value Share Analysis, by Distribution Channel
9.5 Caspofungin Market Forecast, by Distribution Channel
9.6 U.S.
9.6.1 Canada
9.7 Market Attractiveness Analysis
9.7.1 By Country
9.7.2 By Indication
9.7.3 By Distribution Channel
Section 10 Europe Caspofungin Market Analysis
10.1 Market Overview
10.2 Market Value Share Analysis, by Indication
10.3 Caspofungin Market Forecast, by Indication
10.4 Market Value Share Analysis, by Distribution Channel
10.5 Caspofungin Market Forecast, by Distribution Channel
10.6 Market Value Share Analysis, by Country/Sub-region
10.7 Market Forecast, by Country/Sub-region
10.7.1 Germany
10.7.2 U.K.
10.7.3 France
10.7.4 Spain
10.7.5 Italy
10.7.6 Rest of Europe
10.8 Market Attractiveness Analysis
10.8.1 By Country/Sub-region
10.8.2 By Indication
10.8.3 By Distribution Channel
Section 11 Asia Pacific Caspofungin Market Analysis
11.1 Market Overview
11.2 Market Value Share Analysis, by Indication
11.3 Caspofungin Market Forecast, by Indication
11.4 Market Value Share Analysis, by Distribution Channel
11.5 Caspofungin Market Forecast, by Distribution Channel
11.6 Market Value Share Analysis, by Country/Sub-region
11.7 Market Forecast, by Country/Sub-region
11.7.1 China
11.7.2 Japan
11.7.3 India
11.7.4 Australia & New Zealand
11.7.5 Rest of Asia Pacific
11.8 Market Attractiveness Analysis
11.8.1 By Country/Sub-region
11.8.2 By Indication
11.8.3 By Distribution Channel
Section 12 Latin America Caspofungin Market Analysis
12.1 Market Overview
12.2 Market Value Share Analysis, by Indication
12.3 Caspofungin Market Forecast, by Indication
12.4 Market Value Share Analysis, by Distribution Channel
12.5 Caspofungin Market Forecast, by Distribution Channel
12.6 Market Value Share Analysis, by Country/Sub-region
12.7 Market Forecast, by Country/Sub-region
12.7.1 Brazil
12.7.2 Mexico
12.7.3 Rest of Latin America
12.8 Market Attractiveness Analysis
12.8.1 By Country/Sub-region
12.8.2 By Indication
12.8.3 By Distribution Channel
Section 13 Middle East & Africa (MEA) Caspofungin Market Analysis
13.1 Market Overview
13.2 Market Value Share Analysis, by Indication
13.3 Caspofungin Market Forecast, by Indication
13.4 Market Value Share Analysis, by Distribution Channel
13.5 Caspofungin Market Forecast, by Distribution Channel
13.6 Market Value Share Analysis, by Country/Sub-region
13.7 Market Forecast, by Country/Sub-region
13.7.1 GCC Countries
13.7.2 South Africa
13.7.3 Israel
13.7.4 Rest of MEA
13.8 Market Attractiveness Analysis
13.8.1 By Country/Sub-region
13.8.2 By Indication
13.8.3 By Distribution Channel
Section 14 Company Profiles
14.1 Market Player - Competition Matrix (By Tier and Size of companies)
14.2 Market Share Analysis, by Company, 2017
14.3 Company Profile
14.3.1 Teva Pharmaceutical Industries Ltd.
14.3.1.1 Company Overview (HQ, Business Segments, Employee Strength)
14.3.1.2 Financial Overview
14.3.1.3 Product Portfolio
14.3.1.4 SWOT Analysis
14.3.1.5 Strategic Overview
14.3.2 Novartis AG
14.3.2.1 Company Overview (HQ, Business Segments, Employee Strength)
14.3.2.2 Financial Overview
14.3.2.2 Product Portfolio
14.3.2.3 SWOT Analysis
14.3.2.4 Strategic Overview
14.3.3 Mylan N.V.
14.3.3.1 Company Overview (HQ, Business Segments, Employee Strength)
14.3.3.2 Financial Overview
14.3.3.3 Product Portfolio
14.3.3.4 SWOT Analysis
14.3.3.5 Strategic Overview
14.3.4 Merck & Co., Inc.
14.3.4.1 Company Overview (HQ, Business Segments, Employee Strength)
14.3.4.2 Financial Overview
14.3.4.2 Product Portfolio
14.3.4.3 SWOT Analysis
14.3.4.4 Strategic Overview
14.3.5 Fresenius SE & Co. KGaA
14.3.5.1 Company Overview (HQ, Business Segments, Employee Strength)
14.3.5.2 Financial Overview
14.3.5.2 Product Portfolio
14.3.5.3 SWOT Analysis
14.3.5.4 Strategic Overview
14.3.6 Gland Pharma Limited (Shanghai Fosun Pharmaceutical (Group) Co., Ltd.)
14.3.6.1 Company Overview (HQ, Business Segments, Employee Strength)
14.3.6.2 Financial Overview
14.3.6.3 Product Portfolio
14.3.6.4 SWOT Analysis
14.3.6.5 Strategic Overview
14.3.7 Xellia Pharmaceuticals
14.3.7.1 Company Overview (HQ, Business Segments, Employee Strength)
14.3.7.2 Financial Overview
14.3.7.3 Product Portfolio
14.3.7.4 SWOT Analysis
14.3.7.5 Strategic Overview
Table 01: Caspofungin Brands in India and their Prices
Table 02: Caspofungin Brands in Germany and their Prices
Table 03: Pipeline Analysis, by Phase 3 Drugs
Table 04: Country Estimated Burden and Prevalence Rate of Candidiasis
Table 05: List of Prescription Products
Table 06: List of Prescription Products
Table 07: List of Generic Prescription Products
Table 08: Global Caspofungin Market Value (US$ Mn) Forecast, by Indication, 2017–2027
Table 09: Global Caspofungin Market Size (US$ Mn) Forecast, by Distribution Channel, 2017–2027
Table 10: Global Caspofungin Market Value (US$ Mn) Forecast, by Region, 2017–2027
Table 11: North America Caspofungin Market Value (US$ Mn) Forecast, by Country, 2017–2027
Table 12: North America Caspofungin Market Value (US$ Mn) Forecast, by Indication, 2017–2027
Table 13: North America Caspofungin Market Value (US$ Mn) Forecast, by Distribution Channel, 2017–2027
Table 14: Europe Caspofungin Market Value (US$ Mn) Forecast, by Country/Sub-region, 2017–2027
Table 15: Europe Caspofungin Market Value (US$ Mn) Forecast, by Indication, 2017–2027
Table 16: Europe Caspofungin Market Value (US$ Mn) Forecast, by Distribution Channel, 2017–2027
Table 17: Asia Pacific Caspofungin Market Value (US$ Mn) Forecast, by Country/Sub-region, 2017–2027
Table 18: Asia Pacific Caspofungin Market Value (US$ Mn) Forecast, by Indication, 2017–2027
Table 19: Asia Pacific Caspofungin Market Value (US$ Mn) Forecast, by Distribution Channel, 2017–2027
Table 20: Latin America Caspofungin Market Value (US$ Mn) Forecast, by Country/Sub-region, 2017–2027
Table 21: Latin America Caspofungin Market Value (US$ Mn) Forecast, by Indication, 2017–2027
Table 22: Latin America Caspofungin Market Value (US$ Mn) Forecast, by Distribution Channel, 2017–2027
Table 23: Middle East & Africa Caspofungin Market Value (US$ Mn) Forecast, by Country/Sub-region, 2017–2027
Table 24: Middle East & Africa Caspofungin Market Value (US$ Mn) Forecast, by Indication, 2017–2027
Table 25: Middle East & Africa Caspofungin Market Value (US$ Mn) Forecast, by Distribution Channel, 2017–2027
Figure 01: Global Caspofungin Market Snapshot
Figure 02: Global Caspofungin Market Value (US$ Mn) Forecast, 2019–2027
Figure 03: Market Value Share, by Indication, 2018
Figure 04: Market Value Share, by Distribution Channel, 2018
Figure 05: Market Value Share, by Region, 2018
Figure 06: Global Caspofungin Market Value Share Analysis, by Indication, 2018 and 2027
Figure 07: Global Caspofungin Market Revenue (US$ Mn) Forecast, by Candidiasis, 2019–2027
Figure 08: Global Caspofungin Market Revenue (US$ Mn) Forecast, by Thrush, 2019–2027
Figure 09: Global Caspofungin Market Attractiveness, by Indication, 2019–2027
Figure 10: Global Caspofungin Market Value Share Analysis, by Distribution Channel, 2018 and 2027
Figure 11: Global Caspofungin Market Revenue (US$ Mn), by Hospital Pharmacies, 2017–2027
Figure 12: Global Caspofungin Market Revenue (US$ Mn), by Retail Pharmacies, 2017–2027
Figure 13: Global Caspofungin Market Revenue (US$ Mn), by Online Pharmacies, 2017–2027
Figure 14: Global Caspofungin Market Attractiveness, by Distribution Channel, 2019–2027
Figure 15: Global Caspofungin Market Value Share, by Region, 2018 and 2027
Figure 16: Global Caspofungin Market Attractiveness, by Region, 2019–2027
Figure 17: North America Caspofungin Market Value (US$ Mn) Forecast, 2019–2027
Figure 18: North America Caspofungin Market Value Share, by Country, 2018 and 2027
Figure 19: North America Caspofungin Market Attractiveness, by Country, 2019–2027
Figure 20: North America Caspofungin Market Value Share Analysis, by Indication, 2018 and 2027
Figure 21: North America Caspofungin Market Attractiveness, by Indication, 2019–2027
Figure 22: North America Caspofungin Market Value Share Analysis, by Distribution Channel, 2018 and 2027
Figure 23: North America Caspofungin Market Attractiveness, by Distribution Channel, 2019–2027
Figure 24: Europe Caspofungin Market Value (US$ Mn) Forecast, 2019–2027
Figure 25: Europe Caspofungin Market Value Share, by Country/Sub-region, 2018 and 2027
Figure 26: Europe Caspofungin Market Attractiveness, by Country/Sub-region, 2019–2027
Figure 27: Europe Caspofungin Market Value Share Analysis, by Indication, 2018 and 2027
Figure 28: Europe Caspofungin Market Attractiveness, by Indication, 2019–2027
Figure 29: Europe Caspofungin Market Value Share Analysis, by Distribution Channel
Figure 30: Europe Caspofungin Market Attractiveness, by Distribution Channel, 2019–2027
Figure 31: Asia Pacific Caspofungin Market Value (US$ Mn) Forecast, 2019–2027
Figure 32: Asia Pacific Caspofungin Market Value Share, by Country/Sub-region, 2018 and 2027
Figure 33: Asia Pacific Caspofungin Market Attractiveness, by Country/Sub-region, 2019–2027
Figure 34: Asia Pacific Caspofungin Market Value Share Analysis, by Indication, 2018 and 2027
Figure 35: Asia Pacific Caspofungin Market Attractiveness, by Indication, 2019–2027
Figure 36: Asia Pacific Caspofungin Market Value Share Analysis, by Distribution Channel, 2018 and 2027
Figure 37: Asia Pacific Caspofungin Market Attractiveness, by Distribution Channel, 2019–2027
Figure 38: Latin America Caspofungin Market Value (US$ Mn) Forecast, 2019–2027
Figure 39: Latin America Caspofungin Market Value Share, by Country/Sub-region, 2018 and 2027
Figure 40: Latin America Caspofungin Market Attractiveness, by Country/Sub-region, 2019–2027
Figure 41: Latin America Caspofungin Market Value Share Analysis, by Indication, 2018 and 2027
Figure 42: Latin America Caspofungin Market Attractiveness, by Indication, 2019–2027
Figure 43: Latin America Caspofungin Market Value Share Analysis, by Distribution Channel, 2018 and 2027
Figure 44: Latin America Caspofungin Market Attractiveness, by Distribution Channel, 2019–2027
Figure 45: Middle East & Africa Caspofungin Market Value (US$ Mn) Forecast, 2019–2027
Figure 46: Middle East & Africa Caspofungin Market Value Share, by Country/Sub-region, 2018 and 2027
Figure 47: Middle East & Africa Caspofungin Market Attractiveness, by Country/Sub-region, 2019–2027
Figure 48: Middle East & Africa Caspofungin Market Value Share Analysis, by Indication, 2018 and 2027
Figure 49: Middle East & Africa Caspofungin Market Attractiveness, by Indication, 2019–2027
Figure 50: Middle East & Africa Caspofungin Market Value Share Analysis, by Distribution Channel, 2018 and 2027
Figure 51: Middle East & Africa Caspofungin Market Attractiveness, by Distribution Channel, 2019–2027
Figure 52: Teva Pharmaceutical Industries Ltd., Generic Products Revenue (US$ Mn), 2015–2018
Figure 53: Teva Pharmaceutical Industries Ltd., Generic Products Breakdown of Net Sales (%), by Business Segment, 2018
Figure 54 Teva Pharmaceutical Industries Ltd., R&D Expenses (US$ Mn), 2015–2018
Figure 55: Teva Pharmaceutical Industries Ltd. Breakdown of Generic Products Net Sales (%), by Region, 2018
Figure 56: Sandoz Division Revenue (US$ Mn), 2015–2018
Figure 57: Sandoz Division Breakdown of Net Sales (%), by Region, 2018
Figure 58: Novartis AG, R&D Expenses (US$ Mn), 2015–2018
Figure 59: Novartis AG, Breakdown of Net Sales (%), by Business Segment, 2018
Figure 60: Mylan N.V. Revenue (US$ Mn), 2015–2018
Figure 61: Mylan N.V., Breakdown of Net Sales (%), by Region, 2018
Figure 62: Mylan N.V., R&D Expenses (US$ Mn), 2015-2018
Figure 63: Merck & Co., Inc., Revenue (US$ Mn), 2015–2018
Figure 64: Merck & Co., Inc., Breakdown of Net Sales (%), by Region, 2018
Figure 65: Merck & Co., Inc., R&D Expenses (US$ Mn), 2015–2017
Figure 66: Merck & Co., Inc., Breakdown of Net Sales (%), by Business Segment, 2017
Figure 67: Fresenius Kabi AG, Revenue (US$ Mn) & Y-o-Y Growth (%), 2015–2018
Figure 68: Fresenius Kabi AG, Breakdown of Net Sales, by Region, 2018
Figure 69: Fresenius Kabi AG, R&D Expenses (US$ Mn), 2015–2018
Figure 70: Fresenius Kabi AG, Breakdown of Net Sales, by Product Segment, 2018
Figure 71: Shanghai Fosun Pharmaceutical (Group) Co., Ltd., Revenue (US$ Mn), 2015–2017
Figure 72: Shanghai Fosun Pharmaceutical (Group) Co., Ltd., Breakdown of Net Sales (%), by Business Segment, 2018
Figure 73: Shanghai Fosun Pharmaceutical (Group) Co., Ltd., R&D Expenses (US$ Mn), 2015–2017
Figure 74: Xellia Pharmaceuticals Revenue (US$ Mn), 2015–2018
Figure 75: Xellia Pharmaceuticals, Breakdown of Net Sales (%), by Region, 2018
Figure 76: Xellia Pharmaceuticals, R&D Investment (US$ Mn), 2015–2018
Figure 77: Xellia Pharmaceuticals, Breakdown of Net Sales (%), by Business Segment, 2018
Copyright © Transparency Market Research, Inc. All Rights reserved
Trust Online

Caspofungin Market