
Reports
Reports
Analysts’ Viewpoint on Body Armor Market Scenario
Rise in adoption of lightweight and robust bulletproof vests and tactical gears is driving the global body armor market. Body armor is an item or piece of clothing designed to protect the wearer against a variety of attacks. It is used to stop different types of threats such as bullets, knives, and needles, or a combination of different attacks. Body armor offers advantages such as protection against most handguns and edged weapons. It also allows security personnel to remain discreet. Companies operating in the market are focusing on manufacturing products using materials such as steel, aramid, composite ceramic, and Ultra-high-molecular-weight Polyethylene (UHMWPE) to enhance their body armor market share.
Body armor is a combination of shields, helmets, and vests worn specifically by soldiers to protect themselves from penetrating bullets, attacks, or other types of weapons. Rise in demand for protective equipment among civilians due to growth in anti-state activities and terrorism in several countries is boosting the demand for body armors. Bulletproof body armors and other military personal protective equipment are available for purchase online on various websites including SafeGuard Armor. SafeGuard clothing in the U.S. includes ballistic helmets, ballistic panels, and bullet and stab proof vests. The body armor target market includes defense, law enforcement protection, and civilians.
Increase in focus on safety of military personnel during modern warfare practices is expected to augment the body armor market during the forecast period. Counterinsurgency, counter-terrorism, and guerrilla warfare operations can cause fatal injuries. Ultra-high molecular weight polyethylene fibers in tactical combat vest platforms protect military personnel from fatal injuries. Additionally, law enforcement officers need personal armor to defend themselves from law offenders and criminals. This is boosting the demand for lightweight and robust armor protection systems. Conventional body armor is rigid and restricts fluidic movement. In response, manufacturers are introducing lightweight and flexible body armor and accessories to improve their performance. The integration of ballistic protective suits with body mapping technology ensures proper fitting and free movement when wearing these protective suits. These next-generation ballistic protection armors distribute user weight to allow free movement.
The most efficient and effective body-shielding equipment allows maximal defense with minimal additional weight. Ceramic materials such as silicon carbide (SiC) are ideal for stopping rifle bullets due to their impressive strength and hardiness. SiC can be combined with backing materials and inserted into protective vests to provide vital body protection against any high-velocity projectiles. This is expected to boost the demand for modern body armor systems. Bulletproof body armor manufacturers are offering body armors made from silicon carbide. Saint-Gobain offers custom-designed armor materials made from Hexoloy sintered SiC, a high-performance, lightweight ceramic material that is designed to protect against current and emerging ballistic threats.
Manufacturers are introducing advanced lightweight armors to provide a high level of ballistic protection and increased mobility during combat operations. In March 2022, ULBRICHTS developed special helmets that protect against bullets. ULBRICHTS focuses on preventing severe back-face deformation that could eventually lead to lethal brain trauma and death of the wearer. The product is made from titanium, polyethylene, and aramids; and offers robust protective properties while being extremely lightweight. Thus, the launch of lightweight and robust products is fueling the body armor market.
In terms of material, the global body armor market has been segregated into steel, aramid, composite ceramics, UHMWPE, and others. The steel segment dominated the global body armor market in 2021, as steel is one of the most cost-effective materials used for body armor and can withstand any kind of impact without leaving the user vulnerable. Steel is used in militaries for constructing armor plating for vehicles and body armor.
In terms of application, the global body armor market has been classified into defense, law enforcement protection, and civilians. The defense segment dominated the global body armor market in 2021 due to the rise in government investments in the military sector worldwide. Body armors are important for the protection of military personnel. Additionally, technological advancements in ceramic armor and steel protective gear are expected to fuel the segment during the forecast period.
North America dominated the global body armor market in 2021 due to the rise in gun violence and growth in cases of riots in the region. High threat of terrorist attacks is augmenting the need for better protection of military and police personnel in North America. Additionally, rise in consumer awareness about personal safety and large presence of defense and security agencies are boosting the demand for body armor in the region.
The body armor market in Asia Pacific is expected to witness significant growth due to the increase in government initiatives to strengthen defense and military sectors. China, India, and South Korea are the largest contributors to the market in the region.
The global body armor market is consolidated, with a small number of large-scale vendors controlling the majority of the share. Expansion of product portfolios and mergers and acquisitions are major body armor marketing strategies adopted by key players. ArmorSource LLC, Australian Defence Apparel Pty Ltd, BAE Systems Plc, Du Pont (E.I.) De Nemours, Honeywell International Inc., KDH Defense Systems, Inc., MKU Pvt. Ltd, Point Blank Enterprises Inc., Safariland Group, Sarkar Tactical, Survitec Group Limited, and U.S. Armor Corporation are the prominent entities operating in the market.
Each of these players has been profiled in the body armor market report based on parameters such as company overview, financial overview, business strategies, product portfolio, business segments, and recent developments.
|
Attribute |
Detail |
|
Market Size Value in 2021 |
US$ 3.8 Bn |
|
Market Forecast Value in 2031 |
US$ 5.1 Bn |
|
Growth Rate (CAGR) |
3.11% |
|
Forecast Period |
2022–2031 |
|
Historical Data Available for |
2017–2020 |
|
Quantitative Units |
US$ Bn for Value & Thousand Units for Volume |
|
Market Analysis |
It includes cross segment analysis at global as well as regional level. Furthermore, qualitative analysis includes drivers, restraints, opportunities, key trends, Porter’s Five Forces analysis, value chain analysis, and key trend analysis. |
|
Competition Landscape |
|
|
Format |
Example: Electronic (PDF) + Excel |
|
Market Segmentation |
|
|
Regions Covered |
|
|
Countries Covered |
|
|
Companies Profiled |
|
|
Customization Scope |
Available upon request |
|
Pricing |
Available upon request |
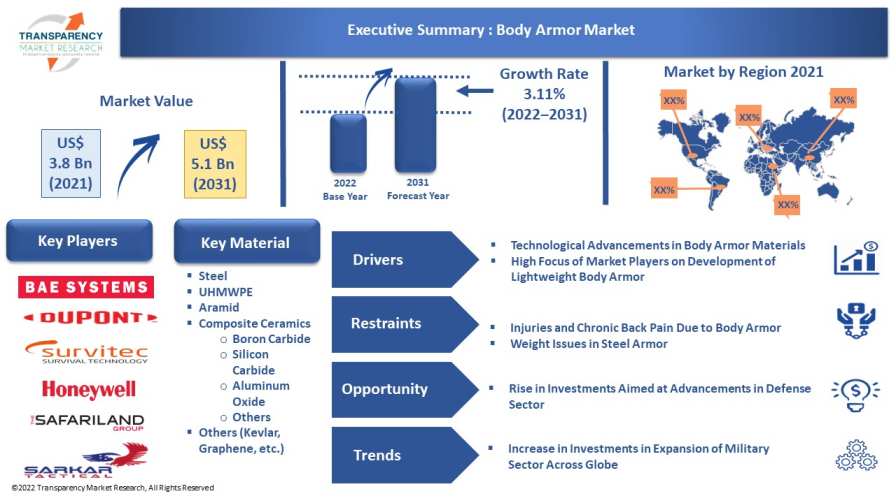
The market size of body armor stood at US$ 3.8 Bn in 2021.
The body armor market is expected to grow at a CAGR of 3.11% from 2022 to 2031.
Technological advancements in body armor materials and high focus of market players on development of lightweight body armor are key factors driving the body armor market.
The defense segment accounted for major share of 52% of the body armor market in 2021.
North America accounted for major share of 40.68% of the body armor market in 2021.
Asia Pacific accounted for 27.00% share of the body armor market in 2021.
ArmorSource LLC, Australian Defence Apparel Pty Ltd, BAE Systems Plc, Du Pont (E.I.) De Nemours, Honeywell International Inc., KDH Defense Systems, Inc., MKU Pvt. Ltd, Point Blank Enterprises Inc., Safariland Group, Sarkar Tactical, Survitec Group Limited, and U.S. Armor Corporation.
1. Preface
1.1. Market Introduction
1.2. Market and Segments Definition
1.3. Market Taxonomy
1.4. Research Methodology
1.5. Assumption and Acronyms
2. Executive Summary
2.1. Global Body Armor Market Overview
2.2. Regional Outline
2.3. Industry Outline
2.4. Market Dynamics Snapshot
2.5. Competition Blueprint
3. Market Dynamics
3.1. Macro-economic Factors
3.2. Drivers
3.3. Restraints
3.4. Opportunities
3.5. Key Trends
3.6. Regulatory Framework
4. Associated Industry and Key Indicator Assessment
4.1. Parent Industry Overview – Global Armor Systems & Security Industry Overview
4.2. Supply Chain Analysis
4.3. Pricing Analysis
4.4. Technology Roadmap Analysis
4.5. Industry SWOT Analysis
4.6. Porter Five Forces Analysis
4.7. Covid-19 Impact and Recovery Analysis
5. Global Body Armor Market Analysis, By Type
5.1. Body Armor Market Value (US$ Mn) and Volume (Thousand Units) Analysis & Forecast, By Type, 2017–2031
5.1.1. Level I
5.1.2. Level II-A
5.1.3. Level II
5.1.4. Level III-A
5.1.5. Level III
5.1.6. Level IV
5.2. Market Attractiveness Analysis, By Type
6. Global Body Armor Market Analysis, By Product Type
6.1. Body Armor Market Value (US$ Mn) and Volume (Thousand Units) Analysis & Forecast, By Product Type, 2017–2031
6.1.1. Soft Body Armor
6.1.2. Hard Body Armor
6.1.3. Accessories
6.2. Market Attractiveness Analysis, By Product Type
7. Global Body Armor Market Analysis By Material
7.1. Body Armor Market Value (US$ Mn) Analysis & Forecast, By Material, 2017–2031
7.1.1. Steel
7.1.2. UHMWPE
7.1.3. Aramid
7.1.4. Composite Ceramics
7.1.4.1. Boron Carbide
7.1.4.2. Silicon Carbide
7.1.4.3. Aluminum Oxide
7.1.4.4. Others
7.1.5. Others (Kevlar, Graphene, etc.)
7.2. Market Attractiveness Analysis, By Material
8. Global Body Armor Market Analysis, By Application
8.1. Body Armor Market Value (US$ Mn) Analysis & Forecast, By Application, 2017–2031
8.1.1. Defense
8.1.2. Law Enforcement Protection
8.1.3. Civilians
8.2. Market Attractiveness Analysis, By Application
9. Global Body Armor Market Analysis and Forecast, By Region
9.1. Body Armor Market Value (US$ Mn) and Volume (Thousand Units) Analysis & Forecast, By Region, 2017–2031
9.1.1. North America
9.1.2. Europe
9.1.3. Asia Pacific
9.1.4. Middle East & Africa
9.1.5. South America
9.2. Market Attractiveness Analysis, By Region
10. North America Body Armor Market Analysis and Forecast
10.1. Market Snapshot
10.2. Drivers and Restraints: Impact Analysis
10.3. Body Armor Market Value (US$ Mn) and Volume (Thousand Units) Analysis & Forecast, By Type, 2017–2031
10.3.1. Level I
10.3.2. Level II-A
10.3.3. Level II
10.3.4. Level III-A
10.3.5. Level III
10.3.6. Level IV
10.4. Body Armor Market Value (US$ Mn) and Volume (Thousand Units) Analysis & Forecast, By Product Type, 2017–2031
10.4.1. Soft Body Armor
10.4.2. Hard Body Armor
10.4.3. Accessories
10.5. Body Armor Market Value (US$ Mn) Analysis & Forecast, By Material, 2017–2031
10.5.1. Steel
10.5.2. UHMWPE
10.5.3. Aramid
10.5.4. Composite Ceramics
10.5.4.1. Boron Carbide
10.5.4.2. Silicon Carbide
10.5.4.3. Aluminum Oxide
10.5.4.4. Others
10.5.5. Others (Kevlar, Graphene, etc.)
10.6. Body Armor Market Value (US$ Mn) Analysis & Forecast, By Application, 2017–2031
10.6.1. Defense
10.6.2. Law Enforcement Protection
10.6.3. Civilians
10.7. Body Armor Value (US$ Mn) and Volume (Thousand Units) Analysis & Forecast, By Country and Sub-region, 2017–2031
10.7.1. The U.S.
10.7.2. Canada
10.7.3. Rest of North America
10.8. Market Attractiveness Analysis
10.8.1. By Type
10.8.2. By Product Type
10.8.3. By Material
10.8.4. By Application
10.8.5. By Country/Sub-region
11. Europe Body Armor Market Analysis and Forecast
11.1. Market Snapshot
11.2. Drivers and Restraints: Impact Analysis
11.3. Body Armor Market Value (US$ Mn) and Volume (Thousand Units) Analysis & Forecast, By Type, 2017–2031
11.3.1. Level I
11.3.2. Level II-A
11.3.3. Level II
11.3.4. Level III-A
11.3.5. Level III
11.3.6. Level IV
11.4. Body Armor Market Value (US$ Mn) and Volume (Thousand Units) Analysis & Forecast, By Product Type, 2017–2031
11.4.1. Soft Body Armor
11.4.2. Hard Body Armor
11.4.3. Accessories
11.5. Body Armor Market Value (US$ Mn) Analysis & Forecast, By Material, 2017–2031
11.5.1. Steel
11.5.2. UHMWPE
11.5.3. Aramid
11.5.4. Composite Ceramics
11.5.4.1. Boron Carbide
11.5.4.2. Silicon Carbide
11.5.4.3. Aluminum Oxide
11.5.4.4. Others
11.5.5. Others (Kevlar, Graphene, etc.)
11.6. Body Armor Market Value (US$ Mn) Analysis & Forecast, By Application, 2017–2031
11.6.1. Defense
11.6.2. Law Enforcement Protection
11.6.3. Civilians
11.7. Body Armor Value (US$ Mn) and Volume (Thousand Units) Analysis & Forecast, By Country and Sub-region, 2017–2031
11.7.1. The U.K.
11.7.2. Germany
11.7.3. France
11.7.4. Rest of Europe
11.8. Market Attractiveness Analysis
11.8.1. By Type
11.8.2. By Product Type
11.8.3. By Material
11.8.4. By Application
11.8.5. By Country/Sub-region
12. Asia Pacific Body Armor Market Analysis and Forecast
12.1. Market Snapshot
12.2. Drivers and Restraints: Impact Analysis
12.3. Body Armor Market Value (US$ Mn) and Volume (Thousand Units) Analysis & Forecast, By Type, 2017–2031
12.3.1. Level I
12.3.2. Level II-A
12.3.3. Level II
12.3.4. Level III-A
12.3.5. Level III
12.3.6. Level IV
12.4. Body Armor Market Value (US$ Mn) and Volume (Thousand Units) Analysis & Forecast, By Product Type, 2017–2031
12.4.1. Soft Body Armor
12.4.2. Hard Body Armor
12.4.3. Accessories
12.5. Body Armor Market Value (US$ Mn) Analysis & Forecast, By Material, 2017–2031
12.5.1. Steel
12.5.2. UHMWPE
12.5.3. Aramid
12.5.4. Composite Ceramics
12.5.4.1. Boron Carbide
12.5.4.2. Silicon Carbide
12.5.4.3. Aluminum Oxide
12.5.4.4. Others
12.5.5. Others (Kevlar, Graphene, etc.)
12.6. Body Armor Market Value (US$ Mn) Analysis & Forecast, By Application, 2017–2031
12.6.1. Defense
12.6.2. Law Enforcement Protection
12.6.3. Civilians
12.7. Body Armor Value (US$ Mn) and Volume (Thousand Units) Analysis & Forecast, By Country and Sub-region, 2017–2031
12.7.1. China
12.7.2. India
12.7.3. Japan
12.7.4. South Korea
12.7.5. ASEAN
12.7.6. Rest of Asia Pacific
12.8. Market Attractiveness Analysis
12.8.1. By Type
12.8.2. By Product Type
12.8.3. By Material
12.8.4. By Application
12.8.5. By Country/Sub-region
13. Middle East and Africa Body Armor Market Analysis and Forecast
13.1. Market Snapshot
13.2. Drivers and Restraints: Impact Analysis
13.3. Body Armor Market Value (US$ Mn) and Volume (Thousand Units) Analysis & Forecast, By Type, 2017–2031
13.3.1. Level I
13.3.2. Level II-A
13.3.3. Level II
13.3.4. Level III-A
13.3.5. Level III
13.3.6. Level IV
13.4. Body Armor Market Value (US$ Mn) and Volume (Thousand Units) Analysis & Forecast, By Product Type, 2017–2031
13.4.1. Soft Body Armor
13.4.2. Hard Body Armor
13.4.3. Accessories
13.5. Body Armor Market Value (US$ Mn) Analysis & Forecast, By Material, 2017–2031
13.5.1. Steel
13.5.2. UHMWPE
13.5.3. Aramid
13.5.4. Composite Ceramics
13.5.4.1. Boron Carbide
13.5.4.2. Silicon Carbide
13.5.4.3. Aluminum Oxide
13.5.4.4. Others
13.5.5. Others (Kevlar, Graphene, etc.)
13.6. Body Armor Market Value (US$ Mn) Analysis & Forecast, By Application, 2017–2031
13.6.1. Defense
13.6.2. Law Enforcement Protection
13.6.3. Civilians
13.7. Body Armor Value (US$ Mn) and Volume (Thousand Units) Analysis & Forecast, By Country and Sub-region, 2017–2031
13.7.1. GCC
13.7.2. South Africa
13.7.3. Rest of the Middle East and Africa
13.8. Market Attractiveness Analysis
13.8.1. By Type
13.8.2. By Product Type
13.8.3. By Material
13.8.4. By Application
13.8.5. By Country/Sub-region
14. South America Body Armor Market Analysis and Forecast
14.1. Market Snapshot
14.2. Drivers and Restraints: Impact Analysis
14.3. Body Armor Market Value (US$ Mn) and Volume (Thousand Units) Analysis & Forecast, By Type, 2017–2031
14.3.1. Level I
14.3.2. Level II-A
14.3.3. Level II
14.3.4. Level III-A
14.3.5. Level III
14.3.6. Level IV
14.4. Body Armor Market Value (US$ Mn) and Volume (Thousand Units) Analysis & Forecast, By Product Type, 2017–2031
14.4.1. Soft Body Armor
14.4.2. Hard Body Armor
14.4.3. Accessories
14.5. Body Armor Market Value (US$ Mn) Analysis & Forecast, By Material, 2017–2031
14.5.1. Steel
14.5.2. UHMWPE
14.5.3. Aramid
14.5.4. Composite Ceramics
14.5.4.1. Boron Carbide
14.5.4.2. Silicon Carbide
14.5.4.3. Aluminum Oxide
14.5.4.4. Others
14.5.5. Others (Kevlar, Graphene, etc.)
14.6. Body Armor Market Value (US$ Mn) Analysis & Forecast, By Application, 2017–2031
14.6.1. Defense
14.6.2. Law Enforcement Protection
14.6.3. Civilians
14.7. Body Armor Value (US$ Mn) and Volume (Thousand Units) Analysis & Forecast, By Country and Sub-region, 2017–2031
14.7.1. Brazil
14.7.2. Rest of South America
14.8. Market Attractiveness Analysis
14.8.1. By Type
14.8.2. By Product Type
14.8.3. By Material
14.8.4. By Application
14.8.5. By Country/Sub-region
15. Competition Assessment
15.1. Global Body Armor Market Competition Matrix - a Dashboard View
15.1.1. Global Body Armor Market Company Share Analysis, by Value (2021)
15.1.2. Technological Differentiator
16. Company Profiles (Global Manufacturers/Suppliers)
16.1. ArmorSource LLC
16.1.1. Overview
16.1.2. Product Portfolio
16.1.3. Sales Footprint
16.1.4. Key Subsidiaries or Distributors
16.1.5. Strategy and Recent Developments
16.1.6. Key Financials
16.2. Australian Defence Apparel Pty Ltd.
16.2.1. Overview
16.2.2. Product Portfolio
16.2.3. Sales Footprint
16.2.4. Key Subsidiaries or Distributors
16.2.5. Strategy and Recent Developments
16.2.6. Key Financials
16.3. BAE Systems Plc.
16.3.1. Overview
16.3.2. Product Portfolio
16.3.3. Sales Footprint
16.3.4. Key Subsidiaries or Distributors
16.3.5. Strategy and Recent Developments
16.3.6. Key Financials
16.4. Du Pont (E.I.) De Nemours.
16.4.1. Overview
16.4.2. Product Portfolio
16.4.3. Sales Footprint
16.4.4. Key Subsidiaries or Distributors
16.4.5. Strategy and Recent Developments
16.4.6. Key Financials
16.5. Honeywell International Inc.
16.5.1. Overview
16.5.2. Product Portfolio
16.5.3. Sales Footprint
16.5.4. Key Subsidiaries or Distributors
16.5.5. Strategy and Recent Developments
16.5.6. Key Financials
16.6. KDH Defense Systems, Inc.
16.6.1. Overview
16.6.2. Product Portfolio
16.6.3. Sales Footprint
16.6.4. Key Subsidiaries or Distributors
16.6.5. Strategy and Recent Developments
16.6.6. Key Financials
16.7. MKU Pvt. Ltd.
16.7.1. Overview
16.7.2. Product Portfolio
16.7.3. Sales Footprint
16.7.4. Key Subsidiaries or Distributors
16.7.5. Strategy and Recent Developments
16.7.6. Key Financials
16.8. Point Blank Enterprises Inc.
16.8.1. Overview
16.8.2. Product Portfolio
16.8.3. Sales Footprint
16.8.4. Key Subsidiaries or Distributors
16.8.5. Strategy and Recent Developments
16.8.6. Key Financials
16.9. Safariland Group
16.9.1. Overview
16.9.2. Product Portfolio
16.9.3. Sales Footprint
16.9.4. Key Subsidiaries or Distributors
16.9.5. Strategy and Recent Developments
16.9.6. Key Financials
16.10. Sarkar Tactical
16.10.1. Overview
16.10.2. Product Portfolio
16.10.3. Sales Footprint
16.10.4. Key Subsidiaries or Distributors
16.10.5. Strategy and Recent Developments
16.10.6. Key Financials
16.11. Survitec Group Limited
16.11.1. Overview
16.11.2. Product Portfolio
16.11.3. Sales Footprint
16.11.4. Key Subsidiaries or Distributors
16.11.5. Strategy and Recent Developments
16.11.6. Key Financials
16.12. U.S. Armor Corporation
16.12.1. Overview
16.12.2. Product Portfolio
16.12.3. Sales Footprint
16.12.4. Key Subsidiaries or Distributors
16.12.5. Strategy and Recent Developments
16.12.6. Key Financials
17. Recommendation
17.1. Opportunity Assessment
17.1.1. By Type
17.1.2. By Product Type
17.1.3. By Material
17.1.4. By Application
17.1.5. By Region
List of Tables
Table 1: Global Body Armor Market Value (US$ Mn) & Forecast, by Type, 2017‒2031
Table 2: Global Body Armor Market Volume (Thousand Unit) & Forecast, by Type, 2017‒2031
Table 3: Global Body Armor Market Value (US$ Mn) & Forecast, by Product Type, 2017‒2031
Table 4: Global Body Armor Market Volume (Thousand Unit) & Forecast, by Product Type, 2017‒2031
Table 5: Global Body Armor Market Value (US$ Mn) & Forecast, by Material, 2017‒2031
Table 6: Global Body Armor Market Value (US$ Mn) & Forecast, by Application, 2017‒2031
Table 7: Global Body Armor Market Value (US$ Mn) & Forecast, by Region, 2017‒2031
Table 8: North America Body Armor Market Value (US$ Mn) & Forecast, by Type, 2017‒2031
Table 9: North America Body Armor Market Volume (Thousand Unit) & Forecast, by Type, 2017‒2031
Table 10: North America Body Armor Market Value (US$ Mn) & Forecast, by Product Type, 2017‒2031
Table 11: North America Body Armor Market Value (US$ Mn) & Forecast, by Material, 2017‒2031
Table 12: North America Body Armor Market Value (US$ Mn) & Forecast, by Application, 2017‒2031
Table 13: North America Body Armor Market Value (US$ Mn) & Forecast, by Country and Sub-region, 2017‒2031
Table 14: Europe Body Armor Market Value (US$ Mn) & Forecast, by Type, 2017‒2031
Table 15: Europe Body Armor Market Volume (Thousand Unit) & Forecast, by Type, 2017‒2031
Table 16: Europe Body Armor Market Value (US$ Mn) & Forecast, by Product Type, 2017‒2031
Table 17: Europe Body Armor Market Volume (Thousand Unit) & Forecast, by Product Type, 2017‒2031
Table 18: Europe Body Armor Market Value (US$ Mn) & Forecast, by Material, 2017‒2031
Table 19: Europe Body Armor Market Value (US$ Mn) & Forecast, by Application, 2017‒2031
Table 20: Europe Body Armor Market Value (US$ Mn) & Forecast, by Country and Sub-region, 2017‒2031
Table 21: Asia Pacific Body Armor Market Value (US$ Mn) & Forecast, by Type, 2017‒2031
Table 22: Asia Pacific Body Armor Market Volume (Thousand Unit) & Forecast, by Type, 2017‒2031
Table 23: Asia Pacific Body Armor Market Value (US$ Mn) & Forecast, by Product Type, 2017‒2031
Table 24: Asia Pacific Body Armor Market Volume (Thousand Unit) & Forecast, by Product Type, 2017‒2031
Table 25: Asia Pacific Body Armor Market Value (US$ Mn) & Forecast, by Material, 2017‒2031
Table 26: Asia Pacific Body Armor Market Value (US$ Mn) & Forecast, by Application, 2017‒2031
Table 27: Asia Pacific Body Armor Market Value (US$ Mn) & Forecast, by Country and Sub-region, 2017‒2031
Table 28: Middle East and Africa Body Armor Market Value (US$ Mn) & Forecast, by Type, 2017‒2031
Table 29: Middle East and Africa Body Armor Market Volume (Thousand Unit) & Forecast, by Type, 2017‒2031
Table 30: Middle East and Africa Body Armor Market Value (US$ Mn) & Forecast, by Product Type, 2017‒2031
Table 31: Middle East and Africa Body Armor Market Volume (Thousand Unit) & Forecast, by Product Type, 2017‒2031
Table 32: Middle East and Africa Body Armor Market Value (US$ Mn) & Forecast, by Material, 2017‒2031
Table 33: Middle East and Africa Body Armor Market Value (US$ Mn) & Forecast, by Application, 2017‒2031
Table 34: Middle East and Africa Body Armor Market Value (US$ Mn) & Forecast, by Country and Sub-region, 2017‒2031
Table 35: South America Body Armor Market Value (US$ Mn) & Forecast, by Type, 2017‒2031
Table 36: South America Body Armor Market Volume (Thousand Unit) & Forecast, by Type, 2017‒2031
Table 37: South America Body Armor Market Value (US$ Mn) & Forecast, by Product Type, 2017‒2031
Table 38: South America Body Armor Market Volume (Thousand Unit) & Forecast, by Product Type, 2017‒2031
Table 39: South America Body Armor Market Value (US$ Mn) & Forecast, by Material, 2017‒2031
Table 40: South America Body Armor Market Value (US$ Mn) & Forecast, by Application, 2017‒2031
Table 41: South America Body Armor Market Value (US$ Mn) & Forecast, by Country and Sub-region, 2017‒2031
List of Figures
Figure 01: Supply Chain Analysis - Global Body Armor
Figure 02: Global Body Armor Price Trend Analysis (Average Price, US$)
Figure 03: Porter Five Forces Analysis - Global Body Armor
Figure 04: Technology Road Map - Global Body Armor
Figure 05: Global Body Armors Market, Value (US$ Mn), 2017-2031
Figure 06: Global Body Armor Market Size & Forecast, Y-O-Y, Value (US$ Mn), 2017‒2031
Figure 07: Global Body Armors Market, Volume (Thousand Units), 2017-2031
Figure 08: Global Body Armor Market Size & Forecast, Y-O-Y, Volume (Thousand Units), 2017‒2031
Figure 09: Global Body Armor Market Projections by Type, Value (US$ Mn), 2017‒2031
Figure 10: Global Body Armor Market, Incremental Opportunity, by Type, 2021‒2031
Figure 11: Global Body Armor Market Share Analysis, by Type, 2021 and 2031
Figure 12: Global Body Armor Market Projections by Product Type, Value (US$ Mn), 2017‒2031
Figure 13: Global Body Armor Market, Incremental Opportunity, by Product Type, 2021‒2031
Figure 14: Global Body Armor Market Share Analysis, by Product Type, 2021 and 2031
Figure 15: Global Body Armor Market Projections by Material, Value (US$ Mn), 2017‒2031
Figure 16: Global Body Armor Market, Incremental Opportunity, by Material, 2021‒2031
Figure 17: Global Body Armor Market Share Analysis, by Material, 2021 and 2031
Figure 18: Global Body Armor Market Projections by Application, Value (US$ Mn), 2017‒2031
Figure 19: Global Body Armor Market, Incremental Opportunity, by Application, 2021‒2031
Figure 20: Global Body Armor Market Share Analysis, by Application, 2021 and 2031
Figure 21: Global Body Armor Market Projections by Region, Value (US$ Mn), 2017‒2031
Figure 22: Global Body Armor Market, Incremental Opportunity, by Region, 2021‒2031
Figure 23: Global Body Armor Market Share Analysis, by Region, 2021 and 2031
Figure 24: North America Body Armor Market Size & Forecast, Value (US$ Mn), 2017‒2031
Figure 25: North America Body Armor Market Size & Forecast, Y-O-Y, Value (US$ Mn), 2017‒2031
Figure 26: North America Body Armors Market, Volume (Thousand Units), 2017-2031
Figure 27: North America Body Armor Market Size & Forecast, Y-O-Y, Volume (Thousand Units), 2017‒2031
Figure 28: North America Body Armor Market Projections by Type Value (US$ Mn), 2017‒2031
Figure 29: North America Body Armor Market, Incremental Opportunity, by Type, 2021‒2031
Figure 30: North America Body Armor Market Share Analysis, by Type, 2021 and 2031
Figure 31: North America Body Armor Market Projections by Product Type, Value (US$ Mn), 2017‒2031
Figure 32: North America Body Armor Market, Incremental Opportunity, by Product Type, 2021‒2031
Figure 33: North America Body Armor Market Share Analysis, by Product Type, 2021 and 2031
Figure 34: North America Body Armor Market Projections by Material, Value (US$ Mn), 2017‒2031
Figure 35: North America Body Armor Market, Incremental Opportunity, by Material, 2021‒2031
Figure 36: North America Body Armor Market Share Analysis, by Material, 2021 and 2031
Figure 37: North America Body Armor Market Projections by Application, Value (US$ Mn), 2017‒2031
Figure 38: North America Body Armor Market, Incremental Opportunity, by Application, 2021‒2031
Figure 39: North America Body Armor Market Share Analysis, by Application, 2021 and 2031
Figure 40: North America Body Armor Market Projections by Country and sub-region, Value (US$ Mn), 2017‒2031
Figure 41: North America Body Armor Market, Incremental Opportunity, by Country and sub-region, 2021‒2031
Figure 42: North America Body Armor Market Share Analysis, by Country and sub-region 2021 and 2031
Figure 43: Europe Body Armor Market Size & Forecast, Value (US$ Mn), 2017‒2031
Figure 44: Europe Body Armor Market Size & Forecast, Y-O-Y, Value (US$ Mn), 2017‒2031
Figure 45: Europe Body Armors Market, Volume (Thousand Units), 2017-2031
Figure 46: Europe Body Armor Market Size & Forecast, Y-O-Y, Volume (Thousand Units), 2017‒2031
Figure 47: Europe Body Armor Market Projections by Type Value (US$ Mn), 2017‒2031
Figure 48: Europe Body Armor Market, Incremental Opportunity, by Type, 2021‒2031
Figure 49: Europe Body Armor Market Share Analysis, by Type, 2021 and 2031
Figure 50: Europe Body Armor Market Projections by Product Type, Value (US$ Mn), 2017‒2031
Figure 51: Europe Body Armor Market, Incremental Opportunity, by Product Type, 2021‒2031
Figure 52: Europe Body Armor Market Share Analysis, by Product Type, 2021 and 2031
Figure 53: Europe Body Armor Market Projections by Material, Value (US$ Mn), 2017‒2031
Figure 54: Europe Body Armor Market, Incremental Opportunity, by Material, 2021‒2031
Figure 55: Europe Body Armor Market Share Analysis, by Material, 2021 and 2031
Figure 56: Europe Body Armor Market Projections by Application, Value (US$ Mn), 2017‒2031
Figure 57: Europe Body Armor Market, Incremental Opportunity, by Application, 2021‒2031
Figure 58: Europe Body Armor Market Share Analysis, by Application, 2021 and 2031
Figure 59: Europe Body Armor Market Projections by Country and sub-region, Value (US$ Mn), 2017‒2031
Figure 60: Europe Body Armor Market, Incremental Opportunity, by Country and sub-region, 2021‒2031
Figure 61: Europe Body Armor Market Share Analysis, by Country and sub-region 2021 and 2031
Figure 62: Asia Pacific Body Armor Market Size & Forecast, Value (US$ Mn), 2017‒2031
Figure 63: Asia Pacific Body Armor Market Size & Forecast, Y-O-Y, Value (US$ Mn), 2017‒2031
Figure 64: Asia Pacific Body Armors Market, Volume (Thousand Units), 2017-2031
Figure 65: Asia Pacific Body Armor Market Size & Forecast, Y-O-Y, Volume (Thousand Units), 2017‒2031
Figure 66: Asia Pacific Body Armor Market Projections by Type Value (US$ Mn), 2017‒2031
Figure 67: Asia Pacific Body Armor Market, Incremental Opportunity, by Type, 2021‒2031
Figure 68: Asia Pacific Body Armor Market Share Analysis, by Type, 2021 and 2031
Figure 69: Asia Pacific Body Armor Market Projections by Product Type, Value (US$ Mn), 2017‒2031
Figure 70: Asia Pacific Body Armor Market, Incremental Opportunity, by Product Type, 2021‒2031
Figure 71: Asia Pacific Body Armor Market Share Analysis, by Product Type, 2021 and 2031
Figure 72: Asia Pacific Body Armor Market Projections by Material, Value (US$ Mn), 2017‒2031
Figure 73: Asia Pacific Body Armor Market, Incremental Opportunity, by Material, 2021‒2031
Figure 74: Asia Pacific Body Armor Market Share Analysis, by Material, 2021 and 2031
Figure 75: Asia Pacific Body Armor Market Projections by Application, Value (US$ Mn), 2017‒2031
Figure 76: Asia Pacific Body Armor Market, Incremental Opportunity, by Application, 2021‒2031
Figure 77: Asia Pacific Body Armor Market Share Analysis, by Application, 2021 and 2031
Figure 78: Asia Pacific Body Armor Market Projections by Country and sub-region, Value (US$ Mn), 2017‒2031
Figure 79: Asia Pacific Body Armor Market, Incremental Opportunity, by Country and sub-region, 2021‒2031
Figure 80: Asia Pacific Body Armor Market Share Analysis, by Country and sub-region 2021 and 2031
Figure 81: MEA Body Armor Market Size & Forecast, Value (US$ Mn), 2017‒2031
Figure 82: MEA Body Armor Market Size & Forecast, Y-O-Y, Value (US$ Mn), 2017‒2031
Figure 83: MEA Body Armors Market, Volume (Thousand Units), 2017-2031
Figure 84: MEA Body Armor Market Size & Forecast, Y-O-Y, Volume (Thousand Units), 2017‒2031
Figure 85: MEA Body Armor Market Projections by Type Value (US$ Mn), 2017‒2031
Figure 86: MEA Body Armor Market, Incremental Opportunity, by Type, 2021‒2031
Figure 87: MEA Body Armor Market Share Analysis, by Type, 2021 and 2031
Figure 88: MEA Body Armor Market Projections by Product Type, Value (US$ Mn), 2017‒2031
Figure 89: MEA Body Armor Market, Incremental Opportunity, by Product Type, 2021‒2031
Figure 90: MEA Body Armor Market Share Analysis, by Product Type, 2021 and 2031
Figure 91: MEA Body Armor Market Projections by Material, Value (US$ Mn), 2017‒2031
Figure 92: MEA Body Armor Market, Incremental Opportunity, by Material, 2021‒2031
Figure 93: MEA Body Armor Market Share Analysis, by Material, 2021 and 2031
Figure 94: MEA Body Armor Market Projections by Application, Value (US$ Mn), 2017‒2031
Figure 95: MEA Body Armor Market, Incremental Opportunity, by Application, 2021‒2031
Figure 96: MEA Body Armor Market Share Analysis, by Application, 2021 and 2031
Figure 97: MEA Body Armor Market Projections by Country and sub-region, Value (US$ Mn), 2017‒2031
Figure 98: MEA Body Armor Market, Incremental Opportunity, by Country and sub-region, 2021‒2031
Figure 99: MEA Body Armor Market Share Analysis, by Country and sub-region 2021 and 2031
Figure 100: South America Body Armor Market Size & Forecast, Value (US$ Mn), 2017‒2031
Figure 101: South America Body Armor Market Size & Forecast, Y-O-Y, Value (US$ Mn), 2017‒2031
Figure 102: South America Body Armors Market, Volume (Thousand Units), 2017-2031
Figure 103: South America Body Armor Market Size & Forecast, Y-O-Y, Volume (Thousand Units), 2017‒2031
Figure 104: South America Body Armor Market Projections by Type Value (US$ Mn), 2017‒2031
Figure 105: South America Body Armor Market, Incremental Opportunity, by Type, 2021‒2031
Figure 106: South America Body Armor Market Share Analysis, by Type, 2021 and 2031
Figure 107: South America Body Armor Market Projections by Product Type, Value (US$ Mn), 2017‒2031
Figure 108: South America Body Armor Market, Incremental Opportunity, by Product Type, 2021‒2031
Figure 109: South America Body Armor Market Share Analysis, by Product Type, 2021 and 2031
Figure 110: South America Body Armor Market Projections by Material, Value (US$ Mn), 2017‒2031
Figure 111: South America Body Armor Market, Incremental Opportunity, by Material, 2021‒2031
Figure 112: South America Body Armor Market Share Analysis, by Material, 2021 and 2031
Figure 113: South America Body Armor Market Projections by Application, Value (US$ Mn), 2017‒2031
Figure 114: South America Body Armor Market, Incremental Opportunity, by Application, 2021‒2031
Figure 115: South America Body Armor Market Share Analysis, by Application, 2021 and 2031
Figure 116: South America Body Armor Market Projections by Country and sub-region, Value (US$ Mn), 2017‒2031
Figure 117: South America Body Armor Market, Incremental Opportunity, by Country and sub-region, 2021‒2031
Figure 118: South America Body Armor Market Share Analysis, by Country and sub-region 2021 and 2031
Figure 119: Global Body Armors Market Competition
Figure 120: Global Body Armor Market Company Share Analysis
Copyright © Transparency Market Research, Inc. All Rights reserved
Trust Online

Body Armor Market