
Reports
Reports
The wide versatility of the use of plastics in bags and sacks and their inadequate disposal have added to the vastly rising pollution problem of traditional, petroleum-based plastics world over. Made from a variety of all-natural plant materials such as polylactic acids (PLAs), polyhydroxyalkanoates (PHAs), and corn, biodegradable bags and sacks also contain additives to facilitate degradation and hence pose lesser impact on the ecology in general and marine life in particular. These bags are being preferred over conventional plastic products, notably for the food packaging and fast-moving consumer goods. Furthermore, the use of biodegradable plastics is found to be promising in addressing the problem of plastics pollution in several developed and emerging countries, which is expected to catalyze the growth of the market. The substantial demand for ecofriendly and reusable plastic sacks and bags in the retail industry is a prominent factor bolstering the adoption of these bags. The declining price of key raw materials used in making biodegradable plastics in several countries is likely to bode well for the market.
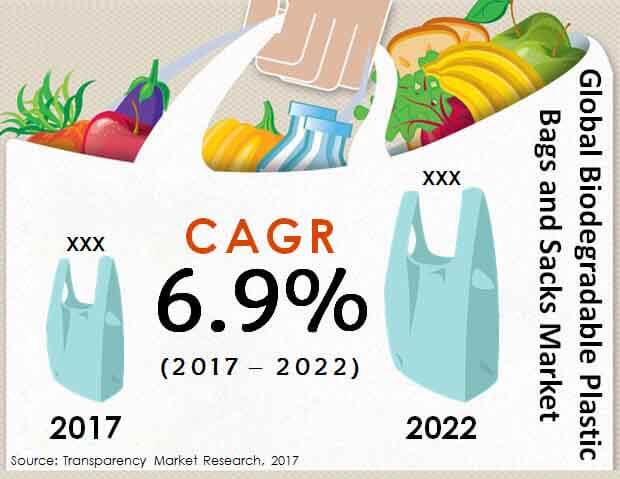
The global biodegradable plastic bags and sacks market is estimated to clock a CAGR of 6.9% during 2017-2022. The market is anticipated to be worth US$1,470.5 Mn by 2017 end and is projected to reach US$2,052.2 Mn by the end of the assessment period.
The various types of materials used in making biodegradable plastic bags and sacks are PLA, PHA, and starch blends. Of these, the PHA material segment dominates the market, holding a major share of 35.9% in 2017. The segment is projected to rise from a valuation of US$565.5 Mn to reach US$788.7 Mn by the end of 2022, representing a share of 36.1% of the market. The PHA segment is estimated to expand at a CAGR of 6.9% during 2017-2022. The annual growth of the segment is pegged at US$44.7 Mn over 2017-2022, representing an absolute growth greater than all other material segments. The dominant adoption of polyhydroxyalkanoates is attributed to their better degradability and the possibility of a wide variety of their applications in making biodegradable plastic bags and sacks. In addition, blending them with polymers has been proven to be cost-effective for manufacturers, which is likely to bolster their uptake.
The major regional markets for biodegradable plastic bags and sacks are North America, the Middle East and Africa (MEA), Latin America, Asia Pacific excluding Japan (APEJ), Japan, and Europe. Of these, Europe leads the pack currently and is likely to retain its dominance in the coming years as well. The prominence of this regional market is attributed to the extensive demand for eco-friendly and recyclable plastic packaging for industrial applications. In addition, the soaring awareness of the pollution problem associated with the use of bags made from traditional plastics is a striking factor boosting the regional market. The Europe biodegradable plastic bags and sacks market is anticipated to reach a valuation of US$660.8 Mn by 2022 end, rising at a CAGR of 7.1% during 2017-2022. The demand for photodegradable and oxydegradable plastics in several developed countries is also bolstering the uptake.
The APEJ biodegradable plastic bags and sacks market is expected to reach valuation of US$503.8 Mn by 2022 end, rising at a notable CAGR of 7.8% during the forecast period. The vastly rising demand for biodegradable plastic bags and sacks in this region is expected to mainly come from a burgeoning retail sector.
A number of emerging and established players are focused on launching high-performance products and resorting to mergers and acquisitions, in order to gain a better foothold in the global biodegradable plastic bags and sacks market. Prominent players operating in the market include Novolex, Shabra Group, Xtex Polythene Ltd., International Plastics Inc., Ampac Holdings LLC, Bulldog Bag Ltd., Abbey Polyethene, Sahachit Watana Plastic Industry Co.,Ltd., Sarah Bio Plast, Symphony Polymers Pvt Ltd., EXTRAPACK Ltd., Dagoplast AS, JUNER Plastic packaging Co., and Wells Plastics Ltd.
Biodegradable Plastic Bags and Snacks Market to Gain Traction with Increasing Demand for Eco-friendly Products
Biodegradable plastic is obtained from various parts of a plant such as corn, polylactic acids or PLAs, polyhydroxyalkanoates or PHAs, and others. This is further expected to aid in expansion of the global biodegradable plastic bags and snacks market in the years to come. The wide flexibility of the utilization of plastics in bags and sacks and their deficient removal have added to the limitlessly rising contamination issue of conventional, petrol based plastics world over.
Biodegradable bags and sacks additionally contain added substances to encourage corruption and henceforth present lesser effect on the biology all in all and marine life specifically. These bags are being liked over traditional plastic items, strikingly for the food bundling and quick buyer merchandise. Besides, the utilization of biodegradable plastics is discovered to be promising in tending to the issue of plastics contamination in a few created and arising nations, which is required to catalyze the development of the market. The growing penetration of ecofriendly and reusable plastic sacks and bags in the retail business is a noticeable factor supporting the appropriation of these bags. The declining cost of key crude materials utilized in making biodegradable plastics in a few nations is probably going to look good for the market.
The geographical classification of the global biodegradable plastic bags and snacks market denotes the domination of Europe on account of the stringent environmental regulations imposed on nations and rising inclination towards biodegradable products. Moreover, the people of this region are well aware of the after effects of pollution, diseases that it brings forth, and therefore are more inclined towards eco-friendly products. This is further expected to help this region continue generating notable revenues for the market in the years to come. On the other side, the market in Asia Pacific is likely to witness notable growth rates owing to the increasing demand for biodegradable plastic bags and sacks in the emerging as well as under-developed nations all around the region.
The global Biodegradable Plastic Bags and Sacks market is expected to reach US$2,052.2 Mn by the end of 2022
The Biodegradable Plastic Bags and Sacks Market is growing at a CAGR of 6.9% during 2017–2022
The major applications in Biodegradable Plastic Bags and Sacks market include Retail & Consumer, Institutional, and Industrial
The leading companies in the Biodegradable Plastic Bags and Sacks market include Novolex, Shabra Group, Xtex Polythene Ltd., International Plastics Inc., Ampac Holdings LLC, Bulldog Bag Ltd., Abbey Polyethene, Sahachit Watana Plastic Industry Co.,Ltd., Sarah Bio Plast, Symphony Polymers Pvt Ltd., EXTRAPACK Ltd., Dagoplast AS, JUNER Plastic packaging Co., and Wells Plastics Ltd.
Europe is dominating the global market and expected to dominate over the forecast period by expanding with CAGR of 7.1% to reach the valuation of US$660.8 mn by the end of 2022.
1. Global Biodegradable Plastic Bags & Sacks Market - Executive Summary
2. Global Biodegradable Plastic Bags & Sacks Market Overview
2.1. Introduction
2.1.1. Global Biodegradable Plastic Bags & Sacks Market Taxonomy
2.1.2. Global Biodegradable Plastic Bags & Sacks Market Definition
2.2. Global Biodegradable Plastic Bags & Sacks Market Size (US$ Mn) and Forecast, 2012-2022
2.2.1. Global Biodegradable Plastic Bags & Sacks Market Y-o-Y Growth
2.3. Global Biodegradable Plastic Bags & Sacks Market Dynamics
2.4. Supply Chain
2.5. Cost Structure
2.6. Pricing Analysis
2.7. Raw Material Sourcing Strategy and Analysis
2.8. List of Distributors
2.9. Key Participants Market Presence (Intensity Map) By Region
3. Global Biodegradable Plastic Bags & Sacks Market Analysis and Forecast By Material Type
3.1. Global Biodegradable Plastic Bags & Sacks Market Size and Forecast By Material Type, 2012-2022
3.1.1. PLA Market Size and Forecast, 2012-2022
3.1.1.1. Revenue (US$ Mn) Comparison, By Region
3.1.1.2. Market Share Comparison, By Region
3.1.1.3. Y-o-Y growth Comparison, By Region
3.1.2. PHA Market Size and Forecast, 2012-2022
3.1.2.1. Revenue (US$ Mn) Comparison, By Region
3.1.2.2. Market Share Comparison, By Region
3.1.2.3. Y-o-Y growth Comparison, By Region
3.1.3. Starch Blends Market Size and Forecast, 2012-2022
3.1.3.1. Revenue (US$ Mn) Comparison, By Region
3.1.3.2. Market Share Comparison, By Region
3.1.3.3. Y-o-Y growth Comparison, By Region
3.1.4. Others Market Size and Forecast, 2012-2022
3.1.4.1. Revenue (US$ Mn) Comparison, By Region
3.1.4.2. Market Share Comparison, By Region
3.1.4.3. Y-o-Y growth Comparison, By Region
4. Global Biodegradable Plastic Bags & Sacks Market Analysis and Forecast By Product Type
4.1. Global Biodegradable Plastic Bags & Sacks Market Size and Forecast By Product Type, 2012-2022
4.1.1. T Shirt Bags Market Size and Forecast, 2012-2022
4.1.1.1. Revenue (US$ Mn) Comparison, By Region
4.1.1.2. Market Share Comparison, By Region
4.1.1.3. Y-o-Y growth Comparison, By Region
4.1.2. Gusseted Bags Market Size and Forecast, 2012-2022
4.1.2.1. Revenue (US$ Mn) Comparison, By Region
4.1.2.2. Market Share Comparison, By Region
4.1.2.3. Y-o-Y growth Comparison, By Region
4.1.3. Lay Flat Bags Market Size and Forecast, 2012-2022
4.1.3.1. Revenue (US$ Mn) Comparison, By Region
4.1.3.2. Market Share Comparison, By Region
4.1.3.3. Y-o-Y growth Comparison, By Region
4.1.4. Trash Bags Market Size and Forecast, 2012-2022
4.1.4.1. Revenue (US$ Mn) Comparison, By Region
4.1.4.2. Market Share Comparison, By Region
4.1.4.3. Y-o-Y growth Comparison, By Region
4.1.5. Rubble Sacks Market Size and Forecast, 2012-2022
4.1.5.1. Revenue (US$ Mn) Comparison, By Region
4.1.5.2. Market Share Comparison, By Region
4.1.5.3. Y-o-Y growth Comparison, By Region
4.1.6. Woven Sacks Market Size and Forecast, 2012-2022
4.1.6.1. Revenue (US$ Mn) Comparison, By Region
4.1.6.2. Market Share Comparison, By Region
4.1.6.3. Y-o-Y growth Comparison, By Region
4.1.7. Others Market Size and Forecast, 2012-2022
4.1.7.1. Revenue (US$ Mn) Comparison, By Region
4.1.7.2. Market Share Comparison, By Region
4.1.7.3. Y-o-Y growth Comparison, By Region
5. Global Biodegradable Plastic Bags & Sacks Market Analysis and Forecast By End User
5.1. Global Biodegradable Plastic Bags & Sacks Market Size and Forecast By End User, 2012-2022
5.1.1. Retail & Consumer Market Size and Forecast, 2012-2022
5.1.1.1. Revenue (US$ Mn) Comparison, By Region
5.1.1.2. Market Share Comparison, By Region
5.1.1.3. Y-o-Y growth Comparison, By Region
5.1.2. Institutional Market Size and Forecast, 2012-2022
5.1.2.1. Revenue (US$ Mn) Comparison, By Region
5.1.2.2. Market Share Comparison, By Region
5.1.2.3. Y-o-Y growth Comparison, By Region
5.1.3. Industrial Market Size and Forecast, 2012-2022
5.1.3.1. Revenue (US$ Mn) Comparison, By Region
5.1.3.2. Market Share Comparison, By Region
5.1.3.3. Y-o-Y growth Comparison, By Region
6. Global Biodegradable Plastic Bags & Sacks Market Analysis and Forecast By Region
6.1. Global Biodegradable Plastic Bags & Sacks Market Size and Forecast, 2012-2022
6.1.1. North America Biodegradable Plastic Bags & Sacks Market Size and Forecast, 2012-2022
6.1.1.1. Revenue (US$ Mn) Comparison, By Material Type
6.1.1.2. Revenue (US$ Mn) Comparison, By Product Type
6.1.1.3. Revenue (US$ Mn) Comparison, By End User
6.1.2. Latin America Biodegradable Plastic Bags & Sacks Market Size and Forecast, 2012-2022
6.1.2.1. Revenue (US$ Mn) Comparison, By Material Type
6.1.2.2. Revenue (US$ Mn) Comparison, By Product Type
6.1.2.3. Revenue (US$ Mn) Comparison, By End User
6.1.3. Europe Biodegradable Plastic Bags & Sacks Market Size and Forecast, 2012-2022
6.1.3.1. Revenue (US$ Mn) Comparison, By Material Type
6.1.3.2. Revenue (US$ Mn) Comparison, By Product Type
6.1.3.3. Revenue (US$ Mn) Comparison, By End User
6.1.4. Japan Biodegradable Plastic Bags & Sacks Market Size and Forecast, 2012-2022
6.1.4.1. Revenue (US$ Mn) Comparison, By Material Type
6.1.4.2. Revenue (US$ Mn) Comparison, By Product Type
6.1.4.3. Revenue (US$ Mn) Comparison, By End User
6.1.5. APEJ Biodegradable Plastic Bags & Sacks Market Size and Forecast, 2012-2022
6.1.5.1. Revenue (US$ Mn) Comparison, By Material Type
6.1.5.2. Revenue (US$ Mn) Comparison, By Product Type
6.1.5.3. Revenue (US$ Mn) Comparison, By End User
6.1.6. MEA Biodegradable Plastic Bags & Sacks Market Size and Forecast, 2012-2022
6.1.6.1. Revenue (US$ Mn) Comparison, By Material Type
6.1.6.2. Revenue (US$ Mn) Comparison, By Product Type
6.1.6.3. Revenue (US$ Mn) Comparison, By End User
7. North America Biodegradable Plastic Bags & Sacks Market Analysis and Forecast, By Country, 2012-2022
7.1. US Biodegradable Plastic Bags & Sacks Market Size and Forecast, 2012-2022
7.1.1. Revenue (US$ Mn) Comparison, By Material Type
7.1.2. Revenue (US$ Mn) Comparison, By Product Type
7.1.3. Revenue (US$ Mn) Comparison, By End User
7.2. Canada Biodegradable Plastic Bags & Sacks Market Size and Forecast, 2012-2022
7.2.1. Revenue (US$ Mn) Comparison, By Material Type
7.2.2. Revenue (US$ Mn) Comparison, By Product Type
7.2.3. Revenue (US$ Mn) Comparison, By End User
8. Latin America Biodegradable Plastic Bags & Sacks Market Analysis and Forecast, By Country, 2012-2022
8.1. Brazil Biodegradable Plastic Bags & Sacks Market Size and Forecast, 2012-2022
8.1.1. Revenue (US$ Mn) Comparison, By Material Type
8.1.2. Revenue (US$ Mn) Comparison, By Product Type
8.1.3. Revenue (US$ Mn) Comparison, By End User
8.2. Mexico Biodegradable Plastic Bags & Sacks Market Size and Forecast, 2012-2022
8.2.1. Revenue (US$ Mn) Comparison, By Material Type
8.2.2. Revenue (US$ Mn) Comparison, By Product Type
8.2.3. Revenue (US$ Mn) Comparison, By End User
8.3. Rest of Latin America Biodegradable Plastic Bags & Sacks Market Size and Forecast, 2012-2022
8.3.1. Revenue (US$ Mn) Comparison, By Material Type
8.3.2. Revenue (US$ Mn) Comparison, By Product Type
8.3.3. Revenue (US$ Mn) Comparison, By End User
9. Europe Biodegradable Plastic Bags & Sacks Market Analysis and Forecast, By Country, 2012-2022
9.1. Germany Biodegradable Plastic Bags & Sacks Market Size and Forecast, 2012-2022
9.1.1. Revenue (US$ Mn) Comparison, By Material Type
9.1.2. Revenue (US$ Mn) Comparison, By Product Type
9.1.3. Revenue (US$ Mn) Comparison, By End User
9.2. UK Biodegradable Plastic Bags & Sacks Market Size and Forecast, 2012-2022
9.2.1. Revenue (US$ Mn) Comparison, By Material Type
9.2.2. Revenue (US$ Mn) Comparison, By Product Type
9.2.3. Revenue (US$ Mn) Comparison, By End User
9.3. France Biodegradable Plastic Bags & Sacks Market Size and Forecast, 2012-2022
9.3.1. Revenue (US$ Mn) Comparison, By Material Type
9.3.2. Revenue (US$ Mn) Comparison, By Product Type
9.3.3. Revenue (US$ Mn) Comparison, By End User
9.4. Russia Biodegradable Plastic Bags & Sacks Market Size and Forecast, 2012-2022
9.4.1. Revenue (US$ Mn) Comparison, By Material Type
9.4.2. Revenue (US$ Mn) Comparison, By Product Type
9.4.3. Revenue (US$ Mn) Comparison, By End User
9.5. Italy Biodegradable Plastic Bags & Sacks Market Size and Forecast, 2012-2022
9.5.1. Revenue (US$ Mn) Comparison, By Material Type
9.5.2. Revenue (US$ Mn) Comparison, By Product Type
9.5.3. Revenue (US$ Mn) Comparison, By End User
9.6. Rest of Europe Biodegradable Plastic Bags & Sacks Market Size and Forecast, 2012-2022
9.6.1. Revenue (US$ Mn) Comparison, By Material Type
9.6.2. Revenue (US$ Mn) Comparison, By Product Type
9.6.3. Revenue (US$ Mn) Comparison, By End User
10. Japan Biodegradable Plastic Bags & Sacks Market Analysis and Forecast, By Country, 2012-2022
10.1. Japan Biodegradable Plastic Bags & Sacks Market Size and Forecast, 2012-2022
10.1.1. Revenue (US$ Mn) Comparison, By Material Type
10.1.2. Revenue (US$ Mn) Comparison, By Product Type
10.1.3. Revenue (US$ Mn) Comparison, By End User
11. APEJ Biodegradable Plastic Bags & Sacks Market Analysis and Forecast, By Country, 2012-2022
11.1. China Biodegradable Plastic Bags & Sacks Market Size and Forecast, 2012-2022
11.1.1. Revenue (US$ Mn) Comparison, By Material Type
11.1.2. Revenue (US$ Mn) Comparison, By Product Type
11.1.3. Revenue (US$ Mn) Comparison, By End User
11.2. India Biodegradable Plastic Bags & Sacks Market Size and Forecast, 2012-2022
11.2.1. Revenue (US$ Mn) Comparison, By Material Type
11.2.2. Revenue (US$ Mn) Comparison, By Product Type
11.2.3. Revenue (US$ Mn) Comparison, By End User
11.3. Malaysia Biodegradable Plastic Bags & Sacks Market Size and Forecast, 2012-2022
11.3.1. Revenue (US$ Mn) Comparison, By Material Type
11.3.2. Revenue (US$ Mn) Comparison, By Product Type
11.3.3. Revenue (US$ Mn) Comparison, By End User
11.4. Thailand Biodegradable Plastic Bags & Sacks Market Size and Forecast, 2012-2022
11.4.1. Revenue (US$ Mn) Comparison, By Material Type
11.4.2. Revenue (US$ Mn) Comparison, By Product Type
11.4.3. Revenue (US$ Mn) Comparison, By End User
11.5. Australia & New Zealand Biodegradable Plastic Bags & Sacks Market Size and Forecast, 2012-2022
11.5.1. Revenue (US$ Mn) Comparison, By Material Type
11.5.2. Revenue (US$ Mn) Comparison, By Product Type
11.5.3. Revenue (US$ Mn) Comparison, By End User
11.6. Rest of APEJ Biodegradable Plastic Bags & Sacks Market Size and Forecast, 2012-2022
11.6.1. Revenue (US$ Mn) Comparison, By Material Type
11.6.2. Revenue (US$ Mn) Comparison, By Product Type
11.6.3. Revenue (US$ Mn) Comparison, By End User
12. MEA Biodegradable Plastic Bags & Sacks Market Analysis and Forecast, By Country, 2012-2022
12.1. GCC Countries Biodegradable Plastic Bags & Sacks Market Size and Forecast, 2012-2022
12.1.1. Revenue (US$ Mn) Comparison, By Material Type
12.1.2. Revenue (US$ Mn) Comparison, By Product Type
12.1.3. Revenue (US$ Mn) Comparison, By End User
12.2. South Africa Biodegradable Plastic Bags & Sacks Market Size and Forecast, 2012-2022
12.2.1. Revenue (US$ Mn) Comparison, By Material Type
12.2.2. Revenue (US$ Mn) Comparison, By Product Type
12.2.3. Revenue (US$ Mn) Comparison, By End User
12.3. Israel Biodegradable Plastic Bags & Sacks Market Size and Forecast, 2012-2022
12.3.1. Revenue (US$ Mn) Comparison, By Material Type
12.3.2. Revenue (US$ Mn) Comparison, By Product Type
12.3.3. Revenue (US$ Mn) Comparison, By End User
12.4. Rest of MEA Biodegradable Plastic Bags & Sacks Market Size and Forecast, 2012-2022
12.4.1. Revenue (US$ Mn) Comparison, By Material Type
12.4.2. Revenue (US$ Mn) Comparison, By Product Type
12.4.3. Revenue (US$ Mn) Comparison, By End User
13. Global Biodegradable Plastic Bags & Sacks Market Company Share, Competition Landscape and Company Profiles
13.1. Company Share Analysis
13.2. Competition Landscape
13.3. Company Profiles
13.3.1. Novolex
13.3.2. Xtex Polythene LTD
13.3.3. Shabra Group
13.3.4. Ampac Holdings LLC
13.3.5. International Plastics Inc.
13.3.6. Bulldog Bag Ltd.
13.3.7. Abbey Polyethene
13.3.8. Sahachit Watana Plastic Industry Co.,Ltd
13.3.9. Sarah Bio Plast
13.3.10. JUNER Plastic packaging Co.,
13.3.11. Hanoi Plastic Bag Jsc
13.3.12. Symphony Polymers Pvt Ltd
13.3.13. EXTRAPACK Ltd.
13.3.14. Dagoplast AS
13.3.15. Wells Plastics Ltd.
14. Research Methodology
15. Secondary and Primary Sources
16. Assumptions and Acronyms
17. Disclaimer
List of Tables
TABLE 1 Global Biodegradable Plastic Bags & Sacks Market Value (US$ Mn), 2012-2016
TABLE 2 Global Biodegradable Plastic Bags & Sacks Market Value (US$ Mn), 2017-2022
TABLE 3 Global Biodegradable Plastic Bags & Sacks Market Value (US$ Mn) and Y-o-Y, 2015-2022
TABLE 4 Global PLA Segment Value (US$ Mn), By Region 2012-2016
TABLE 5 Global PLA Segment Value (US$ Mn), By Region 2017-2022
TABLE 6 Global PLA Segment Market Share, By Region 2012-2016
TABLE 7 Global PLA Segment Market Share, By Region 2017-2022
TABLE 8 Global PLA Segment Y-o-Y, By Region 2015-2022
TABLE 9 Global PHA Segment Value (US$ Mn), By Region 2012-2016
TABLE 10 Global PHA Segment Value (US$ Mn), By Region 2017-2022
TABLE 11 Global PHA Segment Market Share, By Region 2012-2016
TABLE 12 Global PHA Segment Market Share, By Region 2017-2022
TABLE 13 Global PHA Segment Y-o-Y, By Region 2015-2022
TABLE 14 Global Starch Blends Segment Value (US$ Mn), By Region 2012-2016
TABLE 15 Global Starch Blends Segment Value (US$ Mn), By Region 2017-2022
TABLE 16 Global Starch Blends Segment Market Share, By Region 2012-2016
TABLE 17 Global Starch Blends Segment Market Share, By Region 2017-2022
TABLE 18 Global Starch Blends Segment Y-o-Y, By Region 2015-2022
TABLE 19 Global Others Segment Value (US$ Mn), By Region 2012-2016
TABLE 20 Global Others Segment Value (US$ Mn), By Region 2017-2022
TABLE 21 Global Others Segment Market Share, By Region 2012-2016
TABLE 22 Global Others Segment Market Share, By Region 2017-2022
TABLE 23 Global Others Segment Y-o-Y, By Region 2015-2022
TABLE 24 Global T Shirt Bags Segment Value (US$ Mn), By Region 2012-2016
TABLE 25 Global T Shirt Bags Segment Value (US$ Mn), By Region 2017-2022
TABLE 26 Global T Shirt Bags Segment Market Share, By Region 2012-2016
TABLE 27 Global T Shirt Bags Segment Market Share, By Region 2017-2022
TABLE 28 Global T Shirt Bags Segment Y-o-Y, By Region 2015-2022
TABLE 29 Global Gusseted Bags Segment Value (US$ Mn), By Region 2012-2016
TABLE 30 Global Gusseted Bags Segment Value (US$ Mn), By Region 2017-2022
TABLE 31 Global Gusseted Bags Segment Market Share, By Region 2012-2016
TABLE 32 Global Gusseted Bags Segment Market Share, By Region 2017-2022
TABLE 33 Global Gusseted Bags Segment Y-o-Y, By Region 2015-2022
TABLE 34 Global Lay Flat Bags Segment Value (US$ Mn), By Region 2012-2016
TABLE 35 Global Lay Flat Bags Segment Value (US$ Mn), By Region 2017-2022
TABLE 36 Global Lay Flat Bags Segment Market Share, By Region 2012-2016
TABLE 37 Global Lay Flat Bags Segment Market Share, By Region 2017-2022
TABLE 38 Global Lay Flat Bags Segment Y-o-Y, By Region 2015-2022
TABLE 39 Global Trash Bags Segment Value (US$ Mn), By Region 2012-2016
TABLE 40 Global Trash Bags Segment Value (US$ Mn), By Region 2017-2022
TABLE 41 Global Trash Bags Segment Market Share, By Region 2012-2016
TABLE 42 Global Trash Bags Segment Market Share, By Region 2017-2022
TABLE 43 Global Trash Bags Segment Y-o-Y, By Region 2015-2022
TABLE 44 Global Rubble Sacks Segment Value (US$ Mn), By Region 2012-2016
TABLE 45 Global Rubble Sacks Segment Value (US$ Mn), By Region 2017-2022
TABLE 46 Global Rubble Sacks Segment Market Share, By Region 2012-2016
TABLE 47 Global Rubble Sacks Segment Market Share, By Region 2017-2022
TABLE 48 Global Rubble Sacks Segment Y-o-Y, By Region 2015-2022
TABLE 49 Global Woven Sacks Segment Value (US$ Mn), By Region 2012-2016
TABLE 50 Global Woven Sacks Segment Value (US$ Mn), By Region 2017-2022
TABLE 51 Global Woven Sacks Segment Market Share, By Region 2012-2016
TABLE 52 Global Woven Sacks Segment Market Share, By Region 2017-2022
TABLE 53 Global Woven Sacks Segment Y-o-Y, By Region 2015-2022
TABLE 54 Global Others Segment Value (US$ Mn), By Region 2012-2016
TABLE 55 Global Others Segment Value (US$ Mn), By Region 2017-2022
TABLE 56 Global Others Segment Market Share, By Region 2012-2016
TABLE 57 Global Others Segment Market Share, By Region 2017-2022
TABLE 58 Global Others Segment Y-o-Y, By Region 2015-2022
TABLE 59 Global Retail & Consumer Segment Value (US$ Mn), By Region 2012-2016
TABLE 60 Global Retail & Consumer Segment Value (US$ Mn), By Region 2017-2022
TABLE 61 Global Retail & Consumer Segment Market Share, By Region 2012-2016
TABLE 62 Global Retail & Consumer Segment Market Share, By Region 2017-2022
TABLE 63 Global Retail & Consumer Segment Y-o-Y, By Region 2015-2022
TABLE 64 Global Institutional Segment Value (US$ Mn), By Region 2012-2016
TABLE 65 Global Institutional Segment Value (US$ Mn), By Region 2017-2022
TABLE 66 Global Institutional Segment Market Share, By Region 2012-2016
TABLE 67 Global Institutional Segment Market Share, By Region 2017-2022
TABLE 68 Global Institutional Segment Y-o-Y, By Region 2015-2022
TABLE 69 Global Industrial Segment Value (US$ Mn), By Region 2012-2016
TABLE 70 Global Industrial Segment Value (US$ Mn), By Region 2017-2022
TABLE 71 Global Industrial Segment Market Share, By Region 2012-2016
TABLE 72 Global Industrial Segment Market Share, By Region 2017-2022
TABLE 73 Global Industrial Segment Y-o-Y, By Region 2015-2022
TABLE 74 North America Biodegradable Plastic Bags & Sacks Market Value (US$ Mn), By Material Type 2012-2016
TABLE 75 North America Biodegradable Plastic Bags & Sacks Market Value (US$ Mn), By Material Type 2017-2022
TABLE 76 North America Biodegradable Plastic Bags & Sacks Market Value (US$ Mn), By Product Type 2012-2016
TABLE 77 North America Biodegradable Plastic Bags & Sacks Market Value (US$ Mn), By Product Type 2017-2022
TABLE 78 North America Biodegradable Plastic Bags & Sacks Market Value (US$ Mn), By End User 2012-2016
TABLE 79 North America Biodegradable Plastic Bags & Sacks Market Value (US$ Mn), By End User 2017-2022
TABLE 80 Latin America Biodegradable Plastic Bags & Sacks Market Value (US$ Mn), By Material Type 2012-2016
TABLE 81 Latin America Biodegradable Plastic Bags & Sacks Market Value (US$ Mn), By Material Type 2017-2022
TABLE 82 Latin America Biodegradable Plastic Bags & Sacks Market Value (US$ Mn), By Product Type 2012-2016
TABLE 83 Latin America Biodegradable Plastic Bags & Sacks Market Value (US$ Mn), By Product Type 2017-2022
TABLE 84 Latin America Biodegradable Plastic Bags & Sacks Market Value (US$ Mn), By End User 2012-2016
TABLE 85 Latin America Biodegradable Plastic Bags & Sacks Market Value (US$ Mn), By End User 2017-2022
TABLE 86 Europe Biodegradable Plastic Bags & Sacks Market Value (US$ Mn), By Material Type 2012-2016
TABLE 87 Europe Biodegradable Plastic Bags & Sacks Market Value (US$ Mn), By Material Type 2017-2022
TABLE 88 Europe Biodegradable Plastic Bags & Sacks Market Value (US$ Mn), By Product Type 2012-2016
TABLE 89 Europe Biodegradable Plastic Bags & Sacks Market Value (US$ Mn), By Product Type 2017-2022
TABLE 90 Europe Biodegradable Plastic Bags & Sacks Market Value (US$ Mn), By End User 2012-2016
TABLE 91 Europe Biodegradable Plastic Bags & Sacks Market Value (US$ Mn), By End User 2017-2022
TABLE 92 Japan Biodegradable Plastic Bags & Sacks Market Value (US$ Mn), By Material Type 2012-2016
TABLE 93 Japan Biodegradable Plastic Bags & Sacks Market Value (US$ Mn), By Material Type 2017-2022
TABLE 94 Japan Biodegradable Plastic Bags & Sacks Market Value (US$ Mn), By Product Type 2012-2016
TABLE 95 Japan Biodegradable Plastic Bags & Sacks Market Value (US$ Mn), By Product Type 2017-2022
TABLE 96 Japan Biodegradable Plastic Bags & Sacks Market Value (US$ Mn), By End User 2012-2016
TABLE 97 Japan Biodegradable Plastic Bags & Sacks Market Value (US$ Mn), By End User 2017-2022
TABLE 98 APEJ Biodegradable Plastic Bags & Sacks Market Value (US$ Mn), By Material Type 2012-2016
TABLE 99 APEJ Biodegradable Plastic Bags & Sacks Market Value (US$ Mn), By Material Type 2017-2022
TABLE 100 APEJ Biodegradable Plastic Bags & Sacks Market Value (US$ Mn), By Product Type 2012-2016
TABLE 101 APEJ Biodegradable Plastic Bags & Sacks Market Value (US$ Mn), By Product Type 2017-2022
TABLE 102 APEJ Biodegradable Plastic Bags & Sacks Market Value (US$ Mn), By End User 2012-2016
TABLE 103 APEJ Biodegradable Plastic Bags & Sacks Market Value (US$ Mn), By End User 2017-2022
TABLE 104 MEA Biodegradable Plastic Bags & Sacks Market Value (US$ Mn), By Material Type 2012-2016
TABLE 105 MEA Biodegradable Plastic Bags & Sacks Market Value (US$ Mn), By Material Type 2017-2022
TABLE 106 MEA Biodegradable Plastic Bags & Sacks Market Value (US$ Mn), By Product Type 2012-2016
TABLE 107 MEA Biodegradable Plastic Bags & Sacks Market Value (US$ Mn), By Product Type 2017-2022
TABLE 108 MEA Biodegradable Plastic Bags & Sacks Market Value (US$ Mn), By End User 2012-2016
TABLE 109 MEA Biodegradable Plastic Bags & Sacks Market Value (US$ Mn), By End User 2017-2022
TABLE 110 US Biodegradable Plastic Bags & Sacks Market Value (US$ Mn), By Material Type 2012-2016
TABLE 111 US Biodegradable Plastic Bags & Sacks Market Value (US$ Mn), By Material Type 2017-2022
TABLE 112 US Biodegradable Plastic Bags & Sacks Market Value (US$ Mn), By Product Type 2012-2016
TABLE 113 US Biodegradable Plastic Bags & Sacks Market Value (US$ Mn), By Product Type 2017-2022
TABLE 114 US Biodegradable Plastic Bags & Sacks Market Value (US$ Mn), By End User 2012-2016
TABLE 115 US Biodegradable Plastic Bags & Sacks Market Value (US$ Mn), By End User 2017-2022
TABLE 116 Canada Biodegradable Plastic Bags & Sacks Market Value (US$ Mn), By Material Type 2012-2016
TABLE 117 Canada Biodegradable Plastic Bags & Sacks Market Value (US$ Mn), By Material Type 2017-2022
TABLE 118 Canada Biodegradable Plastic Bags & Sacks Market Value (US$ Mn), By Product Type 2012-2016
TABLE 119 Canada Biodegradable Plastic Bags & Sacks Market Value (US$ Mn), By Product Type 2017-2022
TABLE 120 Canada Biodegradable Plastic Bags & Sacks Market Value (US$ Mn), By End User 2012-2016
TABLE 121 Canada Biodegradable Plastic Bags & Sacks Market Value (US$ Mn), By End User 2017-2022
TABLE 122 Brazil Biodegradable Plastic Bags & Sacks Market Value (US$ Mn), By Material Type 2012-2016
TABLE 123 Brazil Biodegradable Plastic Bags & Sacks Market Value (US$ Mn), By Material Type 2017-2022
TABLE 124 Brazil Biodegradable Plastic Bags & Sacks Market Value (US$ Mn), By Product Type 2012-2016
TABLE 125 Brazil Biodegradable Plastic Bags & Sacks Market Value (US$ Mn), By Product Type 2017-2022
TABLE 126 Brazil Biodegradable Plastic Bags & Sacks Market Value (US$ Mn), By End User 2012-2016
TABLE 127 Brazil Biodegradable Plastic Bags & Sacks Market Value (US$ Mn), By End User 2017-2022
TABLE 128 Mexico Biodegradable Plastic Bags & Sacks Market Value (US$ Mn), By Material Type 2012-2016
TABLE 129 Mexico Biodegradable Plastic Bags & Sacks Market Value (US$ Mn), By Material Type 2017-2022
TABLE 130 Mexico Biodegradable Plastic Bags & Sacks Market Value (US$ Mn), By Product Type 2012-2016
TABLE 131 Mexico Biodegradable Plastic Bags & Sacks Market Value (US$ Mn), By Product Type 2017-2022
TABLE 132 Mexico Biodegradable Plastic Bags & Sacks Market Value (US$ Mn), By End User 2012-2016
TABLE 133 Mexico Biodegradable Plastic Bags & Sacks Market Value (US$ Mn), By End User 2017-2022
TABLE 134 Rest of Latin America Biodegradable Plastic Bags & Sacks Market Value (US$ Mn), By Material Type 2012-2016
TABLE 135 Rest of Latin America Biodegradable Plastic Bags & Sacks Market Value (US$ Mn), By Material Type 2017-2022
TABLE 136 Rest of Latin America Biodegradable Plastic Bags & Sacks Market Value (US$ Mn), By Product Type 2012-2016
TABLE 137 Rest of Latin America Biodegradable Plastic Bags & Sacks Market Value (US$ Mn), By Product Type 2017-2022
TABLE 138 Rest of Latin America Biodegradable Plastic Bags & Sacks Market Value (US$ Mn), By End User 2012-2016
TABLE 139 Rest of Latin America Biodegradable Plastic Bags & Sacks Market Value (US$ Mn), By End User 2017-2022
TABLE 140 Germany Biodegradable Plastic Bags & Sacks Market Value (US$ Mn), By Material Type 2012-2016
TABLE 141 Germany Biodegradable Plastic Bags & Sacks Market Value (US$ Mn), By Material Type 2017-2022
TABLE 142 Germany Biodegradable Plastic Bags & Sacks Market Value (US$ Mn), By Product Type 2012-2016
TABLE 143 Germany Biodegradable Plastic Bags & Sacks Market Value (US$ Mn), By Product Type 2017-2022
TABLE 144 Germany Biodegradable Plastic Bags & Sacks Market Value (US$ Mn), By End User 2012-2016
TABLE 145 Germany Biodegradable Plastic Bags & Sacks Market Value (US$ Mn), By End User 2017-2022
TABLE 146 UK Biodegradable Plastic Bags & Sacks Market Value (US$ Mn), By Material Type 2012-2016
TABLE 147 UK Biodegradable Plastic Bags & Sacks Market Value (US$ Mn), By Material Type 2017-2022
TABLE 148 UK Biodegradable Plastic Bags & Sacks Market Value (US$ Mn), By Product Type 2012-2016
TABLE 149 UK Biodegradable Plastic Bags & Sacks Market Value (US$ Mn), By Product Type 2017-2022
TABLE 150 UK Biodegradable Plastic Bags & Sacks Market Value (US$ Mn), By End User 2012-2016
TABLE 151 UK Biodegradable Plastic Bags & Sacks Market Value (US$ Mn), By End User 2017-2022
TABLE 152 France Biodegradable Plastic Bags & Sacks Market Value (US$ Mn), By Material Type 2012-2016
TABLE 153 France Biodegradable Plastic Bags & Sacks Market Value (US$ Mn), By Material Type 2017-2022
TABLE 154 France Biodegradable Plastic Bags & Sacks Market Value (US$ Mn), By Product Type 2012-2016
TABLE 155 France Biodegradable Plastic Bags & Sacks Market Value (US$ Mn), By Product Type 2017-2022
TABLE 156 France Biodegradable Plastic Bags & Sacks Market Value (US$ Mn), By End User 2012-2016
TABLE 157 France Biodegradable Plastic Bags & Sacks Market Value (US$ Mn), By End User 2017-2022
TABLE 158 Russia Biodegradable Plastic Bags & Sacks Market Value (US$ Mn), By Material Type 2012-2016
TABLE 159 Russia Biodegradable Plastic Bags & Sacks Market Value (US$ Mn), By Material Type 2017-2022
TABLE 160 Russia Biodegradable Plastic Bags & Sacks Market Value (US$ Mn), By Product Type 2012-2016
TABLE 161 Russia Biodegradable Plastic Bags & Sacks Market Value (US$ Mn), By Product Type 2017-2022
TABLE 162 Russia Biodegradable Plastic Bags & Sacks Market Value (US$ Mn), By End User 2012-2016
TABLE 163 Russia Biodegradable Plastic Bags & Sacks Market Value (US$ Mn), By End User 2017-2022
TABLE 164 Italy Biodegradable Plastic Bags & Sacks Market Value (US$ Mn), By Material Type 2012-2016
TABLE 165 Italy Biodegradable Plastic Bags & Sacks Market Value (US$ Mn), By Material Type 2017-2022
TABLE 166 Italy Biodegradable Plastic Bags & Sacks Market Value (US$ Mn), By Product Type 2012-2016
TABLE 167 Italy Biodegradable Plastic Bags & Sacks Market Value (US$ Mn), By Product Type 2017-2022
TABLE 168 Italy Biodegradable Plastic Bags & Sacks Market Value (US$ Mn), By End User 2012-2016
TABLE 169 Italy Biodegradable Plastic Bags & Sacks Market Value (US$ Mn), By End User 2017-2022
TABLE 170 Rest of Europe Biodegradable Plastic Bags & Sacks Market Value (US$ Mn), By Material Type 2012-2016
TABLE 171 Rest of Europe Biodegradable Plastic Bags & Sacks Market Value (US$ Mn), By Material Type 2017-2022
TABLE 172 Rest of Europe Biodegradable Plastic Bags & Sacks Market Value (US$ Mn), By Product Type 2012-2016
TABLE 173 Rest of Europe Biodegradable Plastic Bags & Sacks Market Value (US$ Mn), By Product Type 2017-2022
TABLE 174 Rest of Europe Biodegradable Plastic Bags & Sacks Market Value (US$ Mn), By End User 2012-2016
TABLE 175 Rest of Europe Biodegradable Plastic Bags & Sacks Market Value (US$ Mn), By End User 2017-2022
TABLE 176 Japan Biodegradable Plastic Bags & Sacks Market Value (US$ Mn), By Material Type 2012-2016
TABLE 177 Japan Biodegradable Plastic Bags & Sacks Market Value (US$ Mn), By Material Type 2017-2022
TABLE 178 Japan Biodegradable Plastic Bags & Sacks Market Value (US$ Mn), By Product Type 2012-2016
TABLE 179 Japan Biodegradable Plastic Bags & Sacks Market Value (US$ Mn), By Product Type 2017-2022
TABLE 180 Japan Biodegradable Plastic Bags & Sacks Market Value (US$ Mn), By End User 2012-2016
TABLE 181 Japan Biodegradable Plastic Bags & Sacks Market Value (US$ Mn), By End User 2017-2022
TABLE 182 China Biodegradable Plastic Bags & Sacks Market Value (US$ Mn), By Material Type 2012-2016
TABLE 183 China Biodegradable Plastic Bags & Sacks Market Value (US$ Mn), By Material Type 2017-2022
TABLE 184 China Biodegradable Plastic Bags & Sacks Market Value (US$ Mn), By Product Type 2012-2016
TABLE 185 China Biodegradable Plastic Bags & Sacks Market Value (US$ Mn), By Product Type 2017-2022
TABLE 186 China Biodegradable Plastic Bags & Sacks Market Value (US$ Mn), By End User 2012-2016
TABLE 187 China Biodegradable Plastic Bags & Sacks Market Value (US$ Mn), By End User 2017-2022
TABLE 188 India Biodegradable Plastic Bags & Sacks Market Value (US$ Mn), By Material Type 2012-2016
TABLE 189 India Biodegradable Plastic Bags & Sacks Market Value (US$ Mn), By Material Type 2017-2022
TABLE 190 India Biodegradable Plastic Bags & Sacks Market Value (US$ Mn), By Product Type 2012-2016
TABLE 191 India Biodegradable Plastic Bags & Sacks Market Value (US$ Mn), By Product Type 2017-2022
TABLE 192 India Biodegradable Plastic Bags & Sacks Market Value (US$ Mn), By End User 2012-2016
TABLE 193 India Biodegradable Plastic Bags & Sacks Market Value (US$ Mn), By End User 2017-2022
TABLE 194 Malaysia Biodegradable Plastic Bags & Sacks Market Value (US$ Mn), By Material Type 2012-2016
TABLE 195 Malaysia Biodegradable Plastic Bags & Sacks Market Value (US$ Mn), By Material Type 2017-2022
TABLE 196 Malaysia Biodegradable Plastic Bags & Sacks Market Value (US$ Mn), By Product Type 2012-2016
TABLE 197 Malaysia Biodegradable Plastic Bags & Sacks Market Value (US$ Mn), By Product Type 2017-2022
TABLE 198 Malaysia Biodegradable Plastic Bags & Sacks Market Value (US$ Mn), By End User 2012-2016
TABLE 199 Malaysia Biodegradable Plastic Bags & Sacks Market Value (US$ Mn), By End User 2017-2022
TABLE 200 Thailand Biodegradable Plastic Bags & Sacks Market Value (US$ Mn), By Material Type 2012-2016
TABLE 201 Thailand Biodegradable Plastic Bags & Sacks Market Value (US$ Mn), By Material Type 2017-2022
TABLE 202 Thailand Biodegradable Plastic Bags & Sacks Market Value (US$ Mn), By Product Type 2012-2016
TABLE 203 Thailand Biodegradable Plastic Bags & Sacks Market Value (US$ Mn), By Product Type 2017-2022
TABLE 204 Thailand Biodegradable Plastic Bags & Sacks Market Value (US$ Mn), By End User 2012-2016
TABLE 205 Thailand Biodegradable Plastic Bags & Sacks Market Value (US$ Mn), By End User 2017-2022
TABLE 206 Australia & New Zealand Biodegradable Plastic Bags & Sacks Market Value (US$ Mn), By Material Type 2012-2016
TABLE 207 Australia & New Zealand Biodegradable Plastic Bags & Sacks Market Value (US$ Mn), By Material Type 2017-2022
TABLE 208 Australia & New Zealand Biodegradable Plastic Bags & Sacks Market Value (US$ Mn), By Product Type 2012-2016
TABLE 209 Australia & New Zealand Biodegradable Plastic Bags & Sacks Market Value (US$ Mn), By Product Type 2017-2022
TABLE 210 Australia & New Zealand Biodegradable Plastic Bags & Sacks Market Value (US$ Mn), By End User 2012-2016
TABLE 211 Australia & New Zealand Biodegradable Plastic Bags & Sacks Market Value (US$ Mn), By End User 2017-2022
TABLE 212 Rest of APEJ Biodegradable Plastic Bags & Sacks Market Value (US$ Mn), By Material Type 2012-2016
TABLE 213 Rest of APEJ Biodegradable Plastic Bags & Sacks Market Value (US$ Mn), By Material Type 2017-2022
TABLE 214 Rest of APEJ Biodegradable Plastic Bags & Sacks Market Value (US$ Mn), By Product Type 2012-2016
TABLE 215 Rest of APEJ Biodegradable Plastic Bags & Sacks Market Value (US$ Mn), By Product Type 2017-2022
TABLE 216 Rest of APEJ Biodegradable Plastic Bags & Sacks Market Value (US$ Mn), By End User 2012-2016
TABLE 217 Rest of APEJ Biodegradable Plastic Bags & Sacks Market Value (US$ Mn), By End User 2017-2022
TABLE 218 GCC Countries Biodegradable Plastic Bags & Sacks Market Value (US$ Mn), By Material Type 2012-2016
TABLE 219 GCC Countries Biodegradable Plastic Bags & Sacks Market Value (US$ Mn), By Material Type 2017-2022
TABLE 220 GCC Countries Biodegradable Plastic Bags & Sacks Market Value (US$ Mn), By Product Type 2012-2016
TABLE 221 GCC Countries Biodegradable Plastic Bags & Sacks Market Value (US$ Mn), By Product Type 2017-2022
TABLE 222 GCC Countries Biodegradable Plastic Bags & Sacks Market Value (US$ Mn), By End User 2012-2016
TABLE 223 GCC Countries Biodegradable Plastic Bags & Sacks Market Value (US$ Mn), By End User 2017-2022
TABLE 224 South Africa Biodegradable Plastic Bags & Sacks Market Value (US$ Mn), By Material Type 2012-2016
TABLE 225 South Africa Biodegradable Plastic Bags & Sacks Market Value (US$ Mn), By Material Type 2017-2022
TABLE 226 South Africa Biodegradable Plastic Bags & Sacks Market Value (US$ Mn), By Product Type 2012-2016
TABLE 227 South Africa Biodegradable Plastic Bags & Sacks Market Value (US$ Mn), By Product Type 2017-2022
TABLE 228 South Africa Biodegradable Plastic Bags & Sacks Market Value (US$ Mn), By End User 2012-2016
TABLE 229 South Africa Biodegradable Plastic Bags & Sacks Market Value (US$ Mn), By End User 2017-2022
TABLE 230 Israel Biodegradable Plastic Bags & Sacks Market Value (US$ Mn), By Material Type 2012-2016
TABLE 231 Israel Biodegradable Plastic Bags & Sacks Market Value (US$ Mn), By Material Type 2017-2022
TABLE 232 Israel Biodegradable Plastic Bags & Sacks Market Value (US$ Mn), By Product Type 2012-2016
TABLE 233 Israel Biodegradable Plastic Bags & Sacks Market Value (US$ Mn), By Product Type 2017-2022
TABLE 234 Israel Biodegradable Plastic Bags & Sacks Market Value (US$ Mn), By End User 2012-2016
TABLE 235 Israel Biodegradable Plastic Bags & Sacks Market Value (US$ Mn), By End User 2017-2022
TABLE 236 Rest of MEA Biodegradable Plastic Bags & Sacks Market Value (US$ Mn), By Material Type 2012-2016
TABLE 237 Rest of MEA Biodegradable Plastic Bags & Sacks Market Value (US$ Mn), By Material Type 2017-2022
TABLE 238 Rest of MEA Biodegradable Plastic Bags & Sacks Market Value (US$ Mn), By Product Type 2012-2016
TABLE 239 Rest of MEA Biodegradable Plastic Bags & Sacks Market Value (US$ Mn), By Product Type 2017-2022
TABLE 240 Rest of MEA Biodegradable Plastic Bags & Sacks Market Value (US$ Mn), By End User 2012-2016
TABLE 241 Rest of MEA Biodegradable Plastic Bags & Sacks Market Value (US$ Mn), By End User 2017-2022
List of Figures
FIG. 1 Global Biodegradable Plastic Bags & Sacks Market Value (US$ Mn), 2012-2016
FIG. 2 Global Biodegradable Plastic Bags & Sacks Market Value (US$ Mn) Forecast, 2017-2022
FIG. 3 Global Biodegradable Plastic Bags & Sacks Market Value (US$ Mn) and Y-o-Y, 2015-2022
FIG. 4 Global PLA Segment Market Value (US$ Mn) By Region, 2012-2016
FIG. 5 Global PLA Segment Market Value (US$ Mn) By Region, 2017-2022
FIG. 6 Global PLA Segment Y-o-Y Growth Rate, By Region, 2015-2022
FIG. 7 Global PHA Segment Market Value (US$ Mn) By Region, 2012-2016
FIG. 8 Global PHA Segment Market Value (US$ Mn) By Region, 2017-2022
FIG. 9 Global PHA Segment Y-o-Y Growth Rate, By Region, 2015-2022
FIG. 10 Global Starch Blends Segment Market Value (US$ Mn) By Region, 2012-2016
FIG. 11 Global Starch Blends Segment Market Value (US$ Mn) By Region, 2017-2022
FIG. 12 Global Starch Blends Segment Y-o-Y Growth Rate, By Region, 2015-2022
FIG. 13 Global Others Segment Market Value (US$ Mn) By Region, 2012-2016
FIG. 14 Global Others Segment Market Value (US$ Mn) By Region, 2017-2022
FIG. 15 Global Others Segment Y-o-Y Growth Rate, By Region, 2015-2022
FIG. 16 Global T Shirt Bags Segment Market Value (US$ Mn) By Region, 2012-2016
FIG. 17 Global T Shirt Bags Segment Market Value (US$ Mn) By Region, 2017-2022
FIG. 18 Global T Shirt Bags Segment Y-o-Y Growth Rate, By Region, 2015-2022
FIG. 19 Global Gusseted Bags Segment Market Value (US$ Mn) By Region, 2012-2016
FIG. 20 Global Gusseted Bags Segment Market Value (US$ Mn) By Region, 2017-2022
FIG. 21 Global Gusseted Bags Segment Y-o-Y Growth Rate, By Region, 2015-2022
FIG. 22 Global Lay Flat Bags Segment Market Value (US$ Mn) By Region, 2012-2016
FIG. 23 Global Lay Flat Bags Segment Market Value (US$ Mn) By Region, 2017-2022
FIG. 24 Global Lay Flat Bags Segment Y-o-Y Growth Rate, By Region, 2015-2022
FIG. 25 Global Trash Bags Segment Market Value (US$ Mn) By Region, 2012-2016
FIG. 26 Global Trash Bags Segment Market Value (US$ Mn) By Region, 2017-2022
FIG. 27 Global Trash Bags Segment Y-o-Y Growth Rate, By Region, 2015-2022
FIG. 28 Global Rubble Sacks Segment Market Value (US$ Mn) By Region, 2012-2016
FIG. 29 Global Rubble Sacks Segment Market Value (US$ Mn) By Region, 2017-2022
FIG. 30 Global Rubble Sacks Segment Y-o-Y Growth Rate, By Region, 2015-2022
FIG. 31 Global Woven Sacks Segment Market Value (US$ Mn) By Region, 2012-2016
FIG. 32 Global Woven Sacks Segment Market Value (US$ Mn) By Region, 2017-2022
FIG. 33 Global Woven Sacks Segment Y-o-Y Growth Rate, By Region, 2015-2022
FIG. 34 Global Others Segment Market Value (US$ Mn) By Region, 2012-2016
FIG. 35 Global Others Segment Market Value (US$ Mn) By Region, 2017-2022
FIG. 36 Global Others Segment Y-o-Y Growth Rate, By Region, 2015-2022
FIG. 37 Global Retail & Consumer Segment Market Value (US$ Mn) By Region, 2012-2016
FIG. 38 Global Retail & Consumer Segment Market Value (US$ Mn) By Region, 2017-2022
FIG. 39 Global Retail & Consumer Segment Y-o-Y Growth Rate, By Region, 2015-2022
FIG. 40 Global Institutional Segment Market Value (US$ Mn) By Region, 2012-2016
FIG. 41 Global Institutional Segment Market Value (US$ Mn) By Region, 2017-2022
FIG. 42 Global Institutional Segment Y-o-Y Growth Rate, By Region, 2015-2022
FIG. 43 Global Industrial Segment Market Value (US$ Mn) By Region, 2012-2016
FIG. 44 Global Industrial Segment Market Value (US$ Mn) By Region, 2017-2022
FIG. 45 Global Industrial Segment Y-o-Y Growth Rate, By Region, 2015-2022
FIG. 46 North America Biodegradable Plastic Bags & Sacks Market Value (US$ Mn), By Material Type 2012-2016
FIG. 47 North America Biodegradable Plastic Bags & Sacks Market Value (US$ Mn), By Material Type 2017-2022
FIG. 48 North America Biodegradable Plastic Bags & Sacks Market Value (US$ Mn), By Product Type 2012-2016
FIG. 49 North America Biodegradable Plastic Bags & Sacks Market Value (US$ Mn), By Product Type 2017-2022
FIG. 50 North America Biodegradable Plastic Bags & Sacks Market Value (US$ Mn), By End User 2012-2016
FIG. 51 North America Biodegradable Plastic Bags & Sacks Market Value (US$ Mn), By End User 2017-2022
FIG. 52 Latin America Biodegradable Plastic Bags & Sacks Market Value (US$ Mn), By Material Type 2012-2016
FIG. 53 Latin America Biodegradable Plastic Bags & Sacks Market Value (US$ Mn), By Material Type 2017-2022
FIG. 54 Latin America Biodegradable Plastic Bags & Sacks Market Value (US$ Mn), By Product Type 2012-2016
FIG. 55 Latin America Biodegradable Plastic Bags & Sacks Market Value (US$ Mn), By Product Type 2017-2022
FIG. 56 Latin America Biodegradable Plastic Bags & Sacks Market Value (US$ Mn), By End User 2012-2016
FIG. 57 Latin America Biodegradable Plastic Bags & Sacks Market Value (US$ Mn), By End User 2017-2022
FIG. 58 Europe Biodegradable Plastic Bags & Sacks Market Value (US$ Mn), By Material Type 2012-2016
FIG. 59 Europe Biodegradable Plastic Bags & Sacks Market Value (US$ Mn), By Material Type 2017-2022
FIG. 60 Europe Biodegradable Plastic Bags & Sacks Market Value (US$ Mn), By Product Type 2012-2016
FIG. 61 Europe Biodegradable Plastic Bags & Sacks Market Value (US$ Mn), By Product Type 2017-2022
FIG. 62 Europe Biodegradable Plastic Bags & Sacks Market Value (US$ Mn), By End User 2012-2016
FIG. 63 Europe Biodegradable Plastic Bags & Sacks Market Value (US$ Mn), By End User 2017-2022
FIG. 64 Japan Biodegradable Plastic Bags & Sacks Market Value (US$ Mn), By Material Type 2012-2016
FIG. 65 Japan Biodegradable Plastic Bags & Sacks Market Value (US$ Mn), By Material Type 2017-2022
FIG. 66 Japan Biodegradable Plastic Bags & Sacks Market Value (US$ Mn), By Product Type 2012-2016
FIG. 67 Japan Biodegradable Plastic Bags & Sacks Market Value (US$ Mn), By Product Type 2017-2022
FIG. 68 Japan Biodegradable Plastic Bags & Sacks Market Value (US$ Mn), By End User 2012-2016
FIG. 69 Japan Biodegradable Plastic Bags & Sacks Market Value (US$ Mn), By End User 2017-2022
FIG. 70 APEJ Biodegradable Plastic Bags & Sacks Market Value (US$ Mn), By Material Type 2012-2016
FIG. 71 APEJ Biodegradable Plastic Bags & Sacks Market Value (US$ Mn), By Material Type 2017-2022
FIG. 72 APEJ Biodegradable Plastic Bags & Sacks Market Value (US$ Mn), By Product Type 2012-2016
FIG. 73 APEJ Biodegradable Plastic Bags & Sacks Market Value (US$ Mn), By Product Type 2017-2022
FIG. 74 APEJ Biodegradable Plastic Bags & Sacks Market Value (US$ Mn), By End User 2012-2016
FIG. 75 APEJ Biodegradable Plastic Bags & Sacks Market Value (US$ Mn), By End User 2017-2022
FIG. 76 MEA Biodegradable Plastic Bags & Sacks Market Value (US$ Mn), By Material Type 2012-2016
FIG. 77 MEA Biodegradable Plastic Bags & Sacks Market Value (US$ Mn), By Material Type 2017-2022
FIG. 78 MEA Biodegradable Plastic Bags & Sacks Market Value (US$ Mn), By Product Type 2012-2016
FIG. 79 MEA Biodegradable Plastic Bags & Sacks Market Value (US$ Mn), By Product Type 2017-2022
FIG. 80 MEA Biodegradable Plastic Bags & Sacks Market Value (US$ Mn), By End User 2012-2016
FIG. 81 MEA Biodegradable Plastic Bags & Sacks Market Value (US$ Mn), By End User 2017-2022
Copyright © Transparency Market Research, Inc. All Rights reserved
Trust Online

Biodegradable Plastic Bags and Sacks Market Forecast Analysis Report