
Reports
Reports
Arterial stents are small, metal mesh tube which expands within a coronary artery. The global arterial stents market is growing because of the rising presence of disorders such as atherosclerosis along with the addition of technologically advanced arterial stents such as bioresorbable stents.
In addition to this, the success of arterial stents for treating coronary and peripheral artery disorders and the inclination towards minimally invasive procedures to unblock arteries and increase blood flow are a few important growth drivers of the arterial stents market.
A TMR report has projected the global arterial stents market to grow at a compound annual growth rate (CAGR) of 9.5 over the duration of the forecast period 2017-2025. In 2016, the global arterial stents market had a valuation of US $ 8 Bn and it is estimated to grow to US $ 17.8 Bn by 2025-end.
The increasing preference for a minimally invasive surgery (MIS) could become the main factor behind the growth of the arterial stents market, in future. The other reason that could fuel the growth of the arterial stents market is the rising number of patients, who are suffering from artery blockage. There have also been technological innovations that have taken place in arterial stents recently.
The global arterial stents market is likely to flourish due to factors such as increase in hypertension as well as rising incidence of varied cardiovascular disorders among the elderly. Also, greater obesity levels are expected to propel the market, as well.
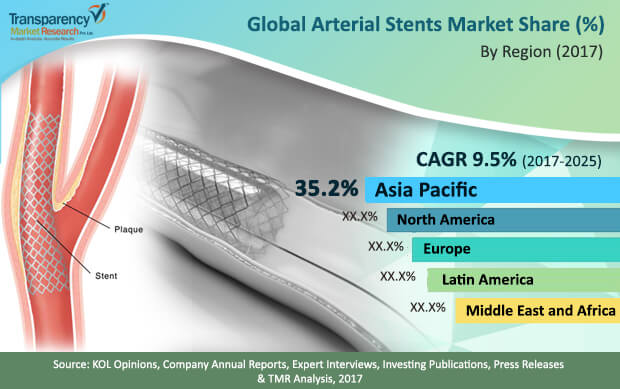
In terms of region, the global arterial stents market is divided into five regions: Europe, Latin America, Asia Pacific, Middle East and Africa, and North America.
Europe accounted for the maximum share in the global arterial stents market in 2016 and a reason for its dominance was the presence of important arterial stent manufacturers in countries such as the UK and Germany. The increasing number of MIS in this region also contributed to the growth of the arterial stents market.
Asia Pacific is estimated to be the leader in the global arterial stents market over the forecast period, with the highest CAGR. A reason why this region is anticipated to dominate is because of large corporations making big investments to modernize the healthcare sector in countries such as India and China.
North America is second in the global market and is expected to grow at a substantial CAGR during the forecast period.
The global arterial stents market is divided based on product type into peripheral and coronary stents. In terms of revenue, in 2016, the coronary stents accounted for the leading share in the arterial stents market. The rising acceptance of new coronary stents by cardiologists has played an important role in the development of this segment.
Drug-eluting stents accounted for the largest contribution in terms of revenue in 2016 and are expected to continue their domination during the forecast period. The reason behind the impressive growth of the drug-eluting segment is because of the demand and integration of anti-restenosis materials to prevent high restenosis cases.
In terms of growth rate, peripheral arterial stents are expected to exceed coronary arterial stents during the forecast period. The reason for this is the increasing knowledge of peripheral artery disorders and the addition of technologically advanced stents by important market players which are designed for popliteal and femoral arteries.
In terms of application, the market is classified into carotid artery, iliac artery, coronary artery, and femoral and popliteal artery.
Coronary artery contributed the most, in terms of revenue, in 2016 because several market players were involved in the manufacture of coronary stents. In future, the coronary artery segment is anticipated to stay dominant, until the end of 2025. The femoral and popliteal artery is expected to display the maximum CAGR during the forecast period because of clinical research causing greater access to deep-rooted arteries.
Some of the advantages of arterial stents process include substantial improvement in the blood flow and the prevention of any type of damage to blood vessels. Stent processes also help in reducing the number of days spent in a hospital.
These factors will lead to significant growth for the global market during the forecast period. The advantages of stenting processes will have a significant impact on the development and growth of the market.
Research and development undertakings have also played an important role in the growth of the arterial stents market. Market players make big investments in the stents to make them more effective. In addition to this, mergers and acquisitions have been vital to the evolution of the arterial stents market.
Companies collaborate to expand their influence in various regions as well as rise in their production capabilities. Some of the important players in the global arterial market include Cordis Corporation, Abbott Laboratories. Cook Medical, Lifetech Scientific, Gore Medical, Biosensors International Group Ltd, BIOTRONIK AG, and Medtronic.
If there was one factor, however, which has the chance of hampering the global arterial stents market, it is the insufficient number of high-quality healthcare infrastructure and facilities and skilled interventional cardiologists in developing countries.
The coronavirus pandemic has played a crucial role in increasing the demand for arterial stents. The increasing number of Covid cases throughout the world is leading to a greater number of hospitalizations.
In addition, the public suffering from cardiovascular disorders could be at a greater risk of getting infected with Covid. All these factors could, however, have a positive impact on the arterial stents market.
Arterial stents market is predicted to reach an overall value of US$17.8bn by the end of 2025
Arterial stents market is expected to grow at much higher rate of 9.5% CAGR during 2017-2025
Arterial stents market is driven by increasing preference for a minimally invasive surgery (MIS) and increase in hypertension as well as rising incidence of varied cardiovascular disorders among the elderly
The coronary artery segment dominated the global arterial stents market and the trend is projected to continue during the forecast period
Key players in the global arterial market include Cordis Corporation, Abbott Laboratories. Cook Medical, Lifetech Scientific, Gore Medical, Biosensors International Group Ltd, BIOTRONIK AG, and Medtronic.
1. Preface
1.1. Market Definition and Scope
1.2. Market Segmentation
1.3. Key Research Objectives
1.4. Research Highlights
2. Assumptions and Research Methodology
3. Executive Summary : Global Arterial Stents Market
4. Market Overview
4.1. Introduction
4.1.1. Product Definition
4.1.2. Industry Evolution / Developments
4.2. Overview
4.3. Market Dynamics
4.3.1. Drivers
4.3.2. Restraints
4.3.3. Opportunity
4.4. Global Arterial Stents Market Analysis and Forecasts, 2015–2025
4.5. Market Outlook
4.6. Ker Arterial Diseases: Epidemiology
4.6.1. Coronary Artery Diseases (CAD)
4.6.2. Peripheral Artery Diseases (PAD)
4.7. Arterial Stents: Product Mapping
4.8. Arterial Stents Market: Key Mergers and Acquisitions
4.9. Arterial Stents: Global Volume Forecast and Analysis
5. Global Arterial Stents Market Analysis and Forecasts, By Product
5.1. Introduction & Definition
5.2. Key Findings / Developments
5.3. Market Value Forecast By Product, 2015–2025
5.3.1. Coronary Stents
5.3.1.1. Bare Metal Stents
5.3.1.2. Drug-eluting Stents
5.3.1.3. Bioresorbable Stents
5.3.1.4. Others
5.3.2. Peripheral Stents
5.3.2.1. Self-expanding Stents
5.3.2.2. Balloon-expanding Stents
5.3.2.3. Others
5.4. Market Attractiveness By Product
5.5. Key Trends
6. Global Arterial Stents Market Analysis and Forecasts, By Application
6.1. Introduction & Definition
6.2. Key Findings / Developments
6.3. Market Value Forecast By Application, 2015–2025
6.3.1. Coronary Artery
6.3.2. Carotid Artery
6.3.3. Iliac Artery
6.3.4. Femoral & Popliteal Artery
6.3.5. Others
6.4. Market Attractiveness By Application
6.5. Key Trends
7. Global Arterial Stents Market Analysis and Forecasts, By Region
7.1. Key Findings
7.2. Market Value Forecast By Region
7.2.1. North America
7.2.2. Europe
7.2.3. Asia Pacific
7.2.4. Latin America
7.2.5. Middle East & Africa
7.3. Market Attractiveness By Country/Region
8. North America Arterial Stents Market Analysis and Forecast
8.1. Introduction
8.1.1. Key Findings
8.2. Market Value Forecast By Product, 2015–2025
8.2.1. Coronary Stents
8.2.1.1. Bare Metal Stents
8.2.1.2. Drug-eluting Stents
8.2.1.3. Bioresorbable Stents
8.2.1.4. Others
8.2.2. Peripheral Stents
8.2.2.1. Self-expanding Stents
8.2.2.2. Balloon-expanding Stents
8.2.2.3. Others
8.3. Market Value Forecast By Application, 2015–2025
8.3.1. Coronary Artery
8.3.2. Carotid Artery
8.3.3. Iliac Artery
8.3.4. Femoral & Popliteal Artery
8.3.5. Others
8.4. Market Value Forecast By Country, 2015–2025
8.4.1. U.S.
8.4.2. Canada
8.5. Market Attractiveness Analysis
8.5.1. By Product
8.5.2. By Application
8.5.3. By Country
8.6. Key trends
9. Europe Arterial Stents Market Analysis and Forecast
9.1. Introduction
9.1.1. Key Findings
9.2. Market Value Forecast By Product, 2015–2025
9.2.1. Coronary Stents
9.2.1.1. Bare Metal Stents
9.2.1.2. Drug-eluting Stents
9.2.1.3. Bioresorbable Stents
9.2.1.4. Others
9.2.2. Peripheral Stents
9.2.2.1. Self-expanding Stents
9.2.2.2. Balloon-expanding Stents
9.2.2.3. Others
9.3. Market Value Forecast By Application, 2015–2025
9.3.1. Coronary Artery
9.3.2. Carotid Artery
9.3.3. Iliac Artery
9.3.4. Femoral & Popliteal Artery
9.3.5. Others
9.4. Market Value Forecast By Country, 2015–2025
9.4.1. Germany
9.4.2. U.K.
9.4.3. France
9.4.4. Spain
9.4.5. Italy
9.4.6. Rest of Europe
9.5. Market Attractiveness Analysis
9.5.1. By Product
9.5.2. By Application
9.5.3. By Country
9.6. Key Trends
10. Asia Pacific Arterial Stents Market Analysis and Forecast
10.1.Introduction
10.1.1. Key Findings
10.2.Market Value Forecast By Product, 2015–2025
10.2.1. Coronary Stents
10.2.1.1. Bare Metal Stents
10.2.1.2. Drug-eluting Stents
10.2.1.3. Bioresorbable Stents
10.2.1.4. Others
10.2.2. Peripheral Stents
10.2.2.1. Self-expanding Stents
10.2.2.2. Balloon-expanding Stents
10.2.2.3. Others
10.3.Market Value Forecast By Application, 2015–2025
10.3.1. Coronary Artery
10.3.2. Carotid Artery
10.3.3. Iliac Artery
10.3.4. Femoral & Popliteal Artery
10.3.5. Others
10.4.Market Value Forecast By Country, 2015–2025
10.4.1. China
10.4.2. India
10.4.3. Japan
10.4.4. Rest of Asia Pacific
10.5.Market Attractiveness Analysis
10.5.1. By Product
10.5.2. By Application
10.5.3. By Country
10.6. Key Trends
11. Latin America Arterial Stents Market Analysis and Forecast
11.1.Introduction
11.1.1. Key Findings
11.2.Market Value Forecast By Product, 2015–2025
11.2.1. Coronary Stents
11.2.1.1. Bare Metal Stents
11.2.1.2. Drug-eluting Stents
11.2.1.3. Bioresorbable Stents
11.2.1.4. Others
11.2.2. Peripheral Stents
11.2.2.1. Self-expanding Stents
11.2.2.2. Balloon-expanding Stents
11.2.2.3. Others
11.3.Market Value Forecast By Application, 2015–2025
11.3.1. Coronary Artery
11.3.2. Carotid Artery
11.3.3. Iliac Artery
11.3.4. Femoral & Popliteal Artery
11.3.5. Others
11.4.Market Value Forecast By Country, 2015–2025
11.4.1. Brazil
11.4.2. Mexico
11.4.3. Rest of Latin America
11.5.Market Attractiveness Analysis
11.5.1. By Product
11.5.2. By Application
11.5.3. By Country
11.6. Key Trends
12. Middle East & Africa Arterial Stents Market Analysis and Forecast
12.1.Introduction
12.1.1. Key Findings
12.2.Market Value Forecast By Product, 2015–2025
12.2.1. Coronary Stents
12.2.1.1. Bare Metal Stents
12.2.1.2. Drug-eluting Stents
12.2.1.3. Bioresorbable Stents
12.2.1.4. Others
12.2.2. Peripheral Stents
12.2.2.1. Self-expanding Stents
12.2.2.2. Balloon-expanding Stents
12.2.2.3. Others
12.3.Market Value Forecast By Application, 2015–2025
12.3.1. Coronary Artery
12.3.2. Carotid Artery
12.3.3. Iliac Artery
12.3.4. Femoral & Popliteal Artery
12.3.5. Others
12.4.Market Value Forecast By Country, 2015–2025
12.4.1. GCC Countries
12.4.2. South Africa
12.4.3. Israel
12.4.4. Rest of Middle East & Africa
12.5.Market Attractiveness Analysis
12.5.1. By Product
12.5.2. By Application
12.5.3. By Country
12.6. Key Trends
13. Competition Landscape
13.1.Market Player – Competition Matrix (By Tier and Size of companies)
13.2.Market Share Analysis By Company (2016)
13.3.Company Profiles (Details – Overview, Financials, Recent Developments, Strategy)
13.3.1. Abbott Vascular (Abbott Laboratories)
13.3.1.1. Overview
13.3.1.2.Financials
13.3.1.3.Recent Developments
13.3.1.4.SWOT Analysis
13.3.1.5.Strategic Overview
13.3.2. Cordis Corporation (A Cardinal Health Company)
13.3.2.1. Overview
13.3.2.2.Financials
13.3.2.3.Recent Developments
13.3.2.4.SWOT Analysis
13.3.2.5.Strategic Overview
13.3.3. Boston Scientific Corporation
13.3.3.1. Overview
13.3.3.2.Financials
13.3.3.3.Recent Developments
13.3.3.4.SWOT Analysis
13.3.3.5.Strategic Overview
13.3.4. Medtronic
13.3.4.1. Overview
13.3.4.2.Financials
13.3.4.3.Recent Developments
13.3.4.4.SWOT Analysis
13.3.4.5.Strategic Overview
13.3.5. C. R. Bard, Inc. (BARD Peripheral Vascular)
13.3.5.1. Overview
13.3.5.2.Financials
13.3.5.3.Recent Developments
13.3.5.4.SWOT Analysis
13.3.5.5.Strategic Overview
13.3.6. Biosensors International Group, Ltd.
13.3.6.1. Overview
13.3.6.2.Financials
13.3.6.3.Recent Developments
13.3.6.4.SWOT Analysis
13.3.6.5.Strategic Overview
13.3.7. Lifetech Scientific
13.3.7.1. Overview
13.3.7.2.Financials
13.3.7.3.Recent Developments
13.3.7.4.SWOT Analysis
13.3.7.5.Strategic Overview
13.3.8. BIOTRONIK AG
13.3.8.1. Overview
13.3.8.2.Financials
13.3.8.3.Recent Developments
13.3.8.4.SWOT Analysis
13.3.8.5.Strategic Overview
13.3.9. Cook Medical
13.3.9.1. Overview
13.3.9.2.Financials
13.3.9.3.Recent Developments
13.3.9.4.SWOT Analysis
13.3.9.5.Strategic Overview
13.3.10. W. L. Gore & Associates, Inc.
13.3.10.1. Overview
13.3.10.2.Financials
13.3.10.3.Recent Developments
13.3.10.4.SWOT Analysis
13.3.10.5.Strategic Overview
List of Tables
Table 01 Product Mapping (Abbott Vascular)
Table 02 Product Mapping (Boston Scientific Corporation)
Table 03 Product Mapping (Biotronik AG, Meril Lifesciences, JOTEC GmbH)
Table 04 Product Mapping (Biosensors International, ENDOLOGIX, INC)
Table 05 Product Mapping (Cordis Corporation, Terumo Corporation)
Table 06 Product Mapping (Medtronic)
Table 07 Product Mapping (B. Braun Melsungen AG, Microport)
Table 08 Product Mapping (Vascular Concept)
Table 09 Product Mapping (Translumina GmBH, Lombard Medical, Scitech, Minvasys)
Table 10 Product Mapping (iVascular SLU, Elixir Medical Corporation, Andramed GmbH)
Table 11 Product Mapping (Endocor GmBH, Arthesys)
Table 12 Product Mapping (Eurocor GmbH, ORBUSNEICH, Hexacath)
Table 13 Product Mapping (Amaranth Medical, InSitu Technologies, Inc., Kyoto Medical)
Table 14 Product Mapping (Comed B. V., Alvimedica, Accura Medizintechnik GmbH, Micelle Technologies)
Table 15 Product Mapping (ELLA - CS, Cook Medical, Lepu Medical)
Table 16 Arterial Stents Average Selling Prices (US$), and Analysis, By Stent Type, 2016
Table 17 Global Arterial Stents Market Size (US$ Mn) Forecast, by Product, 2015–2025
Table 18 Global Stents Market Size (US$ Mn) Forecast, by Arterial Stents – Coronary Stents, 2015–2025
Table 19 Global Stents Market Size (US$ Mn) Forecast, by Arterial Stents – Peripheral Stents, 2015–2025
Table 20 Global Arterial Stents Market Size (US$ Mn) Forecast, by Application, 2015–2025
Table 21 Global Arterial Stents Market Size (US$ Mn) Forecast, by Region, 2015–2025
Table 22 North America Arterial Stents Market Size (US$ Mn) Forecast, by Country, 2015–2025
Table 23 North America Arterial Stents Market Size (US$ Mn) Forecast, by Product, 2015–2025
Table 24 North America Stents Market Size (US$ Mn) Forecast, by Arterial Stents – Coronary Stents, 2015–2025
Table 25 North America Stents Market Size (US$ Mn) Forecast, by Arterial Stents – Peripheral Stents, 2015–2025
Table 26 North America Arterial Stents Market Size (US$ Mn) Forecast, by Application, 2015–2025
Table 27 Europe Arterial Stents Market Size (US$ Mn) Forecast, by Country/Sub-region, 2015–2025
Table 28 Europe Arterial Stents Market Size (US$ Mn) Forecast, by Product, 2015–2025
Table 29 Europe Stents Market Size (US$ Mn) Forecast, by Arterial Stents – Coronary Stents, 2015–2025
Table 30 Europe Stents Market Size (US$ Mn) Forecast, by Arterial Stents – Peripheral Stents, 2015–2025
Table 31 Europe Arterial Stents Market Size (US$ Mn) Forecast, by Application, 2015–2025
Table 32 Asia Pacific Arterial Stents Market Size (US$ Mn) Forecast, by Country/Sub-region, 2015–2025
Table 33 Asia Pacific Arterial Stents Market Size (US$ Mn) Forecast, by Product, 2015–2025
Table 34 Asia Pacific Stents Market Size (US$ Mn) Forecast, by Arterial Stents – Coronary Stents, 2015–2025
Table 35 Asia Pacific Stents Market Size (US$ Mn) Forecast, by Arterial Stents – Peripheral Stents, 2015–2025
Table 36 Asia Pacific Arterial Stents Market Size (US$ Mn) Forecast, by Application, 2015–2025
Table 37 Latin America Arterial Stents Market Size (US$ Mn) Forecast, by Country, 2015–2025
Table 38 Latin America Arterial Stents Market Size (US$ Mn) Forecast, by Product, 2015–2025
Table 39 Latin America Stents Market Size (US$ Mn) Forecast, by Arterial Stents – Coronary Stents, 2015–2025
Table 40 Latin America Stents Market Size (US$ Mn) Forecast, by Arterial Stents – Peripheral Stents, 2015–2025
Table 41 Latin America Arterial Stents Market Size (US$ Mn) Forecast, by Application, 2015–2025
Table 42 Middle East & Africa Arterial Stents Market Size (US$ Mn) Forecast, by Country, 2015–2025
Table 43 Middle East & Africa Arterial Stents Market Size (US$ Mn) Forecast, by Product, 2015–2025
Table 44 Middle East & Africa Stents Market Size (US$ Mn) Forecast, by Arterial Stents – Coronary Stents, 2015–2025
Table 45 Middle East & Africa Stents Market Size (US$ Mn) Forecast, by Arterial Stents – Peripheral Stents, 2015–2025
Table 46 Middle East & Africa Arterial Stents Market Size (US$ Mn) Forecast, by Application, 2015–2025
List of Figures
Fig. 01 Global Arterial Stents Market Size (US$ Mn) Forecast, 2015–2025
Fig. 02 Global Arterial Stents Market Value Share, by Product (2016)
Fig. 03 Global Arterial Stents Market Value Share, by Application (2016)
Fig. 04 Global Arterial Stents Market Value Share, by Region (2016)
Fig. 05 Global Prevalence of CAD, By Country, 2016
Fig. 06 Global Prevalence of CAD (%), By Age Group and Gender, 2015
Fig. 07 Global Prevalence of PAD (%), By Age Group and Gender, 2015
Fig. 08 Global Coronary Stents Volume Forecast (‘000), 2015–2025
Fig. 09 Global Peripheral Stents Volume Forecast (‘000), 2015–2025
Fig. 10 Global Arterial Stents Market Value Share, by Product, 2017 and 2025
Fig. 11 Global Arterial Stents Market Revenue (US$ Mn) and Y-o-Y Growth (%) Forecast, by Coronary Stents, 2015–2025
Fig. 12 Global Arterial Stents Market Revenue (US$ Mn) and Y-o-Y Growth (%) Forecast, by Peripheral Stents, 2015–2025
Fig. 13 Global Arterial Stents Market Attractiveness, by Product, 2017–2025
Fig. 14 Global Arterial Stents Market Value Share, by Application, 2017 and 2025
Fig. 15 Global Arterial Stents Market Revenue (US$ Mn) and Y-o-Y Growth (%), by Iliac Artery, 2015–2025
Fig. 16 Global Arterial Stents Market Revenue (US$ Mn) and Y-o-Y Growth (%), by Carotid Artery, 2015–2025
Fig. 17 Global Arterial Stents Market Revenue (US$ Mn) and Y-o-Y Growth (%), by Coronary Artery, 2015–2025
Fig. 18 Global Arterial Stents Market Revenue (US$ Mn) and Y-o-Y Growth (%), by Femoral & Popliteal Artery, 2015–2025
Fig. 19 Global Arterial Stents Market Revenue (US$ Mn) and Y-o-Y Growth (%), by Others, 2015–2025
Fig. 20 Global Arterial Stents Market Attractiveness, by Application, 2017–2025
Fig. 21 Global Arterial Stents Market Value Share, by Region, 2017 and 2025
Fig. 22 Global Arterial Stents Market Attractiveness, by Region, 2017–2025
Fig. 23 North America Arterial Stents Market Value Share, by Country, 2017 and 2025
Fig. 24 North America Arterial Stents Market Size (US$ Mn) Forecast and Y-o-Y Growth Projection (%), 2015–2025
Fig. 25 North America Arterial Stents Market Attractiveness, by Country, 2017–2025
Fig. 26 North America Arterial Stents Market Value Share, by Product, 2017 and 2025
Fig. 27 North America Arterial Stents Market Attractiveness, by Product, 2017–2025
Fig. 28 North America Arterial Stents Market Value Share, by Application, 2017 and 2025
Fig. 29 North America Arterial Stents Market Attractiveness, by Application, 2017–2025
Fig. 30 Europe Arterial Stents Market Value Share, by Country/Sub-region, 2017 and 2025
Fig. 31 Europe Arterial Stents Market Size (US$ Mn) Forecast and Y-o-Y Growth Projection (%), 2015–2025
Fig. 32 Europe Arterial Stents Market Attractiveness, by Country/Sub-region, 2017–2025
Fig. 33 Europe Arterial Stents Market Value Share, by Product, 2017 and 2025
Fig. 34 Europe Arterial Stents Market Attractiveness, by Product, 2017–2025
Fig. 35 Europe Arterial Stents Market Value Share, by Application, 2017 and 2025
Fig. 36 Europe Arterial Stents Market Attractiveness, by Application, 2017–2025
Fig. 37 Asia Pacific Arterial Stents Market Value Share, by Country/Sub-region, 2017 and 2025
Fig. 38 Asia Pacific Arterial Stents Market Size (US$ Mn) Forecast and Y-o-Y Growth Projection (%), 2015–2025
Fig. 39 Asia Pacific Arterial Stents Market Attractiveness, by Country/Sub-region, 2017–2025
Fig. 40 Asia Pacific Arterial Stents Market Value Share, by Product, 2017 and 2025
Fig. 41 Asia Pacific Arterial Stents Market Attractiveness, by Product, 2017–2025
Fig. 42 Asia Pacific Arterial Stents Market Value Share, by Application, 2017 and 2025
Fig. 43 Asia Pacific Arterial Stents Market Attractiveness, by Application, 2017–2025
Fig. 44 Latin America Arterial Stents Market Value Share, by Country, 2017 and 2025
Fig. 45 Latin America Arterial Stents Market Size (US$ Mn) Forecast and Y-o-Y Growth Projection (%), 2015–2025
Fig. 46 Latin America Arterial Stents Market Attractiveness, by Country, 2017–2025
Fig. 47 Latin America Arterial Stents Market Value Share, by Product, 2017 and 2025
Fig. 48 Latin America Arterial Stents Market Attractiveness, by Product, 2017–2025
Fig. 49 Latin America Arterial Stents Market Value Share, by Application, 2017 and 2025
Fig. 50 Latin America Arterial Stents Market Attractiveness, by Application, 2017–2025
Fig. 51 Middle East & Africa Arterial Stents Market Value Share, by Country, 2017 and 2025
Fig. 52 Middle East & Africa Arterial Stents Market Size (US$ Mn) Forecast and Y-o-Y Growth Projection (%), 2015–2025
Fig. 53 Middle East & Africa Arterial Stents Market Attractiveness, by Country, 2017–2025
Fig. 54 Middle East & Africa Arterial Stents Market Value Share, by Product, 2017 and 2025
Fig. 55 Middle East & Africa Arterial Stents Market Attractiveness, by Product, 2017–2025
Fig. 56 Middle East & Africa Arterial Stents Market Value Share, by Application, 2017 and 2025
Fig. 57 Middle East & Africa Arterial Stents Market Attractiveness, by Application, 2017–2025
Fig. 58 Global Arterial Stents Market Share, by Company, 2016
Fig. 59 Abbott Laboratories Revenue (US$ Bn) and Y-o-Y Growth (%), 2014–2016
Fig. 60 Abbott Laboratories Breakdown of Net Sales (%), by Region, 2016
Fig. 61 Cardinal Health Revenue (US$ Mn) and Y-o-Y Growth (%), 2013–2016
Fig. 62 Cardinal Health Breakdown of Net Sales (%), by Business Segment, 2016
Fig. 63 Medtronic Revenue (US$ Bn) & Y-o-Y Growth (%), 2013–2016
Fig. 64 Medtronic Breakdown of Net Sales (%), by Region, 2016
Fig. 65 Boston Scientific Corporation Revenue (US$ Bn) and Y-o-Y Growth (%), 2013–2016
Fig. 66 Boston Scientific Corporation Breakdown of Net Sales (%), by Region, 2016
Fig. 67 Lifetech Scientific Revenue (US$ Mn) & Y-o-Y Growth (%), 2013–2016
Fig. 68 C. R. Bard, Inc. Revenue (US$ Bn) and Y-o-Y Growth (%), 2014–2016
Fig. 69 C. R. Bard, Inc. Breakdown of Net Sales (%), by Business Segment, 2016
Copyright © Transparency Market Research, Inc. All Rights reserved
Trust Online

Arterial Stents Market Trends, 2017-2025