Analysts’ Viewpoint on Global Application Performance Monitoring (APM) Market Scenario
Application performance monitoring (APM) software helps an organization to target the performance expectation of users as well as improve their services. Additionally, APM has the ability to track the performance of IT services and ensure that they meet the needs of companies. The rise in use of Big Data analytics is a crucial factor accelerating the application performance monitoring market. Increasing proliferation and demand for mobile and cloud computing; growing globalization of businesses; rising competition among businesses to solve, analyze, and mend business processes; technological advancements and developments in APM; and surging demand for cloud and mobile computing are the significant factors driving the application performance monitoring market.
Application performance monitoring (APM) is a software that assists organizations in preventing and forecasting software-related issues before they have an influence on personal or commercial businesses, as well as end-users such as BFSI, IT & telecom, healthcare, and others. Advancements in IT infrastructure, Internet of Things (IoT), and cloud computing technologies have encouraged several organizations to move their focus on providing a good end-user experience for their web and mobile applications. This factor increases the demand for APM platforms.
The application performance monitoring market competitiveness is mainly boosted by several software applications being launched every day. Additionally, numerous applications are available for a single task. However, the performance of any application is critical to its success. A well-performing application offers clients with an excellent user experience.
Request a sample to get extensive insights into the Application Performance Monitoring Market
Organizations are adopting advanced technologies such as big data analytics and machine learning to analyze the large volume of data and generate visualization insights to enhance the user experience. Furthermore, companies are adopting cloud technologies due to easy deployment, low maintenance, low financial investments in physical infrastructure, and considerable progression in data sharing technologies.
The adoption of these technologies provide support to APM platforms to analyze and improve the presentation of application monitoring tools. For instance, Nexthink, a Switzerland-based IT and software company, focuses on monitoring and improving employees' experience by using artificial intelligence-driven analytics, sentiment gathering, and automated remediation.
Enterprises can understand the immediate needs of their customers and deliver the right content through various digital channels with the help of these advanced technologies. Additionally, APM platforms offer many advantages such as incorporated advanced analytical capability, client activity monitoring, and seamless integration with the existing framework.
Key market players are focusing on further improving their application performance monitoring platforms by investing resources in advanced technologies, such as machine learning (ML), artificial intelligence (AI), and Big Data analytics. This factor is likely to increase the application performance monitoring market size during the forecast period.
Monitoring has increased over the last decades, as advancements in digital technologies have changed the way the world interacts with applications, websites, and services. According to Catchpoint, a U.S.-based software company, there is drastic change in technologies such as cloud computing, edge computing (CDN, DNS, load balancing, WAF, SDWAN, etc.), and server-side and client-side rendering. The need for real-user monitoring (RUM) and synthetic transaction monitoring (STM) is growing rapidly for evaluation purposes. For instance, Catchpoint offers a cloud computing solution to monitor and analyze user experiences, and understand several problems such as app crashes, third-party components, and cloud stack with new features that enhance customer expectations.
Organizations are expected to deploy application performance monitoring platforms to prioritize performance problems and also optimize their user experience. These factors are expected to drive the application performance monitoring market in the upcoming years.
Asia Pacific is expected to account for a prominent share of the global application performance monitoring market by 2022. Developments across IT industries and increasing adoption of APM solutions among SMEs and large enterprises are significant factors propelling the market in the region. Additionally, rise in adoption of mobile and cloud technologies by various small- and medium-sized companies is driving the application performance monitoring market in the region. Development of infrastructure in countries such as China, India, Japan, and Singapore has been opening new business avenues for vendors, thereby fueling the market growth in the region.
The application performance monitoring market in North America is expected to grow at a notable CAGR during the forecast period. The consistent rise in demand for digital experience monitoring (DEM) solutions from various sectors, such as IT & telecom, BFSI, retail, and healthcare, is boosting the application performance monitoring market in the region. Rise in need to monitor end-user and customer experience across multiple channels is also expected to fuel the market in the region.
In the global application performance monitoring market report, individual strategies, followed by company profiles of the market are discussed. The ‘Competition Landscape’ section has been included in the report to provide readers with a dashboard view and company market share analysis of key players operating in the global application performance monitoring market. The key players included are Dynatrace LLC, Datadog, New Relic, Inc., Cisco System Inc., Splunk Inc., SolarWinds Worldwide, LLC, Aternity LLC, Broadcom Inc., Catchpoint Systems, Inc., Microsoft Corporation, Micro Focus, ManageEngine (Zoho Corporation Pvt. Ltd.), Instana (IBM Corporation), and Elasticsearch B.V.
Each of these players has been profiled in the application performance monitoring market report based on parameters such as company overview, financial overview, business strategies, product portfolio, business segments, and recent developments.
Request a custom report on Application Performance Monitoring Market
|
Attribute |
Detail |
|
Market Size Value in 2021 |
US$ 5.9 Bn |
|
Market Forecast Value in 2031 |
US$ 18.2 Bn |
|
Growth Rate (CAGR) |
12.1% |
|
Forecast Period |
2022–2031 |
|
Historical Data Available for |
2016–2020 |
|
Quantitative Units |
US$ Bn for Value |
|
Market Analysis |
Includes segment analysis at global as well as regional level. Furthermore, qualitative analysis includes drivers, restraints, opportunities, key trends, ecosystem/value chain analysis, and key trend analysis. |
|
Competition Landscape |
|
|
Format |
Electronic (PDF) + Excel |
|
Market Segmentation |
|
|
Regions Covered |
|
|
Countries Covered |
|
|
Companies Profiled |
|
|
Customization Scope |
Available upon request |
|
Pricing |
Available upon request |
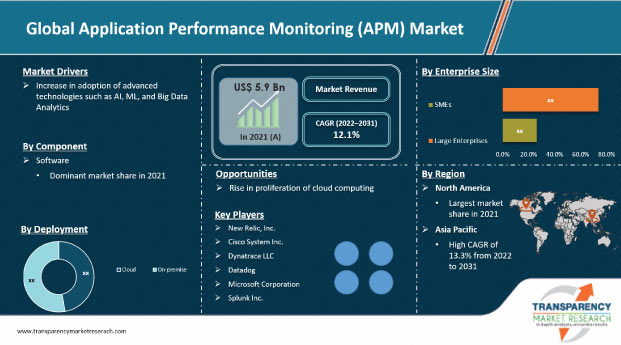
The application performance monitoring market stood over US$ 5.9 Bn in 2021
The application performance monitoring market is expected to reach cross of US$ 18.2 Bn by 2031
The application performance monitoring market is estimated to grow at a CAGR of 12.1% during the forecast period
Increase in adoption of advanced technologies such as AI, ML, and Big Data analytics
The BFSI segment accounts for the largest share of the application performance monitoring market
Asia Pacific is a more attractive region for vendors in the application performance monitoring market
Dynatrace LLC, Datadog, New Relic, Inc., Cisco System Inc., Splunk Inc., SolarWinds Worldwide, LLC, Aternity LLC, Broadcom Inc., Catchpoint Systems, Inc., Microsoft Corporation, Micro Focus, ManageEngine (Zoho Corporation Pvt. Ltd.), Instana (IBM Corporation), and Elasticsearch B.V.
1. Preface
1.1. Market Introduction
1.2. Market Segmentation
1.3. Key Research Objectives
2. Assumptions and Research Methodology
2.1. Research Methodology
2.1.1. List of Primary and Secondary Sources
2.2. Key Assumptions for Data Modelling
3. Executive Summary: Global Application Performance Monitoring Market
4. Market Overview
4.1. Market Definition
4.2. Technology/Product Roadmap
4.3. Market Factor Analysis
4.3.1. Forecast Factors
4.3.2. Ecosystem/Value Chain Analysis
4.3.3. Market Dynamics (Growth Influencers)
4.3.3.1. Drivers
4.3.3.2. Restraints
4.3.3.3. Opportunities
4.3.3.4. Impact Analysis of Drivers and Restraints
4.4. COVID-19 Impact Analysis
4.4.1. Impact of COVID-19 on Application Performance Monitoring Market
4.4.2. End-user Sentiment Analysis: Comparative Analysis on Spending
4.4.2.1. Increase in Spending
4.4.2.2. Decrease in Spending
4.4.3. Short-term and Long-term Impact on the Market
4.5. Market Opportunity Assessment – by Region (North America/Europe/Asia Pacific/Middle East & Africa/South America)
4.5.1. By Component
4.5.2. By Deployment
4.5.3. By Enterprise Size
4.5.4. By End-user
5. Global Application Performance Monitoring Market Analysis and Forecast
5.1. Market Revenue Analysis (US$ Bn), 2016-2031
5.1.1. Historic Growth Trends, 2016-2021
5.1.2. Forecast Trends, 2022-2031
5.2. Pricing Model Analysis/ Price Trend Analysis
6. Global Application Performance Monitoring Market Analysis, by Component
6.1. Overview and Definitions
6.2. Key Segment Analysis
6.3. Application Performance Monitoring Market Size (US$ Bn) Forecast, by Component, 2018 - 2031
6.3.1. Software
6.3.2. Services
6.3.2.1. Implementation and Integration
6.3.2.2. Support and Maintenance
7. Global Application Performance Monitoring Market Analysis, by Deployment
7.1. Overview and Definitions
7.2. Key Segment Analysis
7.3. Application Performance Monitoring Market Size (US$ Bn) Forecast, by Deployment, 2018 - 2031
7.3.1. Cloud
7.3.2. On-premise
8. Global Application Performance Monitoring Market Analysis, by Enterprise Size
8.1. Overview and Definitions
8.2. Key Segment Analysis
8.3. Application Performance Monitoring Market Size (US$ Bn) Forecast, by Enterprise Size, 2018 - 2031
8.3.1. Small & Medium Enterprises (SMEs)
8.3.2. Large Enterprises
9. Global Application Performance Monitoring Market Analysis, by End-user
9.1. Key Segment Analysis
9.2. Application Performance Monitoring Market Size (US$ Bn) Forecast, by End-user, 2018 - 2031
9.2.1. BFSI
9.2.2. IT & Telecom
9.2.3. Retail & E-commerce
9.2.4. Healthcare
9.2.5. Education
9.2.6. Media & Entertainment
9.2.7. Manufacturing
9.2.8. Others
10. Global Application Performance Monitoring Market Analysis and Forecasts, by Region
10.1. Key Findings
10.2. Market Size (US$ Bn) Forecast by Region, 2018-2031
10.2.1. North America
10.2.2. Europe
10.2.3. Asia Pacific
10.2.4. Middle East & Africa
10.2.5. South America
11. North America Application Performance Monitoring Market Analysis and Forecast
11.1. Regional Outlook
11.2. Application Performance Monitoring Market Size (US$ Bn) Analysis and Forecast, 2018 - 2031
11.2.1. By Component
11.2.2. By Deployment
11.2.3. By Enterprise Size
11.2.4. By End-user
11.3. Application Performance Monitoring Market Size (US$ Bn) Forecast, by Country, 2018 - 2031
11.3.1. U.S.
11.3.2. Canada
11.3.3. Mexico
12. Europe Application Performance Monitoring Market Analysis and Forecast
12.1. Regional Outlook
12.2. Application Performance Monitoring Market Size (US$ Bn) Analysis and Forecast, 2018 - 2031
12.2.1. By Component
12.2.2. By Deployment
12.2.3. By Enterprise Size
12.2.4. By End-user
12.3. Application Performance Monitoring Market Size (US$ Bn) Forecast, by Country & Sub-region, 2018 - 2031
12.3.1. Germany
12.3.2. U.K.
12.3.3. France
12.3.4. Italy
12.3.5. Spain
12.3.6. Rest of Europe
13. Asia Pacific Application Performance Monitoring Market Analysis and Forecast
13.1. Regional Outlook
13.2. Application Performance Monitoring Market Size (US$ Bn) Analysis and Forecast, 2018 - 2031
13.2.1. By Component
13.2.2. By Deployment
13.2.3. By Enterprise Size
13.2.4. By End-user
13.3. Application Performance Monitoring Market Size (US$ Bn) Forecast, by Country & Sub-region, 2018 - 2031
13.3.1. China
13.3.2. India
13.3.3. Japan
13.3.4. ASEAN
13.3.5. Rest of Asia Pacific
14. Middle East & Africa Application Performance Monitoring Market Analysis and Forecast
14.1. Regional Outlook
14.2. Application Performance Monitoring Market Size (US$ Bn) Analysis and Forecast, 2018 - 2031
14.2.1. By Component
14.2.2. By Deployment
14.2.3. By Enterprise Size
14.2.4. By End-user
14.3. Application Performance Monitoring Market Size (US$ Bn) Forecast, by Country & Sub-region, 2018 - 2031
14.3.1. Saudi Arabia
14.3.2. The United Arab Emirates
14.3.3. South Africa
14.3.4. Rest of Middle East & Africa
15. South America Application Performance Monitoring Market Analysis and Forecast
15.1. Regional Outlook
15.2. Application Performance Monitoring Market Size (US$ Bn) Analysis and Forecast, 2018 - 2031
15.2.1. By Component
15.2.2. By Deployment
15.2.3. By Enterprise Size
15.2.4. By End-user
15.3. Application Performance Monitoring Market Size (US$ Bn) Forecast, by Country & Sub-region, 2018 - 2031
15.3.1. Brazil
15.3.2. Argentina
15.3.3. Rest of South America
16. Competition Landscape
16.1. Market Competition Matrix, by Leading Players
16.2. Market Revenue Share Analysis (%), by Leading Players (2021)
16.3. Competitive Scenario
16.3.1. List of Emerging, Prominent and Leading Players
16.3.2. Major Mergers & Acquisitions, Expansions, Partnership, Contacts, Deals, etc.
17. Company Profiles
17.1. Dynatrace LLC
17.1.1. Business Overview
17.1.2. Company Revenue
17.1.3. Product Portfolio
17.1.4. Geographic Footprint
17.1.5. Strategic Partnership, Merger & Acquisition, Business Expansion, New Product Launch, Innovation etc.
17.2. Datadog
17.2.1. Business Overview
17.2.2. Company Revenue
17.2.3. Product Portfolio
17.2.4. Geographic Footprint
17.2.5. Strategic Partnership, Merger & Acquisition, Business Expansion, New Product Launch, Innovation etc.
17.3. New Relic, Inc.
17.3.1. Business Overview
17.3.2. Company Revenue
17.3.3. Product Portfolio
17.3.4. Geographic Footprint
17.3.5. Strategic Partnership, Merger & Acquisition, Business Expansion, New Product Launch, Innovation etc.
17.4. Cisco System Inc.
17.4.1. Business Overview
17.4.2. Company Revenue
17.4.3. Product Portfolio
17.4.4. Geographic Footprint
17.4.5. Strategic Partnership, Merger & Acquisition, Business Expansion, New Product Launch, Innovation etc.
17.5. Splunk Inc.
17.5.1. Business Overview
17.5.2. Company Revenue
17.5.3. Product Portfolio
17.5.4. Geographic Footprint
17.5.5. Strategic Partnership, Merger & Acquisition, Business Expansion, New Product Launch, Innovation etc.
17.6. SolarWinds Worldwide, LLC
17.6.1. Business Overview
17.6.2. Company Revenue
17.6.3. Product Portfolio
17.6.4. Geographic Footprint
17.6.5. Strategic Partnership, Merger & Acquisition, Business Expansion, New Product Launch, Innovation etc.
17.7. Aternity LLC
17.7.1. Business Overview
17.7.2. Company Revenue
17.7.3. Product Portfolio
17.7.4. Geographic Footprint
17.7.5. Strategic Partnership, Merger & Acquisition, Business Expansion, New Product Launch, Innovation etc.
17.8. Broadcom Inc.
17.8.1. Business Overview
17.8.2. Company Revenue
17.8.3. Product Portfolio
17.8.4. Geographic Footprint
17.8.5. Strategic Partnership, Merger & Acquisition, Business Expansion, New Product Launch, Innovation etc.
17.9. Catchpoint Systems, Inc.
17.9.1. Business Overview
17.9.2. Company Revenue
17.9.3. Product Portfolio
17.9.4. Geographic Footprint
17.9.5. Strategic Partnership, Merger & Acquisition, Business Expansion, New Product Launch, Innovation etc.
17.10. Microsoft Corporation
17.10.1. Business Overview
17.10.2. Company Revenue
17.10.3. Product Portfolio
17.10.4. Geographic Footprint
17.10.5. Strategic Partnership, Merger & Acquisition, Business Expansion, New Product Launch, Innovation etc.
17.11. Micro Focus
17.11.1. Business Overview
17.11.2. Company Revenue
17.11.3. Product Portfolio
17.11.4. Geographic Footprint
17.11.5. Strategic Partnership, Merger & Acquisition, Business Expansion, New Product Launch, Innovation etc.
17.12. ManageEngine (Zoho Corporation Pvt. Ltd.)
17.12.1. Business Overview
17.12.2. Company Revenue
17.12.3. Product Portfolio
17.12.4. Geographic Footprint
17.12.5. Strategic Partnership, Merger & Acquisition, Business Expansion, New Product Launch, Innovation etc.
17.13. Instana (IBM Corporation)
17.13.1. Business Overview
17.13.2. Company Revenue
17.13.3. Product Portfolio
17.13.4. Geographic Footprint
17.13.5. Strategic Partnership, Merger & Acquisition, Business Expansion, New Product Launch, Innovation etc.
17.14. Elasticsearch B.V.
17.14.1. Business Overview
17.14.2. Company Revenue
17.14.3. Product Portfolio
17.14.4. Geographic Footprint
17.14.5. Strategic Partnership, Merger & Acquisition, Business Expansion, New Product Launch, Innovation etc.
17.15. Others
18. Key Takeaways
List of Tables
Table 1: Acronyms Used in Application Performance Monitoring Market
Table 2: North America Application Performance Monitoring Market Revenue Analysis, by Country, 2022 - 2031 (US$ Bn)
Table 3: Europe Application Performance Monitoring Market Revenue Analysis, by Country, 2022 - 2031 (US$ Bn)
Table 4: Asia Pacific Application Performance Monitoring Market Revenue Analysis, by Country, 2022 - 2031 (US$ Bn)
Table 5: Middle East & Africa Application Performance Monitoring Market Revenue Analysis, by Country, 2022 and 2031 (US$ Bn)
Table 6: South America Application Performance Monitoring Market Revenue Analysis, by Country, 2022 - 2031 (US$ Bn)
Table 7: Global Application Performance Monitoring Market Value (US$ Bn) Forecast, by Component, 2018 – 2031
Table 8: Global Application Performance Monitoring Market Value (US$ Bn) Forecast, by Deployment, 2018 – 2031
Table 9: Global Application Performance Monitoring Market Value (US$ Bn) Forecast, by Enterprise Size, 2018 – 2031
Table 10: Global Application Performance Monitoring Market Value (US$ Bn) Forecast, by End-user, 2018 – 2031
Table 11: Global Application Performance Monitoring Market Volume (US$ Bn) Forecast, by Region, 2018 – 2031
Table 12: North America Application Performance Monitoring Market Value (US$ Bn) Forecast, by Component, 2018 – 2031
Table 13: North America Application Performance Monitoring Market Value (US$ Bn) Forecast, by Deployment, 2018 – 2031
Table 14: North America Application Performance Monitoring Market Value (US$ Bn) Forecast, by Enterprise Size, 2018 – 2031
Table 15: North America Application Performance Monitoring Market Value (US$ Bn) Forecast, by End-user, 2018 – 2031
Table 16: North America Application Performance Monitoring Market Value (US$ Bn) Forecast, by Country, 2018‒2031
Table 17: U.S. Application Performance Monitoring Market Revenue CAGR Breakdown (%), by Growth Term
Table 18: Canada Application Performance Monitoring Market Revenue CAGR Breakdown (%), by Growth Term
Table 19: Mexico Application Performance Monitoring Market Revenue CAGR Breakdown (%), by Growth Term
Table 20: Europe Application Performance Monitoring Market Value (US$ Bn) Forecast, by Component, 2018 – 2031
Table 21: Europe Application Performance Monitoring Market Value (US$ Bn) Forecast, by Deployment, 2018 – 2031
Table 22: Europe Application Performance Monitoring Market Value (US$ Bn) Forecast, by Enterprise Size, 2018 – 2031
Table 23: Europe Application Performance Monitoring Market Value (US$ Bn) Forecast, by End-user, 2018 – 2031
Table 24: Europe Application Performance Monitoring Market Value (US$ Bn) Forecast, by Country and Sub-region, 2018‒2031
Table 25: Germany Application Performance Monitoring Market Revenue CAGR Breakdown (%), by Growth Term
Table 26: U.K. Application Performance Monitoring Market Revenue CAGR Breakdown (%), by Growth Term
Table 27: France Application Performance Monitoring Market Revenue CAGR Breakdown (%), by Growth Term
Table 28: Spain Application Performance Monitoring Market Revenue CAGR Breakdown (%), by Growth Term
Table 29: Italy Application Performance Monitoring Market Revenue CAGR Breakdown (%), by Growth Term
Table 30: Asia Pacific Application Performance Monitoring Market Value (US$ Bn) Forecast, by Component, 2018 – 2031
Table 31: Asia Pacific Application Performance Monitoring Market Value (US$ Bn) Forecast, by Deployment, 2018 – 2031
Table 32: Asia Pacific Application Performance Monitoring Market Value (US$ Bn) Forecast, by Enterprise Size, 2018 – 2031
Table 33: Asia Pacific Application Performance Monitoring Market Value (US$ Bn) Forecast, by End-user, 2018 – 2031
Table 34: Asia Pacific Application Performance Monitoring Market Value (US$ Bn) Forecast, by Country and Sub-region, 2018‒2031
Table 35: China Application Performance Monitoring Market Revenue CAGR Breakdown (%), by Growth Term
Table 36: India Application Performance Monitoring Market Revenue CAGR Breakdown (%), by Growth Term
Table 37: Japan Application Performance Monitoring Market Revenue CAGR Breakdown (%), by Growth Term
Table 38: ASEAN Application Performance Monitoring Market Revenue CAGR Breakdown (%), by Growth Term
Table 39: Middle East & Africa Application Performance Monitoring Market Value (US$ Bn) Forecast, by Component, 2018 – 2031
Table 40: Middle East & Africa Application Performance Monitoring Market Value (US$ Bn) Forecast, by Deployment, 2018 – 2031
Table 41: Middle East & Africa Application Performance Monitoring Market Value (US$ Bn) Forecast, by Enterprise Size, 2018 – 2031
Table 42: Middle East & Africa Application Performance Monitoring Market Value (US$ Bn) Forecast, by End-user, 2018 – 2031
Table 43: Middle East & Africa Application Performance Monitoring Market Value (US$ Bn) Forecast, by Country and Sub-region, 2018‒2031
Table 44: Saudi Arabia Application Performance Monitoring Market Revenue CAGR Breakdown (%), by Growth Term
Table 45: United Arab Emirates Application Performance Monitoring Market Revenue CAGR Breakdown (%), by Growth Term
Table 46: South Africa Application Performance Monitoring Market Revenue CAGR Breakdown (%), by Growth Term
Table 47: South America Application Performance Monitoring Market Value (US$ Bn) Forecast, by Component, 2018 – 2031
Table 48: South America Application Performance Monitoring Market Value (US$ Bn) Forecast, by Deployment, 2018 – 2031
Table 49: South America Application Performance Monitoring Market Value (US$ Bn) Forecast, by Enterprise Size, 2018 – 2031
Table 50: South America Application Performance Monitoring Market Value (US$ Bn) Forecast, by End-user, 2018 – 2031
Table 51: South America Application Performance Monitoring Market Value (US$ Bn) Forecast, by Country and Sub-region, 2018‒2031
Table 52: Brazil Emirates Application Performance Monitoring Market Revenue CAGR Breakdown (%), by Growth Term
Table 53: Argentina Application Performance Monitoring Market Revenue CAGR Breakdown (%), by Growth Term
List of Figures
Figure 1: Global Application Performance Monitoring Market Size (US$ Bn) Forecast, 2018–2031
Figure 2: Global Application Performance Monitoring Market Revenue (US$ Bn) Opportunity Assessment, by Region, 2022E
Figure 3: Top Segment Analysis of Application Performance Monitoring Market
Figure 4: Global Application Performance Monitoring Market Revenue (US$ Bn) Opportunity Assessment, by Region, 2031F
Figure 5: Global Application Performance Monitoring Market Attractiveness Assessment, by Component
Figure 6: Global Application Performance Monitoring Market Attractiveness Assessment, by Deployment
Figure 7: Global Application Performance Monitoring Market Attractiveness Assessment, by Enterprise Size
Figure 8: Global Application Performance Monitoring Market Attractiveness Assessment, by End-user
Figure 9: Global Application Performance Monitoring Market Attractiveness Assessment, by Region
Figure 10: Global Application Performance Monitoring Market Revenue (US$ Bn) Historic Trends, 2016 - 2021
Figure 11: Global Application Performance Monitoring Market Revenue Opportunity (US$ Bn) Historic Trends, 2016 - 2021
Figure 12: Global Application Performance Monitoring Market Value Share Analysis, by Component, 2022
Figure 13: Global Application Performance Monitoring Market Value Share Analysis, by Component, 2031
Figure 14: Global Application Performance Monitoring Market Absolute Opportunity (US$ Bn), by Software, 2022 – 2031
Figure 15: Global Application Performance Monitoring Market Absolute Opportunity (US$ Bn), by Services, 2022 – 2031
Figure 16: Global Application Performance Monitoring Market Value Share Analysis, by Deployment, 2022
Figure 17: Global Application Performance Monitoring Market Value Share Analysis, by Deployment, 2031
Figure 18: Global Application Performance Monitoring Market Absolute Opportunity (US$ Bn), by Cloud, 2022 – 2031
Figure 19: Global Application Performance Monitoring Market Absolute Opportunity (US$ Bn), by On-premise, 2022 – 2031
Figure 20: Global Application Performance Monitoring Market Value Share Analysis, by Enterprise Size, 2022
Figure 21: Global Application Performance Monitoring Market Value Share Analysis, by Enterprise Size, 2031
Figure 22: Global Application Performance Monitoring Market Absolute Opportunity (US$ Bn), by SMEs, 2022 – 2031
Figure 23: Global Application Performance Monitoring Market Absolute Opportunity (US$ Bn), by Large Enterprises, 2022 – 2031
Figure 24: Global Application Performance Monitoring Market Value Share Analysis, by End-user, 2022
Figure 25: Global Application Performance Monitoring Market Value Share Analysis, by End-user, 2031
Figure 26: Global Application Performance Monitoring Market Absolute Opportunity (US$ Bn), by BFSI, 2022 – 2031
Figure 27: Global Application Performance Monitoring Market Absolute Opportunity (US$ Bn), by IT & Telecom, 2022 – 2031
Figure 28: Global Application Performance Monitoring Market Absolute Opportunity (US$ Bn), by Retail & E-commerce, 2022 – 2031
Figure 29: Global Application Performance Monitoring Market Absolute Opportunity (US$ Bn), by Healthcare, 2022 – 2031
Figure 30: Global Application Performance Monitoring Market Absolute Opportunity (US$ Bn), by Education, 2022 – 2031
Figure 31: Global Application Performance Monitoring Market Absolute Opportunity (US$ Bn), by Media & Entertainment, 2022 – 2031
Figure 32: Global Application Performance Monitoring Market Absolute Opportunity (US$ Bn), by Manufacturing, 2022 – 2031
Figure 33: Global Application Performance Monitoring Market Absolute Opportunity (US$ Bn), by Others, 2022 – 2031
Figure 34: Global Application Performance Monitoring Market Opportunity (US$ Bn), by Region
Figure 35: Global Application Performance Monitoring Market Opportunity Share (%), by Region, 2022–2031
Figure 36: Global Application Performance Monitoring Market Size (US$ Bn), by Region, 2022 & 2031
Figure 37: Global Application Performance Monitoring Market Value Share Analysis, by Region, 2022
Figure 38: Global Application Performance Monitoring Market Value Share Analysis, by Region, 2031
Figure 39: North America Application Performance Monitoring Market Absolute Opportunity (US$ Bn), 2022 – 2031
Figure 40: Europe Application Performance Monitoring Market Absolute Opportunity (US$ Bn), 2022 – 2031
Figure 41: Asia Pacific Application Performance Monitoring Market Absolute Opportunity (US$ Bn), 2022 – 2031
Figure 42: Middle East & Africa Application Performance Monitoring Market Absolute Opportunity (US$ Bn), 2022 – 2031
Figure 43: South America Application Performance Monitoring Market Absolute Opportunity (US$ Bn), 2022 – 2031
Figure 44: North America Application Performance Monitoring Market Revenue Opportunity Share, by Component
Figure 45: North America Application Performance Monitoring Market Revenue Opportunity Share, by Deployment
Figure 46: North America Application Performance Monitoring Market Revenue Opportunity Share, by Enterprise Size
Figure 47: North America Application Performance Monitoring Market Revenue Opportunity Share, by End-user
Figure 48: North America Application Performance Monitoring Market Revenue Opportunity Share, by Country
Figure 49: North America Application Performance Monitoring Market Value Share Analysis, by Component, 2022
Figure 50: North America Application Performance Monitoring Market Value Share Analysis, by Component, 2031
Figure 51: North America Application Performance Monitoring Market Absolute Opportunity (US$ Bn), by Software, 2022 – 2031
Figure 52: North America Application Performance Monitoring Market Absolute Opportunity (US$ Bn), by Services, 2022 – 2031
Figure 53: North America Application Performance Monitoring Market Value Share Analysis, by Deployment, 2022
Figure 54: North America Application Performance Monitoring Market Value Share Analysis, by Deployment, 2031
Figure 55: North America Application Performance Monitoring Market Absolute Opportunity (US$ Bn), by Cloud, 2022 – 2031
Figure 56: North America Application Performance Monitoring Market Absolute Opportunity (US$ Bn), by On-premise, 2022 – 2031
Figure 57: North America Application Performance Monitoring Market Value Share Analysis, by Enterprise Size, 2022
Figure 58: North America Application Performance Monitoring Market Value Share Analysis, by Enterprise Size, 2031
Figure 59: North America Application Performance Monitoring Market Absolute Opportunity (US$ Bn), by SMEs, 2022 – 2031
Figure 60: North America Application Performance Monitoring Market Absolute Opportunity (US$ Bn), by Large Enterprises, 2022 – 2031
Figure 61: North America Application Performance Monitoring Market Value Share Analysis, by End-user, 2022
Figure 62: North America Application Performance Monitoring Market Value Share Analysis, by End-user, 2031
Figure 63: North America Application Performance Monitoring Market Absolute Opportunity (US$ Bn), by BFSI, 2022 – 2031
Figure 64: North America Application Performance Monitoring Market Absolute Opportunity (US$ Bn), by IT & Telecom, 2022 – 2031
Figure 65: North America Application Performance Monitoring Market Absolute Opportunity (US$ Bn), by Retail & E-commerce, 2022 – 2031
Figure 66: North America Application Performance Monitoring Market Absolute Opportunity (US$ Bn), by Healthcare, 2022 – 2031
Figure 67: North America Application Performance Monitoring Market Absolute Opportunity (US$ Bn), by Education, 2022 – 2031
Figure 68: North America Application Performance Monitoring Market Absolute Opportunity (US$ Bn), by Media & Entertainment, 2022 – 2031
Figure 69: North America Application Performance Monitoring Market Absolute Opportunity (US$ Bn), by Manufacturing, 2022 – 2031
Figure 70: North America Application Performance Monitoring Market Absolute Opportunity (US$ Bn), by Others, 2022 – 2031
Figure 71: North America Application Performance Monitoring Market Value Share Analysis, by Country, 2022
Figure 72: North America Application Performance Monitoring Market Value Share Analysis, by Country, 2031
Figure 73: U.S. Application Performance Monitoring Market Opportunity Growth Analysis (US$ Bn) Forecast, 2022 – 2031
Figure 74: Canada Application Performance Monitoring Market Opportunity Growth Analysis (US$ Bn) Forecast, 2022 – 2031
Figure 75: Mexico Application Performance Monitoring Market Opportunity Growth Analysis (US$ Bn) Forecast, 2022 – 2031
Figure 76: Europe Application Performance Monitoring Market Revenue Opportunity Share, by Component
Figure 77: Europe Application Performance Monitoring Market Revenue Opportunity Share, by Deployment
Figure 78: Europe Application Performance Monitoring Market Revenue Opportunity Share, by Enterprise Size
Figure 79: Europe Application Performance Monitoring Market Revenue Opportunity Share, by End-user
Figure 80: Europe Application Performance Monitoring Market Revenue Opportunity Share, by Country
Figure 81: Europe Application Performance Monitoring Market Value Share Analysis, by Component, 2022
Figure 82: Europe Application Performance Monitoring Market Value Share Analysis, by Component, 2031
Figure 83: Europe Application Performance Monitoring Market Absolute Opportunity (US$ Bn), by Software, 2022 – 2031
Figure 84: Europe Application Performance Monitoring Market Absolute Opportunity (US$ Bn), by Services, 2022 – 2031
Figure 85: Europe Application Performance Monitoring Market Value Share Analysis, by Deployment, 2022
Figure 86: Europe Application Performance Monitoring Market Value Share Analysis, by Deployment, 2031
Figure 87: Europe Application Performance Monitoring Market Absolute Opportunity (US$ Bn), by Cloud, 2022 – 2031
Figure 88: Europe Application Performance Monitoring Market Absolute Opportunity (US$ Bn), by On-premise, 2022 – 2031
Figure 89: Europe Application Performance Monitoring Market Value Share Analysis, by Enterprise Size, 2022
Figure 90: Europe Application Performance Monitoring Market Value Share Analysis, by Enterprise Size, 2031
Figure 91: Europe Application Performance Monitoring Market Absolute Opportunity (US$ Bn), by SMEs, 2022 – 2031
Figure 92: Europe Application Performance Monitoring Market Absolute Opportunity (US$ Bn), by Large Enterprises, 2022 – 2031
Figure 93: Europe Application Performance Monitoring Market Value Share Analysis, by End-user, 2022
Figure 94: Europe Application Performance Monitoring Market Value Share Analysis, by End-user, 2031
Figure 95: Europe Application Performance Monitoring Market Absolute Opportunity (US$ Bn), by BFSI, 2022 – 2031
Figure 96: Europe Application Performance Monitoring Market Absolute Opportunity (US$ Bn), by IT & Telecom, 2022 – 2031
Figure 97: Europe Application Performance Monitoring Market Absolute Opportunity (US$ Bn), by Retail & E-commerce, 2022 – 2031
Figure 98: Europe Application Performance Monitoring Market Absolute Opportunity (US$ Bn), by Healthcare, 2022 – 2031
Figure 99: Europe Application Performance Monitoring Market Absolute Opportunity (US$ Bn), by Education, 2022 – 2031
Figure 100: Europe Application Performance Monitoring Market Absolute Opportunity (US$ Bn), by Media & Entertainment, 2022 – 2031
Figure 101: Europe Application Performance Monitoring Market Absolute Opportunity (US$ Bn), by Manufacturing, 2022 – 2031
Figure 102: Europe Application Performance Monitoring Market Absolute Opportunity (US$ Bn), by Others, 2022 – 2031
Figure 103: Europe Application Performance Monitoring Market Value Share Analysis, by Country and Sub-region, 2022
Figure 104: Europe Application Performance Monitoring Market Value Share Analysis, by Country and Sub-region, 2031
Figure 105: Germany Application Performance Monitoring Market Opportunity Growth Analysis (US$ Bn) Forecast, 2022 – 2031
Figure 106: U.K. Application Performance Monitoring Market Opportunity Growth Analysis (US$ Bn) Forecast, 2022 – 2031
Figure 107: France Application Performance Monitoring Market Opportunity Growth Analysis (US$ Bn) Forecast, 2022 – 2031
Figure 108: Spain Application Performance Monitoring Market Opportunity Growth Analysis (US$ Bn) Forecast, 2022 – 2031
Figure 109: Italy Application Performance Monitoring Market Opportunity Growth Analysis (US$ Bn) Forecast, 2022 – 2031
Figure 110: Asia Pacific Application Performance Monitoring Market Revenue Opportunity Share, by Component
Figure 111: Asia Pacific Application Performance Monitoring Market Revenue Opportunity Share, by Deployment
Figure 112: Asia Pacific Application Performance Monitoring Market Revenue Opportunity Share, by Enterprise Size
Figure 113: Asia Pacific Application Performance Monitoring Market Revenue Opportunity Share, by End-user
Figure 114: Asia Pacific Application Performance Monitoring Market Revenue Opportunity Share, by Country
Figure 115: Asia Pacific Application Performance Monitoring Market Value Share Analysis, by Component, 2022
Figure 116: Asia Pacific Application Performance Monitoring Market Value Share Analysis, by Component, 2031
Figure 117: Asia Pacific Application Performance Monitoring Market Absolute Opportunity (US$ Bn), by Software, 2022 – 2031
Figure 118: Asia Pacific Application Performance Monitoring Market Absolute Opportunity (US$ Bn), by Services, 2022 – 2031
Figure 119: Asia Pacific Application Performance Monitoring Market Value Share Analysis, by Deployment, 2022
Figure 120: Asia Pacific Application Performance Monitoring Market Value Share Analysis, by Deployment, 2031
Figure 121: Asia Pacific Application Performance Monitoring Market Absolute Opportunity (US$ Bn), by Cloud, 2022 – 2031
Figure 122: Asia Pacific Application Performance Monitoring Market Absolute Opportunity (US$ Bn), by On-premise, 2022 – 2031
Figure 123: Asia Pacific Application Performance Monitoring Market Value Share Analysis, by Enterprise Size, 2022
Figure 124: Asia Pacific Application Performance Monitoring Market Value Share Analysis, by Enterprise Size, 2031
Figure 125: Asia Pacific Application Performance Monitoring Market Absolute Opportunity (US$ Bn), by SMEs, 2022 – 2031
Figure 126: Asia Pacific Application Performance Monitoring Market Absolute Opportunity (US$ Bn), by Large Enterprises, 2022 – 2031
Figure 127: Asia Pacific Application Performance Monitoring Market Value Share Analysis, by End-user, 2022
Figure 128: Asia Pacific Application Performance Monitoring Market Value Share Analysis, by End-user, 2031
Figure 129: Asia Pacific Application Performance Monitoring Market Absolute Opportunity (US$ Bn), by BFSI, 2022 – 2031
Figure 130: Asia Pacific Application Performance Monitoring Market Absolute Opportunity (US$ Bn), by IT & Telecom, 2022 – 2031
Figure 131: Asia Pacific Application Performance Monitoring Market Absolute Opportunity (US$ Bn), by Retail & E-commerce, 2022 – 2031
Figure 132: Asia Pacific Application Performance Monitoring Market Absolute Opportunity (US$ Bn), by Healthcare, 2022 – 2031
Figure 133: Asia Pacific Application Performance Monitoring Market Absolute Opportunity (US$ Bn), by Education, 2022 – 2031
Figure 134: Asia Pacific Application Performance Monitoring Market Absolute Opportunity (US$ Bn), by Media & Entertainment, 2022 – 2031
Figure 135: Asia Pacific Application Performance Monitoring Market Absolute Opportunity (US$ Bn), by Manufacturing, 2022 – 2031
Figure 136: Asia Pacific Application Performance Monitoring Market Absolute Opportunity (US$ Bn), by Others, 2022 – 2031
Figure 137: Asia Pacific Application Performance Monitoring Market Value Share Analysis, by Country and Sub-region, 2022
Figure 138: Asia Pacific Application Performance Monitoring Market Value Share Analysis, by Country and Sub-region, 2031
Figure 139: China Application Performance Monitoring Market Opportunity Growth Analysis (US$ Bn) Forecast, 2022 – 2031
Figure 140: India Application Performance Monitoring Market Opportunity Growth Analysis (US$ Bn) Forecast, 2022 – 2031
Figure 141: Japan Application Performance Monitoring Market Opportunity Growth Analysis (US$ Bn) Forecast, 2022 – 2031
Figure 142: ASEAN Application Performance Monitoring Market Opportunity Growth Analysis (US$ Bn) Forecast, 2022 – 2031
Figure 143: Middle East & Africa Application Performance Monitoring Market Revenue Opportunity Share, by Component
Figure 144: Middle East & Africa Application Performance Monitoring Market Revenue Opportunity Share, by Deployment
Figure 145: Middle East & Africa Application Performance Monitoring Market Revenue Opportunity Share, by Enterprise Size
Figure 146: Middle East & Africa Application Performance Monitoring Market Revenue Opportunity Share, by End-user
Figure 147: Middle East & Africa Application Performance Monitoring Market Revenue Opportunity Share, by Country
Figure 148: Middle East & Africa Application Performance Monitoring Market Value Share Analysis, by Component, 2022
Figure 149: Middle East & Africa Application Performance Monitoring Market Value Share Analysis, by Component, 2031
Figure 150: Middle East & Africa Application Performance Monitoring Market Absolute Opportunity (US$ Bn), by Software, 2022 – 2031
Figure 151: Middle East & Africa Application Performance Monitoring Market Absolute Opportunity (US$ Bn), by Services, 2022 – 2031
Figure 152: Middle East & Africa Application Performance Monitoring Market Value Share Analysis, by Deployment, 2022
Figure 153: Middle East & Africa Application Performance Monitoring Market Value Share Analysis, by Deployment, 2031
Figure 154: Middle East & Africa Application Performance Monitoring Market Absolute Opportunity (US$ Bn), by Cloud, 2022 – 2031
Figure 155: Middle East & Africa Application Performance Monitoring Market Absolute Opportunity (US$ Bn), by On-premise, 2022 – 2031
Figure 156: Middle East & Africa Application Performance Monitoring Market Value Share Analysis, by Enterprise Size, 2022
Figure 157: Middle East & Africa Application Performance Monitoring Market Value Share Analysis, by Enterprise Size, 2031
Figure 158: Middle East & Africa Application Performance Monitoring Market Absolute Opportunity (US$ Bn), by SMEs, 2022 – 2031
Figure 159: Middle East & Africa Application Performance Monitoring Market Absolute Opportunity (US$ Bn), by Large Enterprises, 2022 – 2031
Figure 160: Middle East & Africa Application Performance Monitoring Market Value Share Analysis, by End-user, 2022
Figure 161: Middle East & Africa Application Performance Monitoring Market Value Share Analysis, by End-user, 2031
Figure 162: Middle East & Africa Application Performance Monitoring Market Absolute Opportunity (US$ Bn), by BFSI, 2022 – 2031
Figure 163: Middle East & Africa Application Performance Monitoring Market Absolute Opportunity (US$ Bn), by IT & Telecom, 2022 – 2031
Figure 164: Middle East & Africa Application Performance Monitoring Market Absolute Opportunity (US$ Bn), by Retail & E-commerce, 2022 – 2031
Figure 165: Middle East & Africa Application Performance Monitoring Market Absolute Opportunity (US$ Bn), by Healthcare, 2022 – 2031
Figure 166: Middle East & Africa Application Performance Monitoring Market Absolute Opportunity (US$ Bn), by Education, 2022 – 2031
Figure 167: Middle East & Africa Application Performance Monitoring Market Absolute Opportunity (US$ Bn), by Media & Entertainment, 2022 – 2031
Figure 168: Middle East & Africa Application Performance Monitoring Market Absolute Opportunity (US$ Bn), by Manufacturing, 2022 – 2031
Figure 169: Middle East & Africa Application Performance Monitoring Market Absolute Opportunity (US$ Bn), by Others, 2022 – 2031
Figure 170: Middle East & Africa Application Performance Monitoring Market Value Share Analysis, by Country and Sub-region, 2022
Figure 171: Middle East & Africa Application Performance Monitoring Market Value Share Analysis, by Country and Sub-region, 2031
Figure 172: Saudi Arabia Application Performance Monitoring Market Opportunity Growth Analysis (US$ Bn) Forecast, 2022 – 2031
Figure 173: United Arab Emirates Application Performance Monitoring Market Opportunity Growth Analysis (US$ Bn) Forecast, 2022 – 2031
Figure 174: South Africa Application Performance Monitoring Market Opportunity Growth Analysis (US$ Bn) Forecast, 2022 – 2031
Figure 175: South America Application Performance Monitoring Market Revenue Opportunity Share, by Component
Figure 176: South America Application Performance Monitoring Market Revenue Opportunity Share, by Deployment
Figure 177: South America Application Performance Monitoring Market Revenue Opportunity Share, by Enterprise Size
Figure 178: South America Application Performance Monitoring Market Revenue Opportunity Share, by End-user
Figure 179: South America Application Performance Monitoring Market Revenue Opportunity Share, by Country
Figure 180: South America Application Performance Monitoring Market Value Share Analysis, by Component, 2022
Figure 181: South America Application Performance Monitoring Market Value Share Analysis, by Component, 2031
Figure 182: South America Application Performance Monitoring Market Absolute Opportunity (US$ Bn), by Software, 2022 – 2031
Figure 183: South America Application Performance Monitoring Market Absolute Opportunity (US$ Bn), by Services, 2022 – 2031
Figure 184: South America Application Performance Monitoring Market Value Share Analysis, by Deployment, 2022
Figure 185: South America Application Performance Monitoring Market Value Share Analysis, by Deployment, 2031
Figure 186: South America Application Performance Monitoring Market Absolute Opportunity (US$ Bn), by Cloud, 2022 – 2031
Figure 187: South America Application Performance Monitoring Market Absolute Opportunity (US$ Bn), by On-premise, 2022 – 2031
Figure 188: South America Application Performance Monitoring Market Value Share Analysis, by Enterprise Size, 2022
Figure 189: South America Application Performance Monitoring Market Value Share Analysis, by Enterprise Size, 2031
Figure 190: South America Application Performance Monitoring Market Absolute Opportunity (US$ Bn), by SMEs, 2022 – 2031
Figure 191: South America Application Performance Monitoring Market Absolute Opportunity (US$ Bn), by Large Enterprises, 2022 – 2031
Figure 192: South America Application Performance Monitoring Market Value Share Analysis, by End-user, 2022
Figure 193: South America Application Performance Monitoring Market Value Share Analysis, by End-user, 2031
Figure 194: South America Application Performance Monitoring Market Absolute Opportunity (US$ Bn), by BFSI, 2022 – 2031
Figure 195: South America Application Performance Monitoring Market Absolute Opportunity (US$ Bn), by IT & Telecom, 2022 – 2031
Figure 196: South America Application Performance Monitoring Market Absolute Opportunity (US$ Bn), by Retail & E-commerce, 2022 – 2031
Figure 197: South America Application Performance Monitoring Market Absolute Opportunity (US$ Bn), by Healthcare, 2022 – 2031
Figure 198: South America Application Performance Monitoring Market Absolute Opportunity (US$ Bn), by Education, 2022 – 2031
Figure 199: South America Application Performance Monitoring Market Absolute Opportunity (US$ Bn), by Media & Entertainment, 2022 – 2031
Figure 200: South America Application Performance Monitoring Market Absolute Opportunity (US$ Bn), by Manufacturing, 2022 – 2031
Figure 201: South America Application Performance Monitoring Market Absolute Opportunity (US$ Bn), by Others, 2022 – 2031
Figure 202: South America Application Performance Monitoring Market Value Share Analysis, by Country and Sub-region, 2022
Figure 203: South America Application Performance Monitoring Market Value Share Analysis, by Country and Sub-region, 2031
Figure 204: Brazil Application Performance Monitoring Market Opportunity Growth Analysis (US$ Bn) Forecast, 2022 – 2031
Figure 205: Argentina Application Performance Monitoring Market Opportunity Growth Analysis (US$ Bn) Forecast, 2022 – 2031
Copyright © Transparency Market Research, Inc. All Rights reserved
Trust Online


Application Performance Monitoring Market
