
Reports
Reports
Analysts’ Viewpoint
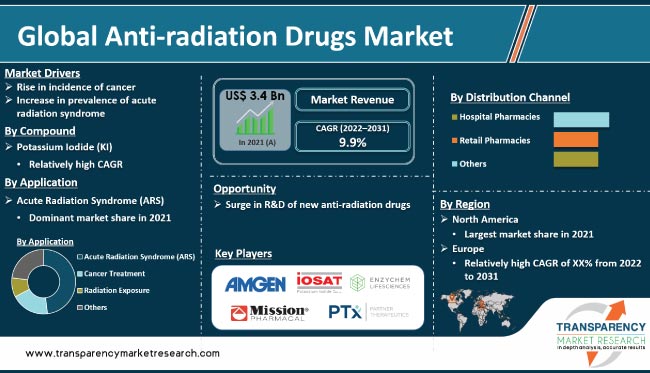
High prevalence of cancer and Acute Radiation Syndrome (ARS) is driving the anti-radiation drugs business. Potassium iodide (KI), an anti-radiation drug, provides some protection in cases of radiation exposure. Rise in concerns regarding the usage of nuclear weapons in wars is expected to augment the demand for anti-radiation pills. Detonation of a nuclear weapon may lead to the release of radioactive iodine.
Biotechnology firms are getting government contracts to develop drugs for the treatment of ARS. Vendors in the anti-radiation drugs sector are investing significantly in expansion of their production capabilities. They are also launching new products to broaden their anti-radiation drugs market share.
Anti-radiation drugs offer protection against radiation exposure. These drugs include KI, Prussian Blue, and DTPA (Diethylenetriamine pentaacetate). Anti-radiation medicines help block the absorption and subsequent concentration of radioactive iodine in the thyroid gland. KI must be consumed before or shortly after exposure to radioactive iodine for better results. It is effective only against radioactive iodine and not against other types of radiation. Oxidation of ferrous ferrocyanide salts produces Prussian blue that is used for the treatment of thallium poisoning or radioactive cesium poisoning.
Radiological preparedness and development of radiation countermeasures have become critical owing to the surge in risk of radiological and nuclear accidents or terrorist attacks. These measures are fueling the radiation detection, monitoring, and safety market. Radiation countermeasures include compounds that can potentially counteract the effects of either accidental or deliberate radiation exposure (e.g., nuclear reactor meltdown, dirty bomb, or nuclear bomb explosion).
The U.S. recently invested US$ 290 Mn on anti-radiation pills to "save lives following radiation and nuclear emergencies." In October 2022, the U.S. Department of Health and Human Services (HHS) announced the purchase of the drug Nplate from Amgen USA Inc. as part of a "long-standing program" of emergency preparedness using authority and funds authorized by the Project Bioshield Act of 2004. According to the HHS, Nplate is intended for the treatment of patients with ARS, which occurs when a person's entire body is exposed to a high dose of penetrating radiation. Thus, rise in investment in radiation countermeasures is fueling the anti-radiation drugs market.
Various studies are currently focusing on the development of radiopharmaceuticals, a new class of drugs that delivers radiation therapy directly and specifically to cancer cells. Over the last few years, there has been a surge in research and clinical trials involving new radiopharmaceuticals. Radiopharmaceuticals are being developed and tested for a variety of cancers, including melanoma, lung cancer, colorectal cancer, and leukemia.
Radioprotectors are compounds used to protect against radiation injury. They are usually administered prior to radiation exposure. Mitigators can protect against radiation injury when given after exposure but before symptoms appear. Radioprotectors and mitigators have the potential to improve outcomes of radiotherapy in cancer treatment by allowing higher doses of radiation and/or reducing damage to normal tissues. Thus, R&D in radioprotectors and mitigators is anticipated to fuel market expansion during the forecast period.
In terms of compound, the Potassium Iodide (KI) segment held significant share of the industry in 2021. KI tablets offer some protection in cases of radiation exposure. They contain non-radioactive iodine and can aid in blocking the radioactive iodine absorption and subsequent concentration in the thyroid gland. The active ingredient, KI, is a highly soluble form of iodine that the body absorbs and stores in the thyroid gland. This saturates the gland, filling it to capacity. Thus, the body rejects and excretes the radioactive form when exposed to radioactive iodine.
KI has been tested numerous times, both in the lab and during the Chernobyl disaster. The U.S. Nuclear Regulatory Commission (NRC) documented its safety and effectiveness, noting that children exposed to radiation at Chernobyl were much safer if given KI. Some radiological emergencies may cause large amounts of radioiodine to be released into the environment. Inhaling or ingesting radioiodine-contaminated food can cause thyroid radiation injury, due to the accumulation of iodine in the thyroid gland.
According to the latest anti-radiation drugs market trends, the Acute Radiation Syndrome (ARS) application segment accounted for the largest share of the global anti-radiation drugs business in 2021. ARS is one of the most challenging aspects of public health and medical response to a nuclear or radiological incident.
ARS is a group of syndromes that develops after short-term whole-body exposure to ionizing radiation at doses greater than 0.7-1.0 Gy. Bone marrow syndrome, gastrointestinal syndrome, cardiovascular syndrome, central nervous system (or neurological) syndrome, and cutaneous (skin) syndrome are the most common syndromes.
Bone marrow syndrome is a common cause of death due to the destruction of bone marrow, which causes infections and hemorrhage. Protein-based medications such as filgrastim (Neupogen), sargramostim (Leukine), and pegfilgrastim (Neulasta) may increase white blood cell production and aid in the prevention of subsequent infections.
In terms of distribution channel, the hospital pharmacies segment is projected to account for major share of the industry during the forecast period. Growth of the segment can be ascribed to rise in the burden of cancer worldwide. Additionally, increase in healthcare expenditure in developing and developed economies and surge in the number of cancer specialty hospitals are driving the segment.
The retail pharmacies segment is expected to grow at a significant rate during the forecast period due to the approval and launch of new drugs. In May 2016, the FDA approved an abbreviated new drug application from Mission Pharmacal Company for over-the-counter liquid potassium iodide oral solution USP. Anti-radiation medication is intended for the prevention of thyroid cancer in the event of a nuclear emergency.
North America is projected to dominate the global business during the forecast period. Market progress in the region can be ascribed to the increase in number of radiation facilities and rise in investment in the anti-radiation devices market. The U.S. Government has been instrumental in the development of drugs and biologics as Medical Countermeasures (MCMs) for ARS and Delayed Effects of Acute Radiation Exposure (DEARE).
The MCM program focuses on the development of drugs approved by the FDA for usage as radiation injury mitigators following a nuclear detonation. The National Cancer Institute (NCI) is engaged in enhancing these R&D efforts and investments to explore their potential usage for cancer treatment. Thus, increase in R&D of anti-radiation drugs is anticipated to propel market statistics in North America.
The market for anti-radiation drugs is consolidated, with the presence of a small number of leading players. Expansion of product portfolio and mergers & acquisitions are key strategies implemented by prominent manufacturers. Amgen Inc., Anbex Inc., Arco Pharmaceuticals LLC, BTG International Inc., Cellphire, Inc., Chrysalis BioTherapeutics, Inc., Darnitsa, Enzychem Lifesciences Corporation, Humanetics Corporation, Mission Pharmacal Company, Myelo Therapeutics GmbH, Partner Therapeutics, and Pluri Inc. are major entities operating in the market.
The market report profiles key players based on parameters such as company overview, financial overview, business strategies, product portfolio, business segments, and recent developments.
|
Attribute |
Detail |
|
Market Size Value in 2021 |
US$ 3.4 Bn |
|
Market Forecast Value in 2031 |
More than US$ 9.6 Bn |
|
Growth Rate (CAGR) |
9.9% |
|
Forecast Period |
2022–2031 |
|
Historical Data Available for |
2017–2020 |
|
Quantitative Units |
US$ Bn for Value |
|
Market Analysis |
It includes segment analysis and regional level analysis. Furthermore, qualitative analysis includes drivers, restraints, opportunities, key trends, Porter’s Five Forces analysis, value chain analysis, and key trend analysis. |
|
Competition Landscape |
|
|
Format |
Electronic (PDF) + Excel |
|
Market Segmentation |
|
|
Regions Covered |
|
|
Countries Covered |
|
|
Companies Profiled |
|
|
Customization Scope |
Available upon request |
|
Pricing |
Available upon request |
It was valued at US$ 3.4 Bn in 2021
It is projected to reach more than US$ 9.6 Bn by 2031
The business is anticipated to grow at a CAGR of 9.9% from 2022 to 2031
Increase in prevalence of cancer and rise in number of radiation therapies
North America is expected to account for major share during the forecast period
Amgen Inc., Anbex Inc., Arco Pharmaceuticals LLC, BTG International Inc., Cellphire, Inc., Chrysalis BioTherapeutics, Inc., Darnitsa, Enzychem Lifesciences Corporation, Humanetics Corporation, Mission Pharmacal Company, Myelo Therapeutics GmbH, Partner Therapeutics, and Pluri Inc.
1. Preface
1.1. Market Definition and Scope
1.2. Market Segmentation
1.3. Key Research Objectives
1.4. Research Highlights
2. Assumptions and Research Methodology
3. Executive Summary: Global Anti-radiation Drugs Market
4. Market Overview
4.1. Introduction
4.1.1. Definition
4.1.2. Industry Evolution/Developments
4.2. Overview
4.3. Market Dynamics
4.3.1. Drivers
4.3.2. Restraints
4.3.3. Opportunities
4.4. Global Anti-radiation Drugs Market Analysis and Forecast, 2017–2031
5. Key Insights
5.1. Pipeline Analysis
5.2. Key Industry Events (Partnership, Investment, Merger & Acquisition, etc.)
5.3. Insights on Radiation Pills
5.4. Regulatory Scenario, by Key Region/ Country
5.5. COVID-19 Impact Analysis
6. Global Anti-radiation Drugs Market Analysis and Forecast, by Compound
6.1. Introduction & Definition
6.2. Market Value Forecast, by Compound, 2017–2031
6.2.1. Potassium Iodide (KI)
6.2.2. Prussian Blue
6.2.3. DTPA (Diethylenetriamine Pentaacetate)
6.2.4. Others
6.3. Market Attractiveness, by Compound
7. Global Anti-radiation Drugs Market Analysis and Forecast, by Application
7.1. Introduction & Definition
7.2. Market Value Forecast, by Application, 2017–2031
7.2.1. Acute Radiation Syndrome (ARS)
7.2.2. Cancer Treatment
7.2.3. Radiation Exposure
7.2.4. Others
7.3. Market Attractiveness Analysis, by Application
8. Global Anti-radiation Drugs Market Analysis and Forecast, by Distribution Channel
8.1. Introduction & Definition
8.2. Market Value Forecast, by Distribution Channel, 2017–2031
8.2.1. Hospital Pharmacies
8.2.2. Retail Pharmacies
8.2.3. Others
8.3. Market Attractiveness Analysis, by Distribution Channel
9. Global Anti-radiation Drugs Market Analysis and Forecast, by Region
9.1. Key Findings
9.2. Market Value Forecast, by Region
9.2.1. North America
9.2.2. Europe
9.2.3. Asia Pacific
9.2.4. Latin America
9.2.5. Middle East & Africa
9.3. Market Attractiveness Analysis, by Region
10. North America Anti-radiation Drugs Market Analysis and Forecast
10.1. Introduction
10.1.1. Key Findings
10.2. Market Value Forecast, by Compound, 2017–2031
10.2.1. Potassium Iodide (KI)
10.2.2. Prussian Blue
10.2.3. DTPA (Diethylenetriamine Pentaacetate)
10.2.4. Others
10.3. Market Value Forecast, by Application, 2017–2031
10.3.1. Acute Radiation Syndrome (ARS)
10.3.2. Cancer Treatment
10.3.3. Radiation Exposure
10.3.4. Others
10.4. Market Value Forecast, by Distribution Channel, 2017–2031
10.4.1. Hospital Pharmacies
10.4.2. Retail Pharmacies
10.4.3. Others
10.5. Market Value Forecast, by Country, 2017–2031
10.5.1. U.S.
10.5.2. Canada
10.6. Market Attractiveness Analysis
10.6.1. By Compound
10.6.2. By Application
10.6.3. By Distribution Channel
10.6.4. By Country
11. Europe Anti-radiation Drugs Market Analysis and Forecast
11.1. Introduction
11.1.1. Key Findings
11.2. Market Value Forecast, by Compound, 2017–2031
11.2.1. Potassium Iodide (KI)
11.2.2. Prussian Blue
11.2.3. DTPA (Diethylenetriamine Pentaacetate)
11.2.4. Others
11.3. Market Value Forecast, by Application, 2017–2031
11.3.1. Acute Radiation Syndrome (ARS)
11.3.2. Cancer Treatment
11.3.3. Radiation Exposure
11.3.4. Others
11.4. Market Value Forecast, by Distribution Channel, 2017–2031
11.4.1. Hospital Pharmacies
11.4.2. Retail Pharmacies
11.4.3. Others
11.5. Market Value Forecast, by Country/Sub-region, 2017–2031
11.5.1. Germany
11.5.2. U.K.
11.5.3. France
11.5.4. Spain
11.5.5. Italy
11.5.6. Rest of Europe
11.6. Market Attractiveness Analysis
11.6.1. By Compound
11.6.2. By Application
11.6.3. By Distribution Channel
11.6.4. By Country/Sub-region
12. Asia Pacific Anti-radiation Drugs Market Analysis and Forecast
12.1. Introduction
12.1.1. Key Findings
12.2. Market Value Forecast, by Compound, 2017–2031
12.2.1. Potassium Iodide (KI)
12.2.2. Prussian Blue
12.2.3. DTPA (Diethylenetriamine Pentaacetate)
12.2.4. Others
12.3. Market Value Forecast, by Application, 2017–2031
12.3.1. Acute Radiation Syndrome (ARS)
12.3.2. Cancer Treatment
12.3.3. Radiation Exposure
12.3.4. Others
12.4. Market Value Forecast, by Distribution Channel, 2017–2031
12.4.1. Hospital Pharmacies
12.4.2. Retail Pharmacies
12.4.3. Others
12.5. Market Value Forecast, by Country/Sub-region, 2017–2031
12.5.1. China
12.5.2. Japan
12.5.3. India
12.5.4. Australia & New Zealand
12.5.5. Rest of Asia Pacific
12.6. Market Attractiveness Analysis
12.6.1. By Compound
12.6.2. By Application
12.6.3. By Distribution Channel
12.6.4. By Country/Sub-region
13. Latin America Anti-radiation Drugs Market Analysis and Forecast
13.1. Introduction
13.1.1. Key Findings
13.2. Market Value Forecast, by Compound, 2017–2031
13.2.1. Potassium Iodide (KI)
13.2.2. Prussian Blue
13.2.3. DTPA (Diethylenetriamine Pentaacetate)
13.2.4. Others
13.3. Market Value Forecast, by Application, 2017–2031
13.3.1. Acute Radiation Syndrome (ARS)
13.3.2. Cancer Treatment
13.3.3. Radiation Exposure
13.3.4. Others
13.4. Market Value Forecast, by Distribution Channel, 2017–2031
13.4.1. Hospital Pharmacies
13.4.2. Retail Pharmacies
13.4.3. Others
13.5. Market Value Forecast, by Country/Sub-region, 2017–2031
13.5.1. Brazil
13.5.2. Mexico
13.5.3. Rest of Latin America
13.6. Market Attractiveness Analysis
13.6.1. By Compound
13.6.2. By Application
13.6.3. By Distribution Channel
13.6.4. By Country/Sub-region
14. Middle East & Africa Anti-radiation Drugs Market Analysis and Forecast
14.1. Introduction
14.1.1. Key Findings
14.2. Market Value Forecast, by Compound, 2017–2031
14.2.1. Potassium Iodide (KI)
14.2.2. Prussian Blue
14.2.3. DTPA (Diethylenetriamine Pentaacetate)
14.2.4. Others
14.3. Market Value Forecast, by Application, 2017–2031
14.3.1. Acute Radiation Syndrome (ARS)
14.3.2. Cancer Treatment
14.3.3. Radiation Exposure
14.3.4. Others
14.4. Market Value Forecast, by Distribution Channel, 2017–2031
14.4.1. Hospital Pharmacies
14.4.2. Retail Pharmacies
14.4.3. Others
14.5. Market Value Forecast, by Country/Sub-region, 2017–2031
14.5.1. GCC Countries
14.5.2. South Africa
14.5.3. Rest of Middle East & Africa
14.6. Market Attractiveness Analysis
14.6.1. By Compound
14.6.2. By Application
14.6.3. By Distribution Channel
14.6.4. By Country/Sub-region
15. Competition Landscape
15.1. Market Player - Competitive Matrix (by tier and size of companies)
15.2. Market Share Analysis, by Company (2021)
15.3. Company Profiles
15.3.1. Amgen Inc.
15.3.1.1. Company Overview
15.3.1.2. Compound Portfolio
15.3.1.3. SWOT Analysis
15.3.1.4. Financial Overview
15.3.1.5. Strategic Overview
15.3.2. Anbex Inc.
15.3.2.1. Company Overview
15.3.2.2. Compound Portfolio
15.3.2.3. SWOT Analysis
15.3.2.4. Financial Overview
15.3.2.5. Strategic Overview
15.3.3. Arco Pharmaceuticals LLC
15.3.3.1. Company Overview
15.3.3.2. Compound Portfolio
15.3.3.3. SWOT Analysis
15.3.3.4. Financial Overview
15.3.4. BTG International Inc.
15.3.4.1. Company Overview
15.3.4.2. Compound Portfolio
15.3.4.3. SWOT Analysis
15.3.4.4. Financial Overview
15.3.4.5. Strategic Overview
15.3.5. Cellphire, Inc.
15.3.5.1. Company Overview
15.3.5.2. Compound Portfolio
15.3.5.3. SWOT Analysis
15.3.5.4. Financial Overview
15.3.5.5. Strategic Overview
15.3.6. Chrysalis BioTherapeutics, Inc.
15.3.6.1. Company Overview
15.3.6.2. Compound Portfolio
15.3.6.3. SWOT Analysis
15.3.7. Darnitsa
15.3.7.1. Company Overview
15.3.7.2. Compound Portfolio
15.3.7.3. SWOT Analysis
15.3.7.4. Strategic Overview
15.3.8. Enzychem Lifesciences Corporation
15.3.8.1. Company Overview
15.3.8.2. Compound Portfolio
15.3.8.3. SWOT Analysis
15.3.8.4. Strategic Overview
15.3.9. Humanetics Corporation
15.3.9.1. Company Overview
15.3.9.2. Compound Portfolio
15.3.9.3. SWOT Analysis
15.3.9.4. Financial Overview
15.3.9.5. Strategic Overview
15.3.10. Mission Pharmacal Company
15.3.10.1. Company Overview
15.3.10.2. Compound Portfolio
15.3.10.3. SWOT Analysis
15.3.10.4. Financial Overview
15.3.10.5. Strategic Overview
15.3.11. Myelo Therapeutics GmbH
15.3.11.1. Company Overview
15.3.11.2. Compound Portfolio
15.3.11.3. SWOT Analysis
15.3.11.4. Financial Overview
15.3.11.5. Strategic Overview
15.3.12. Partner Therapeutics
15.3.12.1. Company Overview
15.3.12.2. Compound Portfolio
15.3.12.3. SWOT Analysis
15.3.12.4. Financial Overview
15.3.12.5. Strategic Overview
15.3.13. Pluri Inc.
15.3.13.1. Company Overview
15.3.13.2. Compound Portfolio
15.3.13.3. SWOT Analysis
15.3.13.4. Financial Overview
15.3.13.5. Strategic Overview
15.3.14. Other Players
15.3.14.1. Company Overview
15.3.14.2. Compound Portfolio
15.3.14.3. SWOT Analysis
15.3.14.4. Financial Overview
15.3.14.5. Strategic Overview
List of Tables
Table 01: Global Anti-radiation Drugs Market Size (US$ Mn) Forecast, by Compound, 2017–2031
Table 02: Global Anti-radiation Drugs Market Size (US$ Mn) Forecast, by Application, 2017–2031
Table 03: Global Anti-radiation Drugs Market Size (US$ Mn) Forecast, by Distribution Channel, 2017–2031
Table 04: Global Anti-radiation Drugs Market Size (US$ Mn) Forecast, by Region, 2017–2031
Table 05: North America Anti-radiation Drugs Market Size (US$ Mn) Forecast, by Country, 2017–2031
Table 06: North America Anti-radiation Drugs Market Size (US$ Mn) Forecast, by Compound, 2017–2031
Table 07: North America Anti-radiation Drugs Market Size (US$ Mn) Forecast, by Application, 2017–2031
Table 08: North America Anti-radiation Drugs Market Size (US$ Mn) Forecast, by Distribution Channel, 2017–2031
Table 09: Europe Anti-radiation Drugs Market Size (US$ Mn) Forecast, by Country/Sub-region, 2017–2031
Table 10: Europe Anti-radiation Drugs Market Size (US$ Mn) Forecast, by Compound, 2017–2031
Table 11: Europe Anti-radiation Drugs Market Size (US$ Mn) Forecast, by Application, 2017–2031
Table 12: Europe Anti-radiation Drugs Market Size (US$ Mn) Forecast, by Distribution Channel, 2017–2031
Table 13: Asia Pacific Anti-radiation Drugs Market Size (US$ Mn) Forecast, by Country/Sub-region, 2017–2031
Table 14: Asia Pacific Anti-radiation Drugs Market Size (US$ Mn) Forecast, by Compound, 2017–2031
Table 15: Asia Pacific Anti-radiation Drugs Market Size (US$ Mn) Forecast, by Application, 2017–2031
Table 16: Asia Pacific Anti-radiation Drugs Market Size (US$ Mn) Forecast, by Distribution Channel, 2017–2031
Table 17: Latin America Anti-radiation Drugs Market Size (US$ Mn) Forecast, by Country/Sub-region, 2017–2031
Table 18: Latin America Anti-radiation Drugs Market Size (US$ Mn) Forecast, by Compound, 2017–2031
Table 19: Latin America Anti-radiation Drugs Market Size (US$ Mn) Forecast, by Application, 2017–2031
Table 20: Latin America Anti-radiation Drugs Market Size (US$ Mn) Forecast, by Distribution Channel, 2017–2031
Table 21: Middle East & Africa Anti-radiation Drugs Market Size (US$ Mn) Forecast, by Country/Sub-region, 2017–2031
Table 22: Middle East & Africa Anti-radiation Drugs Market Size (US$ Mn) Forecast, by Compound, 2017–2031
Table 23: Middle East & Africa Anti-radiation Drugs Market Size (US$ Mn) Forecast, by Application, 2017–2031
Table 24: Middle East & Africa Anti-radiation Drugs Market Size (US$ Mn) Forecast, by Distribution Channel, 2017–2031
List of Figures
Figure 01: Global Anti-radiation Drugs Market Size (US$ Mn) and Distribution (%), by Region, 2017 and 2031
Figure 02: Global Anti-radiation Drugs Market Revenue (US$ Mn), by Compound, 2021
Figure 03: Global Anti-radiation Drugs Market Value Share, by Compound, 2021
Figure 04: Global Anti-radiation Drugs Market Revenue (US$ Mn), by Application, 2021
Figure 05: Global Anti-radiation Drugs Market Value Share, by Application, 2021
Figure 06: Global Anti-radiation Drugs Market Revenue (US$ Mn), by Distribution Channel, 2021
Figure 07: Global Anti-radiation Drugs Market Value Share, by Distribution Channel, 2021
Figure 08: Global Anti-radiation Drugs Market Value Share, by Region, 2021
Figure 09: Global Anti-radiation Drugs Market Value (US$ Mn) Forecast, 2017–2031
Figure 10: Global Anti-radiation Drugs Market Value Share Analysis, by Compound, 2017 and 2031
Figure 11: Global Anti-radiation Drugs Market Revenue (US$ Mn) and Y-o-Y Growth (%), by Potassium Iodide (KI), 2017–2031
Figure 12: Global Anti-radiation Drugs Market Revenue (US$ Mn) and Y-o-Y Growth (%), by DTPA (Diethylenetriamine Pentaacetate), 2017–2031
Figure 13: Global Anti-radiation Drugs Market Revenue (US$ Mn) and Y-o-Y Growth (%), by Prussian Blue, 2017–2031
Figure 14: Global Anti-radiation Drugs Market Revenue (US$ Mn) and Y-o-Y Growth (%), by Others, 2017–2031
Figure 15: Global Anti-radiation Drugs Market Attractiveness Analysis, by Compound, 2022-2031
Figure 16: Global Anti-radiation Drugs Market Value Share Analysis, by Application, 2017 and 2031
Figure 17: Global Anti-radiation Drugs Market Revenue (US$ Mn) and Y-o-Y Growth (%), by Acute Radiation Syndrome (ARS), 2017–2031
Figure 18: Global Anti-radiation Drugs Market Revenue (US$ Mn) and Y-o-Y Growth (%), by Cancer Treatment, 2017–2031
Figure 19: Global Anti-radiation Drugs Market Revenue (US$ Mn) and Y-o-Y Growth (%), by Radiation Exposure, 2017–2031
Figure 20: Global Anti-radiation Drugs Market Revenue (US$ Mn) and Y-o-Y Growth (%), by Others, 2017–2031
Figure 21: Global Anti-radiation Drugs Market Attractiveness Analysis, by Application, 2022-2031
Figure 22: Global Anti-radiation Drugs Market Value Share Analysis, by Distribution Channel, 2017 and 2031
Figure 23: Global Anti-radiation Drugs Market Revenue (US$ Mn) and Y-o-Y Growth (%), by Hospital Pharmacies, 2017–2031
Figure 24: Global Anti-radiation Drugs Market Revenue (US$ Mn) and Y-o-Y Growth (%), by Retail Pharmacies, 2017–2031
Figure 25: Global Anti-radiation Drugs Market Revenue (US$ Mn) and Y-o-Y Growth (%), by Others, 2017–2031
Figure 26: Global Anti-radiation Drugs Market Attractiveness Analysis, by Distribution Channel, 2022-2031
Figure 27: Global Anti-radiation Drugs Market Value Share Analysis, by Region, 2017 and 2031
Figure 28: Global Anti-radiation Drugs Market Attractiveness Analysis, by Region, 2022-2031
Figure 29: North America Anti-radiation Drugs Market Value (US$ Mn) Forecast and Y-o-Y Growth (%), 2017–2031
Figure 30: North America Anti-radiation Drugs Market Attractiveness Analysis, by Country, 2017–2031
Figure 31: North America Anti-radiation Drugs Market Value Share Analysis, by Country, 2017 and 2031
Figure 32: North America Anti-radiation Drugs Market Value Share Analysis, by Compound, 2017 and 2031
Figure 33: North America Anti-radiation Drugs Market Value Share Analysis, by Application, 2017 and 2031
Figure 34: North America Anti-radiation Drugs Market Value Share Analysis, by Distribution Channel, 2017 and 2031
Figure 35: North America Anti-radiation Drugs Market Attractiveness Analysis, by Compound, 2022–2031
Figure 36: North America Anti-radiation Drugs Market Attractiveness Analysis, by Application, 2022–2031
Figure 37:North America Anti-radiation Drugs Market Attractiveness Analysis, by Distribution Channel, 2022–2031
Figure 38: Europe Anti-radiation Drugs Market Value (US$ Mn) Forecast and Y-o-Y Growth (%), 2017–2031
Figure 39: Europe Anti-radiation Drugs Market Attractiveness Analysis, by Country/Sub-region, 2017–2031
Figure 40: Europe Anti-radiation Drugs Market Value Share Analysis, by Country/Sub-region, 2017 and 2031
Figure 41: Europe Anti-radiation Drugs Market Value Share Analysis, by Compound, 2017 and 2031
Figure 42: Europe Anti-radiation Drugs Market Value Share Analysis, by Application, 2017 and 2031
Figure 43: Europe Anti-radiation Drugs Market Value Share Analysis, by Distribution Channel, 2017 and 2031
Figure 44: Europe Anti-radiation Drugs Market Attractiveness Analysis, by Compound, 2022–2031
Figure 45: Europe Anti-radiation Drugs Market Attractiveness Analysis, by Application, 2022–2031
Figure 46: Europe Anti-radiation Drugs Market Attractiveness Analysis, by Distribution Channel, 2022–2031
Figure 47: Asia Pacific Anti-radiation Drugs Market Value (US$ Mn) Forecast and Y-o-Y Growth (%), 2017–2031
Figure 48: Asia Pacific Anti-radiation Drugs Market Attractiveness Analysis, by Country/Sub-region, 2017–2031
Figure 49: Asia Pacific Anti-radiation Drugs Market Value Share Analysis, by Country/Sub-region, 2017 and 2031
Figure 50: Asia Pacific Anti-radiation Drugs Market Value Share Analysis, by Compound, 2017 and 2031
Figure 51: Asia Pacific Anti-radiation Drugs Market Value Share Analysis, by Application, 2017 and 2031
Figure 52: Asia Pacific Anti-radiation Drugs Market Value Share Analysis, by Distribution Channel, 2017 and 2031
Figure 53: Asia Pacific Anti-radiation Drugs Market Attractiveness Analysis, by Compound, 2022–2031
Figure 54: Asia Pacific Anti-radiation Drugs Market Attractiveness Analysis, by Application, 2022–2031
Figure 55: Asia Pacific Anti-radiation Drugs Market Attractiveness Analysis, by Distribution Channel, 2022–2031
Figure 56: Latin America Anti-radiation Drugs Market Value (US$ Mn) Forecast and Y-o-Y Growth (%), 2017–2031
Figure 57: Latin America Anti-radiation Drugs Market Attractiveness Analysis, by Country/Sub-region, 2017–2031
Figure 58: Latin America Anti-radiation Drugs Market Value Share Analysis, by Country/Sub-region, 2017 and 2031
Figure 59: Latin America Anti-radiation Drugs Market Value Share Analysis, by Compound, 2017 and 2031
Figure 60: Latin America Anti-radiation Drugs Market Value Share Analysis, by Application, 2017 and 2031
Figure 61: Latin America Anti-radiation Drugs Market Value Share Analysis, by Distribution Channel, 2017 and 2031
Figure 62: Latin America Anti-radiation Drugs Market Attractiveness Analysis, by Compound, 2022–2031
Figure 63: Latin America Anti-radiation Drugs Market Attractiveness Analysis, by Application, 2022–2031
Figure 64: Latin America Anti-radiation Drugs Market Attractiveness Analysis, by Distribution Channel, 2022–2031
Figure 65: Middle East & Africa Anti-radiation Drugs Market Size (US$ Mn) Forecast and Y-o-Y Growth (%), 2017–2031
Figure 66: Middle East & Africa Anti-radiation Drugs Market Attractiveness Analysis, by Country/Sub-region, 2017–2031
Figure 67: Middle East & Africa Anti-radiation Drugs Market Value Share Analysis, by Country/Sub-region, 2017 and 2031
Figure 68: Middle East & Africa Anti-radiation Drugs Market Value Share Analysis, by Compound, 2017 and 2031
Figure 69: Middle East & Africa Anti-radiation Drugs Market Value Share Analysis, by Application, 2017 and 2031
Figure 70: Middle East & Africa Anti-radiation Drugs Market Value Share Analysis, by Distribution Channel, 2017 and 2031
Figure 71: Middle East & Africa Anti-radiation Drugs Market Attractiveness Analysis, by Compound, 2022–2031
Figure 72: Middle East & Africa Anti-radiation Drugs Market Attractiveness Analysis, by Application, 2022–2031
Figure 73: Middle East & Africa Anti-radiation Drugs Market Attractiveness Analysis, by Distribution Channel, 2022–2031
Copyright © Transparency Market Research, Inc. All Rights reserved
Trust Online

Anti-radiation Drugs Market