
Reports
Reports
The American Academy of Ophthalmology (AAO) has recommended ophthalmologists to cease providing non-urgent care during the ongoing coronavirus pandemic. The institute has also provided a list of urgent and emergent procedures required to solve potential sight-threatening conditions. Such findings are affecting and influencing the growth of the amblyopia treatment market.
Though eye diseases seldom carry a fatal outcome, potential morbidity in patients has compelled companies in the amblyopia treatment market to maintain steady supply chains of eye patches, eyeglasses, and other treatment options. Stakeholders are gaining awareness about publications that are sharing recommendations on how to treat eye diseases such as amblyopia during the COVID-19 outbreak. However, there is a need for more specific recommendations pertaining to the amblyopia treatment.
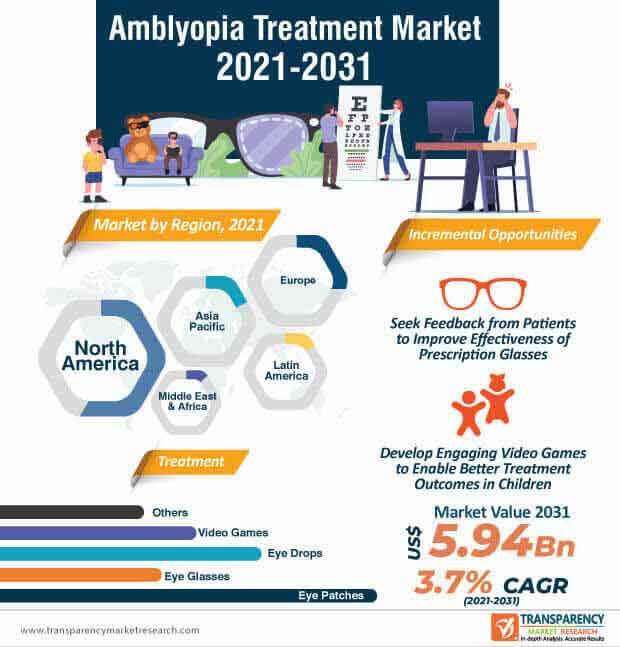
The amblyopia treatment market is expected to grow at a CAGR of 3.7% during the forecast period. Atropine sulfate eye drops are popular for the treatment of amblyopia and other eye conditions, including cycloplegia. However, it has been found that these eye drops may cause unwanted side effects such as blurred vision, difficulty seeing at night, and eye pain, among others. Hence, pharmaceutical companies are gaining a strong research base in eye drop formulations that lead to minimum side effects in patients.
Apart from eye drops, manufacturers in the amblyopia treatment market are increasing their production capabilities in eye patches. However, in many cases, adhesive eye patches are not well tolerated in children, leading to a rash. For this, atropine sulfate eye drops are emerging as an alternative treatment and is compelling manufacturers to improve eye drop formulations.
Use of Pure Cotton Amblyopia Eye Patches for Strabismic Amblyopia Treatment
Pure cotton amblyopia eye patches for glasses are storming the amblyopia treatment market. Such products are specially targeted for the treatment of strabismic amblyopia in children. These products are being made available through eCommerce platforms to create revenue streams. Manufacturers are designing pure cotton amblyopia eye patches that prevent any stimulation contacting with the soft skin and contain hygienic properties.
In order to meet the aesthetic requirements of children dealing with strabismic amblyopia, manufacturers are designing cute cartoons on pure cotton eye patches that can be washed repeatedly and help save costs.
Due to the immense differences between prescriptions of both the eyes, eye glasses are often unable to improve the vision of amblyopia patients. This is stressing on the need for R&D investments to improve eye glasses. On the other hand, parents are referring to publications that help understand the basics of amblyopia and its recommended glasses to improve the vision of their children.
Companies in the amblyopia treatment market are boosting their output capacities in prescription glasses meant for children suffering from myopia or hypermetropia. Ophthalmologists are recommending regular checkups to gauge the effectiveness of prescription glasses in order to improve eye vision. Such recommendations are leading to better outcomes, improved feedback, and innovations in design of prescription glasses.
Video games are emerging as an innovative treatment option for amblyopia. Stakeholders in the amblyopia treatment market are increasing awareness about proper application of video games at an early age in children to be able to get their brain to work with the weaker eye by improving the connections between the brain and the eye. Since wearing an eye patch may not help the eyes to learn to work together, companies in the amblyopia treatment market are increasing their focus in video games to instantly appeal to the interest of children and parents.
Since playing video games is fun and engaging, children are more likely to persist with the exercise and results in better outcomes.
Analysts’ Viewpoint
Limitations in providing non-urgent care to amblyopia patients is affecting the amblyopia treatment market growth amid COVID-19 outbreak. As such, stakeholders are focusing on eCommerce and development of company owned websites to increase sales of pure cotton eye patches and prescription glasses to make available treatment options for strabismic amblyopia patients. However, there is a need to improve formulations in eye drops due to the potential incidence of unwanted side effects such as increased sensitivity of the eyes to sunlight and blurred vision. Companies in the amblyopia treatment market should increase their R&D to improve eye drop formulations, since children with poor outcomes owing to eye patches are also dependent on atropine sulfate eye drops and ointments.
The global amblyopia treatment market was worth US$ 4 Bn and is projected to reach a value of US$ 5.94 Bn by the end of 2031
Amblyopia treatment market is anticipated to grow at a CAGR of 3.7% during the forecast period
North America accounted for a major share of the global amblyopia treatment market
The global amblyopia treatment market is driven by the rise in prevalence of amblyopia and launch of technologically advanced products
Key players in the global amblyopia treatment market include 3M, Vivid Vision, Inc., NovaSight, RevitalVision, Hilco Vision, Krafty Eye Patches, Fresnel Prism and Lens Co., OpthoPatch, Lancastle International Ltd., Amblyoptica (Holding) Pty Ltd., HOYA Vision Care Company, Good-Lite, and ORTOPADUSA
1. Preface
1.1. Report Scope and Market Segmentation
1.2. Research Highlights
2. Assumptions and Research Methodology
2.1. Assumptions and Acronyms Used
2.2. Research Methodology
3. Executive Summary
4. Market Overview
4.1. Introduction
4.2. Market Dynamics
4.2.1. Drivers
4.2.2. Restraints
4.2.3. Opportunity
4.3. Global Amblyopia Treatment Market Forecast
4.4. Global Amblyopia Treatment Market Outlook
5. Market Outlook
5.1. Key Industry Events (mergers, acquisitions, partnerships, collaborations, etc.)
5.2. Disease Prevalence globally with key countries
5.3. COVID-19 Pandemic Impact on Industry (value chain and short / mid / long term impact)
6. Global Amblyopia Treatment Market Analysis and Forecast, by Type
7. Introduction
7.1. Global Amblyopia Treatment Market Value Share Analysis, by Type
7.2. Global Amblyopia Treatment Market Forecast, by Type
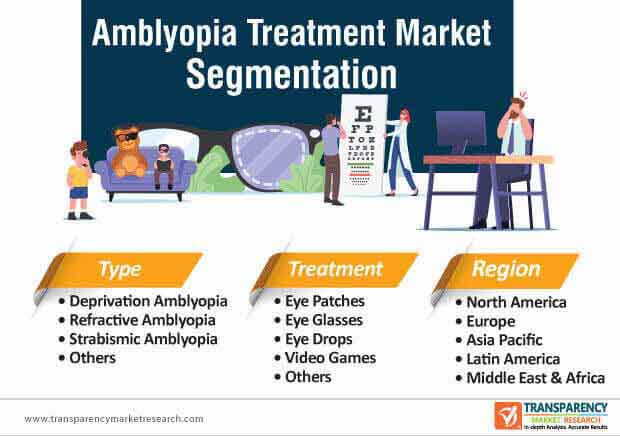
7.2.1. Deprivation Amblyopia
7.2.2. Refractive Amblyopia
7.2.3. Strabismic Amblyopia
7.2.4. Others
7.3. Global Amblyopia Treatment Market Analysis, by Type
7.4. Global Amblyopia Treatment Market Attractiveness Analysis, by Type
8. Global Amblyopia Treatment Market Analysis and Forecast, by Treatment
8.1. Introduction
8.2. Global Amblyopia Treatment Market Value Share Analysis, by Treatment
8.3. Global Amblyopia Treatment Market Forecast, by Treatment
8.3.1. Eye Patches
8.3.2. Eye Glasses
8.3.3. Eye Drops
8.3.4. Video Games
8.3.5. Others
8.4. Global Amblyopia Treatment Market Analysis, by Treatment
8.5. Global Amblyopia Treatment Market Attractiveness Analysis, by Treatment
9. Global Amblyopia Treatment Market Analysis, by Region
9.1. Global Amblyopia Treatment Market Analysis, by Region
9.2. Global Amblyopia Treatment Market Value Share and Attractiveness Analysis, by Region
9.3. Global Amblyopia Treatment Market Forecast, by Region
9.3.1. North America
9.3.2. Europe
9.3.3. Asia Pacific
9.3.4. Latin America
9.3.5. Middle East & Africa
10. North America Amblyopia Treatment Market Analysis
10.1. North America Amblyopia Treatment Market Overview
10.2. North America Amblyopia Treatment Market Value Share and Attractiveness Analysis, by Country
10.3. North America Amblyopia Treatment Market Forecast, by Country
10.3.1. U.S.
10.3.2. Canada
10.4. North America Amblyopia Treatment Market Value Share and Attractiveness Analysis, by Type
10.5. North America Amblyopia Treatment Market Forecast, by Type
10.5.1. Deprivation Amblyopia
10.5.2. Refractive Amblyopia
10.5.3. Strabismic Amblyopia
10.5.4. Others
10.6. North America Amblyopia Treatment Market Value Share and Attractiveness Analysis, by Treatment
10.7. North America Amblyopia Treatment Market Forecast, by Treatment
10.7.1. Eye Patches
10.7.2. Eye Glasses
10.7.3. Eye Drops
10.7.4. Video Games
10.7.5. Others
11. Europe Amblyopia Treatment Market Analysis
11.1. Europe Amblyopia Treatment Market Overview
11.2. Europe Amblyopia Treatment Market Value Share and Attractiveness Analysis, by Country/Sub-region
11.3. Europe Amblyopia Treatment Market Forecast, by Country/Sub-region
11.3.1. Germany
11.3.2. France
11.3.3. U.K.
11.3.4. Italy
11.3.5. Spain
11.3.6. Rest of Europe
11.4. Europe Amblyopia Treatment Market Value Share and Attractiveness Analysis, by Type
11.5. Europe Amblyopia Treatment Market Forecast, by Type
11.5.1. Deprivation Amblyopia
11.5.2. Refractive Amblyopia
11.5.3. Strabismic Amblyopia
11.5.4. Others
11.6. Europe Amblyopia Treatment Market Value Share and Attractiveness Analysis, by Treatment
11.7. Europe Amblyopia Treatment Market Forecast, by Treatment
11.7.1. Eye Patches
11.7.2. Eye Glasses
11.7.3. Eye Drops
11.7.4. Video Games
11.7.5. Others
12. Asia Pacific Amblyopia Treatment Market Analysis
12.1. Asia Pacific Amblyopia Treatment Market Overview
12.2. Asia Pacific Amblyopia Treatment Market Value Share and Attractiveness Analysis, by Countries/Sub-region
12.3. Asia Pacific Amblyopia Treatment Market Forecast, by Countries/Sub-region
12.3.1. Japan
12.3.2. China
12.3.3. India
12.3.4. Australia & New Zealand
12.3.5. Rest of Asia Pacific
12.4. Asia Pacific Amblyopia Treatment Market Value Share and Attractiveness Analysis, by Type
12.5. Asia Pacific Amblyopia Treatment Market Forecast, by Type
12.5.1. Deprivation Amblyopia
12.5.2. Refractive Amblyopia
12.5.3. Strabismic Amblyopia
12.5.4. Others
12.6. Asia Pacific Amblyopia Treatment Market Value Share and Attractiveness Analysis, by Treatment
12.7. Asia Pacific Amblyopia Treatment Market Forecast, by Treatment
12.7.1. Eye Patches
12.7.2. Eye Glasses
12.7.3. Eye Drops
12.7.4. Video Games
12.7.5. Others
13. Latin America Amblyopia Treatment Market Analysis
13.1. Latin America Amblyopia Treatment Market Overview
13.2. Latin America Amblyopia Treatment Market Value Share and Attractiveness Analysis, by Countries/Sub-region
13.3. Latin America Amblyopia Treatment Market Forecast, by Countries/Sub-region
13.3.1. Brazil
13.3.2. Mexico
13.3.3. Rest of Latin America
13.4. Latin America Amblyopia Treatment Market Value Share and Attractiveness Analysis, by Type
13.5. Latin America Amblyopia Treatment Market Forecast, by Type
13.5.1. Deprivation Amblyopia
13.5.2. Refractive Amblyopia
13.5.3. Strabismic Amblyopia
13.5.4. Others
13.6. Latin America Amblyopia Treatment Market Value Share and Attractiveness Analysis, by Treatment
13.7. Latin America Amblyopia Treatment Market Forecast, by Treatment
13.7.1. Eye Patches
13.7.2. Eye Glasses
13.7.3. Eye Drops
13.7.4. Video Games
13.7.5. Others
14. Middle East & Africa Amblyopia Treatment Market Analysis
14.1. Middle East & Africa Amblyopia Treatment Market Overview
14.2. Middle East & Africa Amblyopia Treatment Market Value Share and Attractiveness Analysis, by Countries/Sub-region
14.3. Middle East & Africa Amblyopia Treatment Market Forecast, by Countries/Sub-region
14.3.1. GCC Countries
14.3.2. South Africa
14.3.3. Rest of Middle East & Africa
14.4. Middle East & Africa Amblyopia Treatment Market Value Share and Attractiveness Analysis, by Type
14.5. Middle East & Africa Amblyopia Treatment Market Forecast, by Type
14.5.1. Deprivation Amblyopia
14.5.2. Refractive Amblyopia
14.5.3. Strabismic Amblyopia
14.5.4. Others
14.6. Middle East & Africa Amblyopia Treatment Market Value Share and Attractiveness Analysis, by Treatment
14.7. Middle East & Africa Amblyopia Treatment Market Forecast, by Treatment
14.7.1. Eye Patches
14.7.2. Eye Glasses
14.7.3. Eye Drops
14.7.4. Video Games
14.7.5. Others
15. Competition Landscape
15.1. Company Profiles
15.1.1. 3M
15.1.1.1. Company Overview (HQ, Business Segments, Employee Strength)
15.1.1.2. Product Portfolio
15.1.1.3. Financial Overview
15.1.1.4. SWOT Analysis
15.1.1.5. Strategic Overview
15.1.2. Vivid Vision, Inc.
15.1.2.1. Company Overview (HQ, Business Segments, Employee Strength)
15.1.2.2. Product Portfolio
15.1.2.3. SWOT Analysis
15.1.2.4. Strategic Overview
15.1.3. NovaSight
15.1.3.1. Company Overview (HQ, Business Segments, Employee Strength)
15.1.3.2. Product Portfolio
15.1.3.3. SWOT Analysis
15.1.3.4. Strategic Overview
15.1.4. RevitalVision
15.1.4.1. Company Overview (HQ, Business Segments, Employee Strength)
15.1.4.2. Product Portfolio
15.1.4.3. SWOT Analysis
15.1.4.4. Strategic Overview
15.1.5. Hilco Vision
15.1.5.1. Company Overview (HQ, Business Segments, Employee Strength)
15.1.5.2. Product Portfolio
15.1.5.3. SWOT Analysis
15.1.5.4. Strategic Overview
15.1.6. Krafty Eye Patches
15.1.6.1. Company Overview (HQ, Business Segments, Employee Strength)
15.1.6.2. Product Portfolio
15.1.6.3. SWOT Analysis
15.1.6.4. Strategic Overview
15.1.7. Fresnel Prism and Lens Co.
15.1.7.1. Company Overview (HQ, Business Segments, Employee Strength)
15.1.7.2. Product Portfolio
15.1.7.3. SWOT Analysis
15.1.7.4. Strategic Overview
15.1.8. OpthoPatch
15.1.8.1. Company Overview (HQ, Business Segments, Employee Strength)
15.1.8.2. Product Portfolio
15.1.8.3. SWOT Analysis
15.1.8.4. Strategic Overview
15.1.9. Lancastle International Ltd.
15.1.9.1. Company Overview (HQ, Business Segments, Employee Strength)
15.1.9.2. Product Portfolio
15.1.9.3. SWOT Analysis
15.1.9.4. Strategic Overview
15.1.10. Amblyoptica (Holding) Pty Ltd.
15.1.10.1. Company Overview (HQ, Business Segments, Employee Strength)
15.1.10.2. Product Portfolio
15.1.10.3. SWOT Analysis
15.1.10.4. Strategic Overview
15.1.11. HOYA Vision Care Company
15.1.11.1. Company Overview (HQ, Business Segments, Employee Strength)
15.1.11.2. Product Portfolio
15.1.11.3. Financial Overview
15.1.11.4. SWOT Analysis
15.1.11.5. Strategic Overview
15.1.12. Good-Lite
15.1.12.1. Company Overview (HQ, Business Segments, Employee Strength)
15.1.12.2. Product Portfolio
15.1.12.3. SWOT Analysis
15.1.12.4. Strategic Overview
15.1.13. OrtopadUSA
15.1.13.1. Company Overview (HQ, Business Segments, Employee Strength)
15.1.13.2. Product Portfolio
15.1.13.3. SWOT Analysis
15.1.13.4. Strategic Overview
List of Tables
Table 01: Global Amblyopia Treatment Market Value (US$ Mn) Forecast, by Type, 2017–2031
Table 02: Global Amblyopia Treatment Market Value (US$ Mn) Forecast, by Treatment, 2017–2031
Table 03: Global Amblyopia Treatment Market Value (US$ Mn) Forecast, by Region, 2017–2031
Table 04: North America Amblyopia Treatment Market Value (US$ Mn) Forecast, by Country, 2017–2031
Table 05: North America Amblyopia Treatment Market Value (US$ Mn) Forecast, by Type, 2017–2031
Table 06: North America Amblyopia Treatment Market Value (US$ Mn) Forecast, by Treatment, 2017–2031
Table 07: Europe Amblyopia Treatment Market Value (US$ Mn) Forecast, by Country/Sub-region, 2017–2031
Table 08: Europe Amblyopia Treatment Market Value (US$ Mn) Forecast, by Type, 2017–2031
Table 09: Europe Amblyopia Treatment Market Value (US$ Mn) Forecast, by Treatment, 2017–2031
Table 10: Asia Pacific Amblyopia Treatment Market Value (US$ Mn) Forecast, by Country/Sub-region, 2017–2031
Table 11: Asia Pacific Amblyopia Treatment Market Value (US$ Mn) Forecast, by Type, 2017–2031
Table 12: Asia Pacific Amblyopia Treatment Market Value (US$ Mn) Forecast, by Treatment, 2017–2031
Table 13: Latin America Amblyopia Treatment Market Value (US$ Mn) Forecast, by Country/Sub-region, 2017–2031
Table 14: Latin America Amblyopia Treatment Market Value (US$ Mn) Forecast, by Type, 2017–2031
Table 15: Latin America Amblyopia Treatment Market Value (US$ Mn) Forecast, by Treatment, 2017–2031
Table 16: Middle East & Africa Amblyopia Treatment Market Value (US$ Mn) Forecast, by Country/Sub-region, 2017–2031
Table 17: Middle East & Africa Amblyopia Treatment Market Value (US$ Mn) Forecast, by Type, 2017–2031
Table 18: Middle East & Africa Amblyopia Treatment Market Value (US$ Mn) Forecast, by Treatment, 2017–2031
Table 19: 3M, Company Details
Table 20: 3M, Business Overview
Table 21: Vivid Vision, Inc., Company Details
Table 22: Vivid Vision, Inc., Business Overview
Table 23: NovaSight, Company Details
Table 24: NovaSight, Business Overview
Table 25: RevitalVision, Company Details
Table 26: RevitalVision, Business Overview
Table 27: Hilco Vision, Company Details
Table 28: Hilco Vision, Business Overview
Table 29: Krafty Eye Patches, Company Details
Table 30: Krafty Eye Patches, Business Overview
Table 31: Fresnel Prism and Lens Co., Company Details
Table 32: Fresnel Prism and Lens Co., Business Overview
Table 33: OpthoPatch, Company Details
Table 34: OpthoPatch, Business Overview
Table 35: Lancastle International Ltd., Company Details
Table 36: Lancastle International Ltd., Business Overview
Table 37: Amblyoptica (Holding) Pty Ltd., Company Details
Table 38: Amblyoptica (Holding) Pty Ltd., Business Overview
Table 39: HOYA Vision Care Company, Company Details
Table 40: HOYA Vision Care Company, Business Overview
Table 41: Good-Lite, Company Details
Table 42: Good-Lite, Business Overview
Table 43: ORTOPADUSA, Company Details
Table 44: ORTOPADUSA, Business Overview
List of Figures
Figure 01: Market Share, by Type
Figure 02: Market Share, by Treatment
Figure 03: Market Share, by Region
Figure 04: Global Amblyopia Treatment Market Value (US$ Mn) Forecast, 2017–2031
Figure 05: Global Amblyopia Treatment Market Value Share, by Type, 2020
Figure 06: Global Amblyopia Treatment Market Value Share, by Treatment, 2020
Figure 07: Global Amblyopia Treatment Market Value Share, by Region, 2020
Figure 08: Global Amblyopia Treatment Market Value Share Analysis, by Type, 2020 and 2031
Figure 09: Global Amblyopia Treatment Market Revenue (US$ Mn), by Deprivation Amblyopia, 2017–2031
Figure 10: Global Amblyopia Treatment Market Revenue (US$ Mn), by Refractive Amblyopia, 2017–2031
Figure 11: Global Amblyopia Treatment Market Revenue (US$ Mn), by Strabismic Amblyopia, 2017–2031
Figure 12: Global Amblyopia Treatment Market Revenue (US$ Mn), by Others, 2017–2031
Figure 13: Global Amblyopia Treatment Market Attractiveness Analysis, by Type, 2021–2031
Figure 14: Global Amblyopia Treatment Market Value Share Analysis, by Treatment, 2020 and 2031
Figure 15: Global Amblyopia Treatment Market Revenue (US$ Mn), by Eye Patches, 2017–2031
Figure 16: Global Amblyopia Treatment Market Revenue (US$ Mn), by Eye Glasses, 2017–2031
Figure 17: Global Amblyopia Treatment Market Revenue (US$ Mn), by Eye Drops, 2017–2031
Figure 18: Global Amblyopia Treatment Market Revenue (US$ Mn), by Video Games, 2017–2031
Figure 19: Global Amblyopia Treatment Market Revenue (US$ Mn), by Others, 2017–2031
Figure 20: Global Amblyopia Treatment Market Attractiveness Analysis, by Treatment, 2021–2031
Figure 21: Global Amblyopia Treatment Market Value Share Analysis, by Region, 2020 and 2031
Figure 22: Global Amblyopia Treatment Market Analysis, by Region, 2021-2031
Figure 23: North America Amblyopia Treatment Market Value (US$ Mn) Forecast and Y-o-Y Growth (%) Projection, 2017–2031
Figure 24: North America Amblyopia Treatment Market Value Share (%), by Country, 2020 and 2031
Figure 25: North America Amblyopia Treatment Market Attractiveness Analysis, by Country, 2021–2031
Figure 26: North America Amblyopia Treatment Market Value Share Analysis, by Type, 2020 and 2031
Figure 27: North America Amblyopia Treatment Market Attractiveness Analysis, by Type, 2021–2031
Figure 28: North America Amblyopia Treatment Market Value Share Analysis, by Treatment, 2020 and 2031
Figure 29: North America Amblyopia Treatment Market Attractiveness Analysis, by Treatment, 2021–2031
Figure 30: Europe Amblyopia Treatment Market Value (US$ Mn) Forecast and Y-o-Y Growth (%) Projection, 2017–2031
Figure 31: Europe Amblyopia Treatment Market Value Share (%), by Country/Sub-region, 2020 and 2031
Figure 32: Europe Amblyopia Treatment Market Attractiveness Analysis, by Country/Sub-region, 2021–2031
Figure 33: Europe Amblyopia Treatment Market Value Share Analysis, by Type, 2020 and 2031
Figure 34: Europe Amblyopia Treatment Market Attractiveness Analysis, by Type, 2021–2031
Figure 35: Europe Amblyopia Treatment Market Value Share Analysis, by Treatment, 2020 and 2031
Figure 36: Europe Amblyopia Treatment Market Attractiveness Analysis, by Treatment, 2021–2031
Figure 37: Asia Pacific Amblyopia Treatment Market Value (US$ Mn) Forecast and Y-o-Y Growth (%) Projection, 2017–2031
Figure 38: Asia Pacific Amblyopia Treatment Market Value Share (%), by Country/Sub-region, 2020 and 2031
Figure 39: Asia Pacific Amblyopia Treatment Market Attractiveness Analysis, by Country/Sub-region, 2021–2031
Figure 40: Asia Pacific Amblyopia Treatment Market Value Share Analysis, by Type, 2020 and 2031
Figure 41: Asia Pacific Amblyopia Treatment Market Attractiveness Analysis, by Type, 2021–2031
Figure 42: Asia Pacific Amblyopia Treatment Market Value Share Analysis, by Treatment, 2020 and 203142
Figure 43: Asia Pacific Amblyopia Treatment Market Attractiveness Analysis, by Treatment, 2021–2031
Figure 44: Latin America Amblyopia Treatment Market Value (US$ Mn) Forecast and Y-o-Y Growth (%) Projection, 2017–2031
Figure 45: Latin America Amblyopia Treatment Market Value Share (%), by Country/Sub-region, 2020 and 2031
Figure 46: Latin America Amblyopia Treatment Market Attractiveness Analysis, by Country/Sub-region, 2021–2031
Figure 47: Latin America Amblyopia Treatment Market Value Share Analysis, by Type, 2020 and 2031
Figure 48: Latin America Amblyopia Treatment Market Attractiveness Analysis, by Type, 2021–2031
Figure 49: Latin America Amblyopia Treatment Market Value Share Analysis, by Treatment, 2020 and 2031
Figure 50: Latin America Amblyopia Treatment Market Attractiveness Analysis, by Treatment, 2021–2031
Figure 51: Middle East & Africa Amblyopia Treatment Market Value (US$ Mn) Forecast and Y-o-Y Growth (%) Projection, 2017–2031
Figure 52: Middle East & Africa Amblyopia Treatment Market Value Share (%), by Country/Sub-region, 2020 and 2031
Figure 53: Middle East & Africa Amblyopia Treatment Market Attractiveness Analysis, by Country/Sub-region, 2021–2031
Figure 54: Middle East & Africa Amblyopia Treatment Market Value Share Analysis, by Type, 2020 and 2031
Figure 55: Middle East & Africa Amblyopia Treatment Market Attractiveness Analysis, by Type, 2021–2031
Figure 56: Middle East & Africa Amblyopia Treatment Market Value Share Analysis, by Treatment, 2020 and 2031
Figure 57: Middle East & Africa Amblyopia Treatment Market Attractiveness Analysis, by Treatment, 2021–2031
Figure 58: 3M, Revenue (US$ Mn) and Y-o-Y Growth (%), 2017–2020
Figure 59: 3M, Breakdown of Net Sales (%), by Region/Country, 2020
Figure 60: 3M, Healthcare - Revenue Breakdown of Net Sales (%), by Segment, 2020
Figure 61: 3M, R&D Expenses (US$ Mn) and Y-o-Y Growth (%), 2017–2020
Figure 62: HOYA Vision Care Company, Revenue (US$ Mn) and Y-o-Y Growth (%), 2018–2020
Figure 63: HOYA Vision Care Company, Breakdown of Net Sales (%), by Region/Country, 2020
Figure 64: HOYA Vision Care Company, Breakdown of Net Sales (%), by Business Segment, 2020
Copyright © Transparency Market Research, Inc. All Rights reserved
Trust Online

Amblyopia Treatment Market