
Reports
Reports
Over the past decade, consumer preferences have evolved at a rapid pace. A tectonic shift toward healthy, organic, natural, and clean-label food products can be observed– a trend that is expected to continue in the upcoming years. The notable shift toward healthier food alternatives, growing consumer demand for transparency from food manufacturers, and the advent of social media are some of the leading factors that have played an important role in augmenting the demand for niche food products such as agave nectar. The demand for agave syrup and agave nectar has witnessed a considerable surge over the past few years.
Agave nectar has gained a great amount of popularity as a natural sweetener and is increasingly being used as a substitute for sugar in several regions. Growing prevalence of diabetes worldwide, the surge in demand for agave nectar from the food & beverages industry, product diversification, and soaring consumer appetite for organic and natural ingredients are some of the leading factors that are expected to boost the growth of the agave nectar market during the forecast period. At the back of these factors, along with a growing focus on launching new products, the global agave nectar market is projected to attain a market value of ~US$ 272 Mn by the end of 2030.
The demand for agave nectar is predominantly influenced by the rising consumer awareness pertaining to the benefits of agave nectar and syrup. In addition, as more number of consumers turn their back on processed sugars and high-fructose syrups, organic and natural alternatives, including agave nectar have received a great degree of attention. Companies operating in the current agave nectar market are marketing agave nectar as a product with low glycemic index and slow-release carbohydrate due to which, the demand for the same is on the rise, particularly in developed regions of North America and Europe.
At present, the demand for agave nectar particularly from the food & beverages sector is moving in the upward trajectory– a trend that is likely to continue during the forecast period, thereby boosting the growth of the agave nectar market. Although research activities continue to reveal the adverse effects of agave nectar on human health, companies operating in the current market landscape are increasingly investing resources to produce new products that are expected to appeal the health-conscious consumers.
Players operating in the current agave nectar market are expected to focus on product development, product diversification, pricing strategies, and promotional and marketing strategies to gain a competitive edge. While several companies continue to target the health-conscious consumers via impactful marketing strategies, brands are also expected to launch new products to strengthen their foothold in the agave nectar market during the forecast period. For instance, in 2017, Silver Spoon launched a new line of flavored agave nectar. Apart from launching a new product range, the company also focused on enhancing the packaging and designs of their products to attract more consumers. In addition, while sales via conventional sales channels, including supermarkets, hypermarkets, and retail stores are increasing at a consistent pace, brands are also expected to boost sales via listing their products on e-Commerce platforms. Companies are also expected to focus on branding and packaging strategies to gain a competitive edge.
The advent of the novel COVID-19 pandemic has made a strong impact on the fast-moving consumer goods sector. Consumer behavior trends continue to witness major changes, as the demand for essential goods and services continues to witness exponential growth. While emergency health supplies, groceries, fruits, and vegetables continue to remain high in demand, sales of luxury or premium products, including agave nectar is expected to take a hit. Players operating in the current market landscape are anticipated to face challenges within the supply chain due to trade restrictions imposed by government authorities worldwide.
Analysts’ Viewpoint
The global agave nectar market is expected to grow at a healthy CAGR of ~5.7% during the forecast period. The market growth can be primarily attributed to a host of factors of which, high prevalence of cardiovascular and diabetes is expected to remain the most prominent factor. Companies operating in the current market landscape are likely to address the supply chain challenges put forth by the COVID-19 pandemic and seek new innovative solutions to improve sales. Although the sales of premium food products are anticipated to take a hit particularly in 2020, sales of agave nectar products are likely to surge in the second half of 2021.
Agave Nectar Market: Overview
Agave Nectar: Market Frontrunners
Agave Nectar Market: Trends
Impact of COVID-19 on Agave Nectar
Agave Nectar Market: Strategies
Agave Nectar Market: Players
Agave Nectar Market is projected to reach US$ 272 Mn by the end of 2030
Agave Nectar Market is expected to grow at a CAGR of 5.7% during 2020-2030
Increasing demand of organic, natural, and clean-label food products is expect to drive Agave Nectar Market
North America is a more attractive region for vendors in the Agave Nectar Market
Key vendors in the Agave Nectar Market are The IIDEA Company, The Tierra Group, Ciranda, Domino Foods, Inc., SunOpta, Inc., etc
1. Executive Summary
1.1. Global Market Outlook
1.2. Demand-side Trends
1.3. Supply-side Trends
1.4. Technology Roadmap Analysis
1.5. Analysis and Recommendations
2. Market Overview
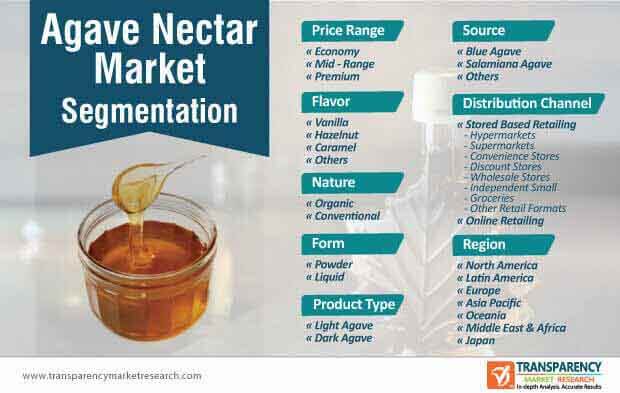
2.1. Market Coverage / Taxonomy
2.2. Market Definition / Scope
3. Key Market Trends
3.1. Key Trends Impacting the Market
3.2. Product Innovation / Development Trends
4. Key Success Factors
4.1. Product Positioning Metrics
4.2. Product Processing Overview
4.3. Product Utilization in High Growth End-use Applications
4.4. Quality Certifications and Claims Impact Analysis
5. Consumer Behaviour Analysis
5.1. Value Spend of Target Product
5.2. Path to Purchase: Paved with Digitization
5.3. Influence of Packaging on Purchasing
5.4. Brand Loyalty: Head Vs Heart
5.5. Quest for Quality
5.6. Frugality: Product Habit or Passing Fad
5.7. Factors Influencing Market Behavior by the Costumers of all Age Group
5.8. Most Effective Advertising Format Today
5.9. Social Media Influencing Customer’s Decision Making
5.10. Preferred Social media Platforms for Branding
5.11. Key Challenges Associated with the Market Suppliers
5.12. Concerned Consumers towards Private Label Brands
5.13. Demand Assessment- Target Market
5.13.1. % of Demand by Packaging Type (2019 & 2029)
5.13.1.1. Pouches
5.13.1.2. Cups & Tubs
5.13.1.3. Cans
5.13.1.4. Carton Packaging
5.13.1.5. Bottles
5.13.1.6. Others
5.13.2. % of Demand by Special Diet Needs (2019 & 2029)
5.13.2.1. Gluten-Free
5.13.2.2. Organic
5.13.2.3. Vegan
5.13.2.4. High Protein
5.13.2.5. Dairy-Free
5.13.2.6. Soy-Free
5.13.2.7. Low Glycemic
5.13.2.8. Wheat-Free
5.13.2.9. Cholesterol-Free
5.13.2.10. Fat-Free
5.13.2.11. GMO-Free
5.13.2.12. High Fiber
5.13.2.13. Kosher
5.13.2.14. Lactose-Free Formula
5.13.2.15. Low Fat
5.13.2.16. Low Sodium
6. Global Agave Nectar Market Demand Analysis 2014-2018 and Forecast,2019-2029
6.1. Historical Market Volume (Metric Tons) Analysis, 2014-2018
6.2. Current and Future Market Volume (Metric Tons) Projections, 2019-2029
6.3. Y-o-Y Growth Trend Analysis
7. Global Agave Nectar Market - Pricing Analysis
7.1. Regional Pricing Analysis (US$/Metric Tons) By Product
7.2. Pricing Break-up
7.2.1. Producer Level Pricing
7.2.2. Distributor Level Pricing
7.2.3. Retail Pricing
7.3. GLOBAL Average Pricing Analysis Benchmark
8. Global Agave Nectar Market Demand (Size in US$ Mn) Analysis 2014-2018 and Forecast, 2019-2029
8.1. Historical Market Value (US$ Mn) Analysis, 2014-2018
8.2. Current and Future Market Value (US$ Mn) Projections, 2019-2029
8.2.1. Y-o-Y Growth Trend Analysis
8.2.2. Absolute $ Opportunity Analysis
9. Market Background
9.1. Agave Production Overview
9.1.1. Total Harvested Area (hectares), by Region/Country
9.1.2. Organic Agave Acreage
9.1.3. Overview of Agave Plantation and Harvest Seasons
9.2. Nutritional Composition of Agave Nectar
9.3. Processing Methods Overview
9.3.1. Nectar Extraction Techniques
9.3.2. Refining Methods
9.4. Policy Developments and Regulatory Scenario
9.5. GLOBAL Supply/Demand and Trade Scenario
9.6. Macro-Economic Factors
9.6.1. Global GDP Growth Outlook
9.6.2. Global Industry Value Added
9.6.3. Personal Consumption Expenditures
9.6.4. Modern Trade Penetration
9.6.5. Consumer Price Indices
9.7. Forecast Factors - Relevance & Impact
9.7.1. Area Under Cultivation Outlook
9.7.2. Seasonality and Yield Analysis
9.7.3. Production/Processing Capacity Growth
9.7.4. Trade Tariffs and Regulation Outlook
9.7.5. Global Food & Beverage Industry Outlook
9.7.6. Global Urbanization Growth Outlook
9.8. Value Chain Analysis
9.8.1. Growers / Cultivators
9.8.2. Raw Material Suppliers
9.8.3. Product Manufacturers
9.8.4. Distributors/Suppliers/Wholesalers
9.8.5. Traders
9.8.6. End Users/Retailers
9.9. Market Dynamics
9.9.1. Drivers
9.9.2. Restraints
9.9.3. Opportunity
10. Global Agave Nectar Market Analysis 2014-2018 and Forecast 2019-2029,By Product Type
10.1. Introduction / Key Findings
10.2. Historical Market Size (US$ Mn) and Volume Analysis By Product Type,2013 - 2017
10.3. Current and Future Market Size (US$ Mn) and Volume Analysis and Forecast By Product Type, 2018 – 2018
10.3.1. Light Agave
10.3.2. Dark Agave
10.4. Market Attractiveness Analysis By Product Type
11. Global Agave Nectar Market Analysis 2014-2018 and Forecast 2019-2029,By Form
11.1. Introduction / Key Findings
11.2. Historical Market Size (US$ Mn) and Volume Analysis By Form, 2013 -2017
11.3. Current and Future Market Size (US$ Mn) and Volume Analysis and Forecast By Form, 2018 – 2018
11.3.1. Liquid
11.3.2. Powder
11.4. Market Attractiveness Analysis By Form
12. Global Agave Nectar Market Analysis 2014-2018 and Forecast 2019-2029,By Nature
12.1. Introduction / Key Findings
12.2. Historical Market Size (US$ Mn) and Volume Analysis By Nature, 2013 -2017
12.3. Current and Future Market Size (US$ Mn) and Volume Analysis andForecast By Nature, 2018 – 2018
12.3.1. Organic
12.3.2. Conventional
12.4. Market Attractiveness Analysis By Nature
13. Global Agave Nectar Market Analysis 2014-2018 and Forecast 2019-2029,By Price Range
13.1. Introduction / Key Findings
13.2. Historical Market Size (US$ Mn) and Volume Analysis By Price Range,2013 - 2017
13.3. Current and Future Market Size (US$ Mn) and Volume Analysis and Forecast By Price Range, 2018 – 2018
13.3.1. Economy (Less Than US$ 20)
13.3.2. Mid-Range (US$20-50)
13.3.3. Premium (More Than US$ 50)
13.4. Market Attractiveness Analysis By Price Range
14. Global Agave Nectar Market Analysis 2014-2018 and Forecast 2019-2029,By Source
14.1. Introduction / Key Findings
14.2. Historical Market Size (US$ Mn) and Volume Analysis By Source, 2013 -2017
14.3. Current and Future Market Size (US$ Mn) and Volume Analysis and Forecast By Source, 2018 – 2018
14.3.1. Blue Agave
14.3.2. Salmiana Agave
14.3.3. Others (e.g. Agave Americana, etc.)
14.4. Market Attractiveness Analysis By Source
15. Global Agave Nectar Market Analysis 2014-2018 and Forecast 2019-2029,By Flavour
15.1. Introduction / Key Findings
15.2. Historical Market Size (US$ Mn) and Volume Analysis By Flavour, 2013 -2017
15.3. Current and Future Market Size (US$ Mn) and Volume Analysis and Forecast By Flavour, 2018 – 2018
15.3.1. Vanilla
15.3.2. Hazelnut
15.3.3. Caramel
15.3.4. Others (e.g. Maple, Coconut lemon, etc.)
15.4. Market Attractiveness Analysis By Flavour
16. Global Agave Nectar Market Analysis 2014-2018 and Forecast 2019-2029,By Distribution Channel
16.1. Introduction / Key Findings
16.2. Historical Market Size (US$ Mn) and Volume Analysis By Distribution Channel, 2013-2017
16.3. Current and Future Market Size (US$ Mn) and Volume Analysis and Forecast By Distribution Channel, 2018 – 2018
16.3.1. Store Based Retailing
16.3.1.1. Hypermarkets/ Supermarkets
16.3.1.2. Convenience Stores
16.3.1.3. Mass Grocery Retailers
16.3.1.4. Discount Stores
16.3.1.5. Wholesale Stores
16.3.1.6. Food and Drink Specialty Stores
16.3.1.7. Other Retail Formats
16.3.2. Online Retailing
16.4. Market Attractiveness Analysis By Distribution Channel
17. Market Structure Analysis
17.1. Global Agave Nectar Market Competition - a Dashboard View
17.2. Global Agave Nectar Market Company Share Analysis
17.2.1. Company Market Share Analysis of Top 10 Players, By Region
17.2.2. Company Market Share Analysis of Top 10 Players, By Form
17.3. Key Participants Market Presence (Intensity Mapping) by Region
18. North America Agave Nectar Market Analysis and Forecast
18.1. Introduction
18.1.1. Basis Point Share (BPS) Analysis By Country
18.1.2. Y-o-Y Growth Projections By Country
18.2. Agave Nectar Market Size (Value (US$) and Volume (MT) Analysis (2015-2019) and Forecast (2019-2029
18.2.1. Market Attractiveness By Country
18.2.1.1. U.S.
18.2.1.2. Canada
18.2.2. By Product Type
18.2.3. By Form
18.2.4. By Nature
18.2.5. By Flavour
18.2.6. By Price-Range
18.2.7. By Source
18.2.8. By Distributional Channel
18.3. Market Attractiveness Analysis
18.3.1. By Product Type
18.3.2. By Form
18.3.3. By Nature
18.3.4. By Flavour
18.3.5. By Price-Range
18.3.6. By Source
18.3.7. By Distributional Channel
18.4. Sales Channel Drivers and Restraints: Impact Analysis
19. Latin America Agave Nectar Market Analysis and Forecast
19.1. Introduction
19.1.1. Basis Point Share (BPS) Analysis By Country
19.1.2. Y-o-Y Growth Projections By Country
19.2. Agave Nectar Market Size (Value (US$) and Volume (MT) Analysis (2015-2019) and Forecast (2019-2029
19.2.1. Market Attractiveness By Country
19.2.1.1. Brazil
19.2.1.2. Mexico
19.2.1.3. Chile
19.2.1.4. Peru
19.2.1.5. Argentina
19.2.1.6. Rest of Latin America
19.2.2. By Product Type
19.2.3. By Form
19.2.4. By Nature
19.2.5. By Flavour
19.2.6. By Price-Range
19.2.7. By Source
19.2.8. By Distributional Channel
19.3. Sales Channel Market Attractiveness Analysis
19.3.1. By Product Type
19.3.2. By Form
19.3.3. By Nature
19.3.4. By Flavour
19.3.5. By Price-Range
19.3.6. By Source
19.3.7. By Distributional Channel
19.4. Sales Channel Drivers and Restraints: Impact Analysis
20. Europe Agave Nectar Market Analysis and Forecast
20.1. Introduction
20.1.1. Basis Point Share (BPS) Analysis By Country
20.1.2. Y-o-Y Growth Projections By Country
20.2. Agave Nectar Market Size (Value (US$) and Volume (MT) Analysis (2015-2019) and Forecast (2019-2029
20.2.1. Market Attractiveness By Country
20.2.1.1. EU-4 (Germany, France, Italy, Spain)
20.2.1.2. U.K.
20.2.1.3. BENELUX
20.2.1.4. Nordic
20.2.1.5. Russia
20.2.1.6. Poland
20.2.1.7. Rest of Europe
20.2.2. By Product Type
20.2.3. By Form
20.2.4. By Nature
20.2.5. By Flavour
20.2.6. By Price-Range
20.2.7. By Source
20.2.8. By Distributional Channel
20.3. Market Attractiveness Analysis
20.3.1. By Product Type
20.3.2. By Form
20.3.3. By Nature
20.3.4. By Flavour
20.3.5. By Price-Range
20.3.6. By Source
20.3.7. By Distributional Channel
20.4. Sales Channel Drivers and Restraints: Impact Analysis
21. APEJ Agave Nectar Market Analysis and Forecast
21.1. Introduction
21.1.1. Basis Point Share (BPS) Analysis By Country
21.1.2. Y-o-Y Growth Projections By Country
21.2. Agave Nectar Market Size (Value (US$) and Volume (MT) Analysis (2015-2019) and Forecast (2019-2029
21.2.1. Market Attractiveness By Country
21.2.1.1. China
21.2.1.2. India
21.2.1.3. South Korea
21.2.1.4. ASEAN
21.2.2. By Product Type
21.2.3. By Form
21.2.4. By Nature
21.2.5. By Flavour
21.2.6. By Price-Range
21.2.7. By Source
21.2.8. By Distributional Channel
21.3. Sales Channel Market Attractiveness Analysis
21.3.1. By Product Type
21.3.2. By Form
21.3.3. By Nature
21.3.4. By Flavour
21.3.5. By Price-Range
21.3.6. By Source
21.3.7. By Distributional Channel
21.4. Sales Channel Drivers and Restraints: Impact Analysis
22. Japan Agave Nectar Market Analysis and Forecast
22.1. Introduction
22.1.1. Basis Point Share (BPS) Analysis By Country
22.1.2. Y-o-Y Growth Projections By Country
22.2. Agave Nectar Market Size (Value (US$) and Volume (MT) Analysis (2015-2019) and Forecast (2019-2029
22.2.1. By Product Type
22.2.2. By Form
22.2.3. By Nature
22.2.4. By Flavour
22.2.5. By Price-Range
22.2.6. By Source
22.2.7. By Distributional Channel
22.3. Sales Channel Market Attractiveness Analysis
22.3.1. By Product Type
22.3.2. By Form
22.3.3. By Nature
22.3.4. By Flavour
22.3.5. By Price-Range
22.3.6. By Source
22.3.7. By Distributional Channel
22.4. Sales Channel Drivers and Restraints: Impact Analysis
23. Oceania Agave Nectar Market Analysis and Forecast
23.1. Introduction
23.1.1. Basis Point Share (BPS) Analysis By Country
23.1.2. Y-o-Y Growth Projections By Country
23.2. Agave Nectar Market Size (Value (US$) and Volume (MT) Analysis (2015-2019) and Forecast (2019-2029
23.2.1. Market Attractiveness By Country
23.2.1.1. Australia
23.2.1.2. New Zealand
23.2.2. By Product Type
23.2.3. By Form
23.2.4. By Nature
23.2.5. By Flavour
23.2.6. By Price-Range
23.2.7. By Source
23.2.8. By Distributional Channel
23.3. Sales Channel Market Attractiveness Analysis
23.3.1. By Product Type
23.3.2. By Form
23.3.3. By Nature
23.3.4. By Flavour
23.3.5. By Price-Range
23.3.6. By Source
23.3.7. By Distributional Channel
23.4. Sales Channel Drivers and Restraints: Impact Analysis
24. MEA Agave Nectar Market Analysis and Forecast
24.1. Introduction
24.1.1. Basis Point Share (BPS) Analysis By Country
24.1.2. Y-o-Y Growth Projections By Country
24.2. Agave Nectar Market Size (Value (US$) and Volume (MT) Analysis (2015-2019) and Forecast (2019-2029
24.2.1. Market Attractiveness By Country
24.2.1.1. GCC Countries
24.2.1.2. South Africa
24.2.1.3. North Africa
24.2.1.4. Rest of MEA
24.2.2. By Product Type
24.2.3. By Form
24.2.4. By Nature
24.2.5. By Flavour
24.2.6. By Price-Range
24.2.7. By Source
24.2.8. By Distributional Channel
24.3. Sales Channel Market Attractiveness Analysis
24.3.1. By Product Type
24.3.2. By Form
24.3.3. By Nature
24.3.4. By Flavour
24.3.5. By Price-Range
24.3.6. By Source
24.3.7. By Distributional Channel
24.4. Sales Channel Drivers and Restraints: Impact Analysis
25. Brand Assessment
25.1. Brand Identity (Brand as Product, Brand as Organization, Brand as
25.2. Person, Brand as Symbol)
25.3. Target Audience and Positioning (Demographic Segmentation,
25.4. Geographic Segmentation, Psychographic Segmentation, Situational
25.5. Segmentation)
25.6. Brand Strategy
25.7. Key Brands in US
25.7.1. Agave In The Raw
25.7.2. Great Value
25.7.3. Madhava
25.7.4. Health Garden
25.7.5. Margaritaville
25.7.6. Blue Green Agave
25.7.7. Blue Green Organics
25.7.8. Monin
25.7.9. Homebrew
25.7.10. Assortit
25.7.11. MadeWith
25.7.12. MADE WITH
25.7.13. By Organic
25.7.14. Larissa Veronica
25.7.15. Blue Green
25.7.16. Others on Additional Request
26. Competition Analysis
26.1. Competition Deep Dive (Tentative List)
26.1.1. The IIDEA Company
26.1.1.1. Overview
26.1.1.2. Product Portfolio
26.1.1.3. Profitability by Market Segments (Product/Channel/Region)
26.1.1.4. Sales Footprint
26.1.1.5. Strategy Overview
26.1.1.5.1. Marketing Strategy
26.1.1.5.2. Product Strategy
26.1.1.5.3. Channel Strategy
26.1.2. Malt Products Corporation
26.1.2.1. Overview
26.1.2.2. Product Portfolio
26.1.2.3. Profitability by Market Segments (Product/Channel/Region)
26.1.2.4. Sales Footprint
26.1.2.5. Strategy Overview
26.1.2.5.1. Marketing Strategy
26.1.2.5.2. Product Strategy
26.1.2.5.3. Channel Strategy
26.1.3. The Tierra Group
26.1.3.1. Overview
26.1.3.2. Product Portfolio
26.1.3.3. Profitability by Market Segments (Product/Channel/Region)
26.1.3.4. Sales Footprint
26.1.3.5. Strategy Overview
26.1.3.5.1. Marketing Strategy
26.1.3.5.2. Product Strategy
26.1.3.5.3. Channel Strategy
26.1.4. Sisana Sweeteners
26.1.4.1. Overview
26.1.4.2. Product Portfolio
26.1.4.3. Profitability by Market Segments (Product/Channel/Region)
26.1.4.4. Sales Footprint
26.1.4.5. Strategy Overview
26.1.4.5.1. Marketing Strategy
26.1.4.5.2. Product Strategy
26.1.4.5.3. Channel Strategy
26.1.5. Nature’s Agave, Inc.
26.1.5.1. Overview
26.1.5.2. Product Portfolio
26.1.5.3. Profitability by Market Segments (Product/Channel/Region)
26.1.5.4. Sales Footprint
26.1.5.5. Strategy Overview
26.1.5.5.1. Marketing Strategy
26.1.5.5.2. Product Strategy
26.1.5.5.3. Channel Strategy
26.1.6. Ciranda
26.1.6.1. Overview
26.1.6.2. Product Portfolio
26.1.6.3. Profitability by Market Segments (Product/Channel/Region)
26.1.6.4. Sales Footprint
26.1.6.5. Strategy Overview
26.1.6.5.1. Marketing Strategy
26.1.6.5.2. Product Strategy
26.1.6.5.3. Channel Strategy
26.1.7. Florida Crystals Corporation
26.1.7.1. Overview
26.1.7.2. Product Portfolio
26.1.7.3. Profitability by Market Segments (Product/Channel/Region)
26.1.7.4. Sales Footprint
26.1.7.5. Strategy Overview
26.1.7.5.1. Marketing Strategy
26.1.7.5.2. Product Strategy
26.1.7.5.3. Channel Strategy
26.1.8. Madhava Natural Sweeteners
26.1.8.1. Overview
26.1.8.2. Product Portfolio
26.1.8.3. Profitability by Market Segments (Product/Channel/Region)
26.1.8.4. Sales Footprint
26.1.8.5. Strategy Overview
26.1.8.5.1. Marketing Strategy
26.1.8.5.2. Product Strategy
26.1.8.5.3. Channel Strategy
26.1.9. Domino Foods, Inc.
26.1.9.1. Overview
26.1.9.2. Product Portfolio
26.1.9.3. Profitability by Market Segments (Product/Channel/Region)
26.1.9.4. Sales Footprint
26.1.9.5. Strategy Overview
26.1.9.5.1. Marketing Strategy
26.1.9.5.2. Product Strategy
26.1.9.5.3. Channel Strategy
26.1.10. Groovy Food Company Ltd.
26.1.10.1. Overview
26.1.10.2. Product Portfolio
26.1.10.3. Profitability by Market Segments (Product/Channel/Region)
26.1.10.4. Sales Footprint
26.1.10.5. Strategy Overview
26.1.10.5.1. Marketing Strategy
26.1.10.5.2. Product Strategy
26.1.10.5.3. Channel Strategy
26.1.11. The Colibree Company, Inc.
26.1.11.1. Overview
26.1.11.2. Product Portfolio
26.1.11.3. Profitability by Market Segments (Product/Channel/Region)
26.1.11.4. Sales Footprint
26.1.11.5. Strategy Overview
26.1.11.5.1. Marketing Strategy
26.1.11.5.2. Product Strategy
26.1.11.5.3. Channel Strategy
26.1.12. The Simple Syrup Co.
26.1.12.1. Overview
26.1.12.2. Product Portfolio
26.1.12.3. Profitability by Market Segments (Product/Channel/Region)
26.1.12.4. Sales Footprint
26.1.12.5. Strategy Overview
26.1.12.5.1. Marketing Strategy
26.1.12.5.2. Product Strategy
26.1.12.5.3. Channel Strategy
26.1.13. SunOpta, Inc.
26.1.13.1. Overview
26.1.13.2. Product Portfolio
26.1.13.3. Profitability by Market Segments (Product/Channel/Region)
26.1.13.4. Sales Footprint
26.1.13.5. Strategy Overview
26.1.13.5.1. Marketing Strategy
26.1.13.5.2. Product Strategy
26.1.13.5.3. Channel Strategy
26.1.14. Natura BioFoods
26.1.14.1. Overview
26.1.14.2. Product Portfolio
26.1.14.3. Profitability by Market Segments (Product/Channel/Region)
26.1.14.4. Sales Footprint
26.1.14.5. Strategy Overview
26.1.14.5.1. Marketing Strategy
26.1.14.5.2. Product Strategy
26.1.14.5.3. Channel Strategy
26.1.15. NOW Foods
26.1.15.1. Overview
26.1.15.2. Product Portfolio
26.1.15.3. Profitability by Market Segments (Product/Channel/Region)
26.1.15.4. Sales Footprint
26.1.15.5. Strategy Overview
26.1.15.5.1. Marketing Strategy
26.1.15.5.2. Product Strategy
26.1.15.5.3. Channel Strategy
26.1.16. Loving Earth Pty Ltd.
26.1.16.1. Overview
26.1.16.2. Product Portfolio
26.1.16.3. Profitability by Market Segments (Product/Channel/Region)
26.1.16.4. Sales Footprint
26.1.16.5. Strategy Overview
26.1.16.5.1. Marketing Strategy
26.1.16.5.2. Product Strategy
26.1.16.5.3. Channel Strategy
26.2. Key Producers and Production Data
27. Assumptions and Acronyms Used
28. Research Methodology
List of Tables
Table 1:Global Agave Nectar Market Historical Value (US$ Mn) Analysis by Product Type , 2015-2019
Table 2:Global Agave Nectar Market Historical Volume (MT) Analysis by Product Type , 2015-2019
Table 3:Global Agave Nectar Market Forecast Value (US$ Mn) Analysis by Product Type , 2020-2030
Table 4:Global Agave Nectar Market Forecast Volume (MT) Analysis by Product Type , 2020-2030
Table 5:Global Agave Nectar Market Historical Value (US$ Mn) Analysis by Form , 2015-2019
Table 6:Global Agave Nectar Market Historical Volume (MT) Analysis by Form , 2015-2019
Table 7:Global Agave Nectar Market Forecast Value (US$ Mn) Analysis by Form , 2020-2030
Table 8:Global Agave Nectar Market Forecast Volume (MT) Analysis by Form , 2020-2030
Table 9:Global Agave Nectar Market Historical Value (US$ Mn) Analysis by Nature , 2015-2019
Table 10:Global Agave Nectar Market Historical Volume (MT) Analysis by Nature , 2015-2019
Table 11:Global Agave Nectar Market Forecast Value (US$ Mn) Analysis by Nature , 2020-2030
Table 12:Global Agave Nectar Market Forecast Volume (MT) Analysis by Nature , 2020-2030
Table 13:Global Agave Nectar Market Historical Value (US$ Mn) Analysis by Flavour , 2015-2019
Table 14:Global Agave Nectar Market Historical Volume (MT) Analysis by Flavour , 2015-2019
Table 15:Global Agave Nectar Market Forecast Value (US$ Mn) Analysis by Flavour , 2020-2030
Table 16:Global Agave Nectar Market Forecast Volume (MT) Analysis by Flavour , 2020-2030
Table 17:Global Agave Nectar Market Historical Value (US$ Mn) Analysis by Price Range , 2015-2019
Table 18:Global Agave Nectar Market Historical Volume (MT) Analysis by Price Range , 2015-2019
Table 19:Global Agave Nectar Market Forecast Value (US$ Mn) Analysis by Price Range , 2020-2030
Table 20:Global Agave Nectar Market Forecast Volume (MT) Analysis by Price Range , 2020-2030
Table 21:Global Agave Nectar Market Historical Value (US$ Mn) Analysis by Source , 2015-2019
Table 22:Global Agave Nectar Market Historical Volume (MT) Analysis by Source , 2015-2019
Table 23:Global Agave Nectar Market Forecast Value (US$ Mn) Analysis by Source , 2020-2030
Table 24:Global Agave Nectar Market Forecast Volume (MT) Analysis by Source , 2020-2030
Table 25:Global Agave Nectar Market Historical Value (US$ Mn) Analysis by Distribution Channel , 2015-2019
Table 26:Global Agave Nectar Market Historical Volume (MT) Analysis by Distribution Channel , 2015-2019
Table 27:Global Agave Nectar Market Forecast Value (US$ Mn) Analysis by Distribution Channel , 2020-2030
Table 28:Global Agave Nectar Market Forecast Volume (MT) Analysis by Distribution Channel , 2020-2030
Table 29:Global Agave Nectar Market Historical Value (US$ Mn) Analysis by Region , 2015-2019
Table 30:Global Agave Nectar Market Historical Volume (MT) Analysis by Region , 2015-2019
Table 31:Global Agave Nectar Market Forecast Value (US$ Mn) Analysis by Region , 2020-2030
Table 32:Global Agave Nectar Market Forecast Volume (MT) Analysis by Region , 2020-2030
Table 33:North America Agave Nectar Market Historical Value (US$ Mn) Analysis by Product Type , 2015-2019
Table 34:North America Agave Nectar Market Historical Volume (MT) Analysis by Product Type , 2015-2019
Table 35:North America Agave Nectar Market Forecast Value (US$ Mn) Analysis by Product Type , 2020-2030
Table 36:North America Agave Nectar Market Forecast Volume (MT) Analysis by Product Type , 2020-2030
Table 37:North America Agave Nectar Market Historical Value (US$ Mn) Analysis by Form , 2015-2019
Table 38:North America Agave Nectar Market Historical Volume (MT) Analysis by Form , 2015-2019
Table 39:North America Agave Nectar Market Forecast Value (US$ Mn) Analysis by Form , 2020-2030
Table 40:North America Agave Nectar Market Forecast Volume (MT) Analysis by Form , 2020-2030
Table 41:North America Agave Nectar Market Historical Value (US$ Mn) Analysis by Nature , 2015-2019
Table 42:North America Agave Nectar Market Historical Volume (MT) Analysis by Nature , 2015-2019
Table 43:North America Agave Nectar Market Forecast Value (US$ Mn) Analysis by Nature , 2020-2030
Table 44:North America Agave Nectar Market Forecast Volume (MT) Analysis by Nature , 2020-2030
Table 45:North America Agave Nectar Market Historical Value (US$ Mn) Analysis by Flavour , 2015-2019
Table 46:North America Agave Nectar Market Historical Volume (MT) Analysis by Flavour , 2015-2019
Table 47:North America Agave Nectar Market Forecast Value (US$ Mn) Analysis by Flavour , 2020-2030
Table 48:North America Agave Nectar Market Forecast Volume (MT) Analysis by Flavour , 2020-2030
Table 49:North America Agave Nectar Market Historical Value (US$ Mn) Analysis by Price Range , 2015-2019
Table 50:North America Agave Nectar Market Historical Volume (MT) Analysis by Price Range , 2015-2019
Table 51:North America Agave Nectar Market Forecast Value (US$ Mn) Analysis by Price Range , 2020-2030
Table 52:North America Agave Nectar Market Forecast Volume (MT) Analysis by Price Range , 2020-2030
Table 53:North America Agave Nectar Market Historical Value (US$ Mn) Analysis by Source , 2015-2019
Table 54:North America Agave Nectar Market Historical Volume (MT) Analysis by Source , 2015-2019
Table 55:North America Agave Nectar Market Forecast Value (US$ Mn) Analysis by Source , 2020-2030
Table 56:North America Agave Nectar Market Forecast Volume (MT) Analysis by Source , 2020-2030
Table 57:North America Agave Nectar Market Historical Value (US$ Mn) Analysis by Distribution Channel , 2015-2019
Table 58:North America Agave Nectar Market Historical Volume (MT) Analysis by Distribution Channel , 2015-2019
Table 59:North America Agave Nectar Market Forecast Value (US$ Mn) Analysis by Distribution Channel , 2020-2030
Table 60:North America Agave Nectar Market Forecast Volume (MT) Analysis by Distribution Channel , 2020-2030
Table 61:North America Agave Nectar Market Historical Value (US$ Mn) Analysis by Country , 2015-2019
Table 62:North America Agave Nectar Market Historical Volume (MT) Analysis by Country , 2015-2019
Table 63:North America Agave Nectar Market Forecast Value (US$ Mn) Analysis by Country , 2020-2030
Table 64:North America Agave Nectar Market Forecast Volume (MT) Analysis by Country , 2020-2030
Table 65:Latin America Agave Nectar Market Historical Value (US$ Mn) Analysis by Product Type , 2015-2019
Table 66:Latin America Agave Nectar Market Historical Volume (MT) Analysis by Product Type , 2015-2019
Table 67:Latin America Agave Nectar Market Forecast Value (US$ Mn) Analysis by Product Type , 2020-2030
Table 68:Latin America Agave Nectar Market Forecast Volume (MT) Analysis by Product Type , 2020-2030
Table 69:Latin America Agave Nectar Market Historical Value (US$ Mn) Analysis by Form , 2015-2019
Table 70:Latin America Agave Nectar Market Historical Volume (MT) Analysis by Form , 2015-2019
Table 71:Latin America Agave Nectar Market Forecast Value (US$ Mn) Analysis by Form , 2020-2030
Table 72:Latin America Agave Nectar Market Forecast Volume (MT) Analysis by Form , 2020-2030
Table 73:Latin America Agave Nectar Market Historical Value (US$ Mn) Analysis by Nature , 2015-2019
Table 74:Latin America Agave Nectar Market Historical Volume (MT) Analysis by Nature , 2015-2019
Table 75:Latin America Agave Nectar Market Forecast Value (US$ Mn) Analysis by Nature , 2020-2030
Table 76:Latin America Agave Nectar Market Forecast Volume (MT) Analysis by Nature , 2020-2030
Table 77:Latin America Agave Nectar Market Historical Value (US$ Mn) Analysis by Flavour , 2015-2019
Table 78:Latin America Agave Nectar Market Historical Volume (MT) Analysis by Flavour , 2015-2019
Table 79:Latin America Agave Nectar Market Forecast Value (US$ Mn) Analysis by Flavour , 2020-2030
Table 80:Latin America Agave Nectar Market Forecast Volume (MT) Analysis by Flavour , 2020-2030
Table 81:Latin America Agave Nectar Market Historical Value (US$ Mn) Analysis by Price Range , 2015-2019
Table 82:Latin America Agave Nectar Market Historical Volume (MT) Analysis by Price Range , 2015-2019
Table 83:Latin America Agave Nectar Market Forecast Value (US$ Mn) Analysis by Price Range , 2020-2030
Table 84:Latin America Agave Nectar Market Forecast Volume (MT) Analysis by Price Range , 2020-2030
Table 85:Latin America Agave Nectar Market Historical Value (US$ Mn) Analysis by Source , 2015-2019
Table 86:Latin America Agave Nectar Market Historical Volume (MT) Analysis by Source , 2015-2019
Table 87:Latin America Agave Nectar Market Forecast Value (US$ Mn) Analysis by Source , 2020-2030
Table 88:Latin America Agave Nectar Market Forecast Volume (MT) Analysis by Source , 2020-2030
Table 89:Latin America Agave Nectar Market Historical Value (US$ Mn) Analysis by Distribution Channel , 2015-2019
Table 90:Latin America Agave Nectar Market Historical Volume (MT) Analysis by Distribution Channel , 2015-2019
Table 91:Latin America Agave Nectar Market Forecast Value (US$ Mn) Analysis by Distribution Channel , 2020-2030
Table 92:Latin America Agave Nectar Market Forecast Volume (MT) Analysis by Distribution Channel , 2020-2030
Table 93:Latin America Agave Nectar Market Historical Value (US$ Mn) Analysis by Country , 2015-2019
Table 94:Latin America Agave Nectar Market Historical Volume (MT) Analysis by Country , 2015-2019
Table 95:Latin America Agave Nectar Market Forecast Value (US$ Mn) Analysis by Country , 2020-2030
Table 96:Latin America Agave Nectar Market Forecast Volume (MT) Analysis by Country , 2020-2030
Table 97:Europe Agave Nectar Market Historical Value (US$ Mn) Analysis by Product Type , 2015-2019
Table 98:Europe Agave Nectar Market Historical Volume (MT) Analysis by Product Type , 2015-2019
Table 99:Europe Agave Nectar Market Forecast Value (US$ Mn) Analysis by Product Type , 2020-2030
Table 100:Europe Agave Nectar Market Forecast Volume (MT) Analysis by Product Type , 2020-2030
Table 101:Europe Agave Nectar Market Historical Value (US$ Mn) Analysis by Form , 2015-2019
Table 102:Europe Agave Nectar Market Historical Volume (MT) Analysis by Form , 2015-2019
Table 103:Europe Agave Nectar Market Forecast Value (US$ Mn) Analysis by Form , 2020-2030
Table 104:Europe Agave Nectar Market Forecast Volume (MT) Analysis by Form , 2020-2030
Table 105:Europe Agave Nectar Market Historical Value (US$ Mn) Analysis by Nature , 2015-2019
Table 106:Europe Agave Nectar Market Historical Volume (MT) Analysis by Nature , 2015-2019
Table 107:Europe Agave Nectar Market Forecast Value (US$ Mn) Analysis by Nature , 2020-2030
Table 108:Europe Agave Nectar Market Forecast Volume (MT) Analysis by Nature , 2020-2030
Table 109:Europe Agave Nectar Market Historical Value (US$ Mn) Analysis by Flavour , 2015-2019
Table 110:Europe Agave Nectar Market Historical Volume (MT) Analysis by Flavour , 2015-2019
Table 111:Europe Agave Nectar Market Forecast Value (US$ Mn) Analysis by Flavour , 2020-2030
Table 112:Europe Agave Nectar Market Forecast Volume (MT) Analysis by Flavour , 2020-2030
Table 113:Europe Agave Nectar Market Historical Value (US$ Mn) Analysis by Price Range , 2015-2019
Table 114:Europe Agave Nectar Market Historical Volume (MT) Analysis by Price Range , 2015-2019
Table 115:Europe Agave Nectar Market Forecast Value (US$ Mn) Analysis by Price Range , 2020-2030
Table 116:Europe Agave Nectar Market Forecast Volume (MT) Analysis by Price Range , 2020-2030
Table 117:Europe Agave Nectar Market Historical Value (US$ Mn) Analysis by Source , 2015-2019
Table 118:Europe Agave Nectar Market Historical Volume (MT) Analysis by Source , 2015-2019
Table 119:Europe Agave Nectar Market Forecast Value (US$ Mn) Analysis by Source , 2020-2030
Table 120:Europe Agave Nectar Market Forecast Volume (MT) Analysis by Source , 2020-2030
Table 121:Europe Agave Nectar Market Historical Value (US$ Mn) Analysis by Distribution Channel , 2015-2019
Table 122:Europe Agave Nectar Market Historical Volume (MT) Analysis by Distribution Channel , 2015-2019
Table 123:Europe Agave Nectar Market Forecast Value (US$ Mn) Analysis by Distribution Channel , 2020-2030
Table 124:Europe Agave Nectar Market Forecast Volume (MT) Analysis by Distribution Channel , 2020-2030
Table 125:Europe Agave Nectar Market Historical Value (US$ Mn) Analysis by Country , 2015-2019
Table 126:Europe Agave Nectar Market Historical Volume (MT) Analysis by Country , 2015-2019
Table 127:Europe Agave Nectar Market Forecast Value (US$ Mn) Analysis by Country , 2020-2030
Table 128:Europe Agave Nectar Market Forecast Volume (MT) Analysis by Country , 2020-2030
Table 129:Asia Pacific Agave Nectar Market Historical Value (US$ Mn) Analysis by Product Type , 2015-2019
Table 130:Asia Pacific Agave Nectar Market Historical Volume (MT) Analysis by Product Type , 2015-2019
Table 131:Asia Pacific Agave Nectar Market Forecast Value (US$ Mn) Analysis by Product Type , 2020-2030
Table 132:Asia Pacific Agave Nectar Market Forecast Volume (MT) Analysis by Product Type , 2020-2030
Table 133:Asia Pacific Agave Nectar Market Historical Value (US$ Mn) Analysis by Form , 2015-2019
Table 134:Asia Pacific Agave Nectar Market Historical Volume (MT) Analysis by Form , 2015-2019
Table 135:Asia Pacific Agave Nectar Market Forecast Value (US$ Mn) Analysis by Form , 2020-2030
Table 136:Asia Pacific Agave Nectar Market Forecast Volume (MT) Analysis by Form , 2020-2030
Table 137:Asia Pacific Agave Nectar Market Historical Value (US$ Mn) Analysis by Nature , 2015-2019
Table 138:Asia Pacific Agave Nectar Market Historical Volume (MT) Analysis by Nature , 2015-2019
Table 139:Asia Pacific Agave Nectar Market Forecast Value (US$ Mn) Analysis by Nature , 2020-2030
Table 140:Asia Pacific Agave Nectar Market Forecast Volume (MT) Analysis by Nature , 2020-2030
Table 141:Asia Pacific Agave Nectar Market Historical Value (US$ Mn) Analysis by Flavour , 2015-2019
Table 142:Asia Pacific Agave Nectar Market Historical Volume (MT) Analysis by Flavour , 2015-2019
Table 143:Asia Pacific Agave Nectar Market Forecast Value (US$ Mn) Analysis by Flavour , 2020-2030
Table 144:Asia Pacific Agave Nectar Market Forecast Volume (MT) Analysis by Flavour , 2020-2030
Table 145:Asia Pacific Agave Nectar Market Historical Value (US$ Mn) Analysis by Price Range , 2015-2019
Table 146:Asia Pacific Agave Nectar Market Historical Volume (MT) Analysis by Price Range , 2015-2019
Table 147:Asia Pacific Agave Nectar Market Forecast Value (US$ Mn) Analysis by Price Range , 2020-2030
Table 148:Asia Pacific Agave Nectar Market Forecast Volume (MT) Analysis by Price Range , 2020-2030
Table 149:Asia Pacific Agave Nectar Market Historical Value (US$ Mn) Analysis by Source , 2015-2019
Table 150:Asia Pacific Agave Nectar Market Historical Volume (MT) Analysis by Source , 2015-2019
Table 151:Asia Pacific Agave Nectar Market Forecast Value (US$ Mn) Analysis by Source , 2020-2030
Table 152:Asia Pacific Agave Nectar Market Forecast Volume (MT) Analysis by Source , 2020-2030
Table 153:Asia Pacific Agave Nectar Market Historical Value (US$ Mn) Analysis by Distribution Channel , 2015-2019
Table 154:Asia Pacific Agave Nectar Market Historical Volume (MT) Analysis by Distribution Channel , 2015-2019
Table 155:Asia Pacific Agave Nectar Market Forecast Value (US$ Mn) Analysis by Distribution Channel , 2020-2030
Table 156:Asia Pacific Agave Nectar Market Forecast Volume (MT) Analysis by Distribution Channel , 2020-2030
Table 157:Asia Pacific Agave Nectar Market Historical Value (US$ Mn) Analysis by Country , 2015-2019
Table 158:Asia Pacific Agave Nectar Market Historical Volume (MT) Analysis by Country , 2015-2019
Table 159:Asia Pacific Agave Nectar Market Forecast Value (US$ Mn) Analysis by Country , 2020-2030
Table 160:Asia Pacific Agave Nectar Market Forecast Volume (MT) Analysis by Country , 2020-2030
Table 161:Oceania Agave Nectar Market Historical Value (US$ Mn) Analysis by Product Type , 2015-2019
Table 162:Oceania Agave Nectar Market Historical Volume (MT) Analysis by Product Type , 2015-2019
Table 163:Oceania Agave Nectar Market Forecast Value (US$ Mn) Analysis by Product Type , 2020-2030
Table 164:Oceania Agave Nectar Market Forecast Volume (MT) Analysis by Product Type , 2020-2030
Table 165:Oceania Agave Nectar Market Historical Value (US$ Mn) Analysis by Form , 2015-2019
Table 166:Oceania Agave Nectar Market Historical Volume (MT) Analysis by Form , 2015-2019
Table 167:Oceania Agave Nectar Market Forecast Value (US$ Mn) Analysis by Form , 2020-2030
Table 168:Oceania Agave Nectar Market Forecast Volume (MT) Analysis by Form , 2020-2030
Table 169:Oceania Agave Nectar Market Historical Value (US$ Mn) Analysis by Nature , 2015-2019
Table 170:Oceania Agave Nectar Market Historical Volume (MT) Analysis by Nature , 2015-2019
Table 171:Oceania Agave Nectar Market Forecast Value (US$ Mn) Analysis by Nature , 2020-2030
Table 172:Oceania Agave Nectar Market Forecast Volume (MT) Analysis by Nature , 2020-2030
Table 173:Oceania Agave Nectar Market Historical Value (US$ Mn) Analysis by Flavour , 2015-2019
Table 174:Oceania Agave Nectar Market Historical Volume (MT) Analysis by Flavour , 2015-2019
Table 175:Oceania Agave Nectar Market Forecast Value (US$ Mn) Analysis by Flavour , 2020-2030
Table 176:Oceania Agave Nectar Market Forecast Volume (MT) Analysis by Flavour , 2020-2030
Table 177:Oceania Agave Nectar Market Historical Value (US$ Mn) Analysis by Price Range , 2015-2019
Table 178:Oceania Agave Nectar Market Historical Volume (MT) Analysis by Price Range , 2015-2019
Table 179:Oceania Agave Nectar Market Forecast Value (US$ Mn) Analysis by Price Range , 2020-2030
Table 180:Oceania Agave Nectar Market Forecast Volume (MT) Analysis by Price Range , 2020-2030
Table 181:Oceania Agave Nectar Market Historical Value (US$ Mn) Analysis by Source , 2015-2019
Table 182:Oceania Agave Nectar Market Historical Volume (MT) Analysis by Source , 2015-2019
Table 183:Oceania Agave Nectar Market Forecast Value (US$ Mn) Analysis by Source , 2020-2030
Table 184:Oceania Agave Nectar Market Forecast Volume (MT) Analysis by Source , 2020-2030
Table 185:Oceania Agave Nectar Market Historical Value (US$ Mn) Analysis by Distribution Channel , 2015-2019
Table 186:Oceania Agave Nectar Market Historical Volume (MT) Analysis by Distribution Channel , 2015-2019
Table 187:Oceania Agave Nectar Market Forecast Value (US$ Mn) Analysis by Distribution Channel , 2020-2030
Table 188:Oceania Agave Nectar Market Forecast Volume (MT) Analysis by Distribution Channel , 2020-2030
Table 189:Oceania Agave Nectar Market Historical Value (US$ Mn) Analysis by Country , 2015-2019
Table 190:Oceania Agave Nectar Market Historical Volume (MT) Analysis by Country , 2015-2019
Table 191:Oceania Agave Nectar Market Forecast Value (US$ Mn) Analysis by Country , 2020-2030
Table 192:Oceania Agave Nectar Market Forecast Volume (MT) Analysis by Country , 2020-2030
Table 193:MEA Agave Nectar Market Historical Value (US$ Mn) Analysis by Product Type , 2015-2019
Table 194:MEA Agave Nectar Market Historical Volume (MT) Analysis by Product Type , 2015-2019
Table 195:MEA Agave Nectar Market Forecast Value (US$ Mn) Analysis by Product Type , 2020-2030
Table 196:MEA Agave Nectar Market Forecast Volume (MT) Analysis by Product Type , 2020-2030
Table 197:MEA Agave Nectar Market Historical Value (US$ Mn) Analysis by Form , 2015-2019
Table 198:MEA Agave Nectar Market Historical Volume (MT) Analysis by Form , 2015-2019
Table 199:MEA Agave Nectar Market Forecast Value (US$ Mn) Analysis by Form , 2020-2030
Table 200:MEA Agave Nectar Market Forecast Volume (MT) Analysis by Form , 2020-2030
Table 201:MEA Agave Nectar Market Historical Value (US$ Mn) Analysis by Nature , 2015-2019
Table 202:MEA Agave Nectar Market Historical Volume (MT) Analysis by Nature , 2015-2019
Table 203:MEA Agave Nectar Market Forecast Value (US$ Mn) Analysis by Nature , 2020-2030
Table 204:MEA Agave Nectar Market Forecast Volume (MT) Analysis by Nature , 2020-2030
Table 205:MEA Agave Nectar Market Historical Value (US$ Mn) Analysis by Flavour , 2015-2019
Table 206:MEA Agave Nectar Market Historical Volume (MT) Analysis by Flavour , 2015-2019
Table 207:MEA Agave Nectar Market Forecast Value (US$ Mn) Analysis by Flavour , 2020-2030
Table 208:MEA Agave Nectar Market Forecast Volume (MT) Analysis by Flavour , 2020-2030
Table 209:MEA Agave Nectar Market Historical Value (US$ Mn) Analysis by Price Range , 2015-2019
Table 210:MEA Agave Nectar Market Historical Volume (MT) Analysis by Price Range , 2015-2019
Table 211:MEA Agave Nectar Market Forecast Value (US$ Mn) Analysis by Price Range , 2020-2030
Table 212:MEA Agave Nectar Market Forecast Volume (MT) Analysis by Price Range , 2020-2030
Table 213:MEA Agave Nectar Market Historical Value (US$ Mn) Analysis by Source , 2015-2019
Table 214:MEA Agave Nectar Market Historical Volume (MT) Analysis by Source , 2015-2019
Table 215:MEA Agave Nectar Market Forecast Value (US$ Mn) Analysis by Source , 2020-2030
Table 216:MEA Agave Nectar Market Forecast Volume (MT) Analysis by Source , 2020-2030
Table 217:MEA Agave Nectar Market Historical Value (US$ Mn) Analysis by Distribution Channel , 2015-2019
Table 218:MEA Agave Nectar Market Historical Volume (MT) Analysis by Distribution Channel , 2015-2019
Table 219:MEA Agave Nectar Market Forecast Value (US$ Mn) Analysis by Distribution Channel , 2020-2030
Table 220:MEA Agave Nectar Market Forecast Volume (MT) Analysis by Distribution Channel , 2020-2030
Table 221:MEA Agave Nectar Market Historical Value (US$ Mn) Analysis by Country , 2015-2019
Table 222:MEA Agave Nectar Market Historical Volume (MT) Analysis by Country , 2015-2019
Table 223:MEA Agave Nectar Market Forecast Value (US$ Mn) Analysis by Country , 2020-2030
Table 224:MEA Agave Nectar Market Forecast Volume (MT) Analysis by Country , 2020-2030
Table 225:Japan Agave Nectar Market Historical Value (US$ Mn) Analysis by Product Type , 2015-2019
Table 226:Japan Agave Nectar Market Historical Volume (MT) Analysis by Product Type , 2015-2019
Table 227:Japan Agave Nectar Market Forecast Value (US$ Mn) Analysis by Product Type , 2020-2030
Table 228:Japan Agave Nectar Market Forecast Volume (MT) Analysis by Product Type , 2020-2030
Table 229:Japan Agave Nectar Market Historical Value (US$ Mn) Analysis by Form , 2015-2019
Table 230:Japan Agave Nectar Market Historical Volume (MT) Analysis by Form , 2015-2019
Table 231:Japan Agave Nectar Market Forecast Value (US$ Mn) Analysis by Form , 2020-2030
Table 232:Japan Agave Nectar Market Forecast Volume (MT) Analysis by Form , 2020-2030
Table 233:Japan Agave Nectar Market Historical Value (US$ Mn) Analysis by Nature , 2015-2019
Table 234:Japan Agave Nectar Market Historical Volume (MT) Analysis by Nature , 2015-2019
Table 235:Japan Agave Nectar Market Forecast Value (US$ Mn) Analysis by Nature , 2020-2030
Table 236:Japan Agave Nectar Market Forecast Volume (MT) Analysis by Nature , 2020-2030
Table 237:Japan Agave Nectar Market Historical Value (US$ Mn) Analysis by Flavor , 2015-2019
Table 238:Japan Agave Nectar Market Historical Volume (MT) Analysis by Flavor , 2015-2019
Table 239:Japan Agave Nectar Market Forecast Value (US$ Mn) Analysis by Flavor , 2020-2030
Table 240:Japan Agave Nectar Market Forecast Volume (MT) Analysis by Flavor , 2020-2030
Table 241:Japan Agave Nectar Market Historical Value (US$ Mn) Analysis by Price Range , 2015-2019
Table 242:Japan Agave Nectar Market Historical Volume (MT) Analysis by Price Range , 2015-2019
Table 243:Japan Agave Nectar Market Forecast Value (US$ Mn) Analysis by Price Range , 2020-2030
Table 244:Japan Agave Nectar Market Forecast Volume (MT) Analysis by Price Range , 2020-2030
Table 245:Japan Agave Nectar Market Historical Value (US$ Mn) Analysis by Source , 2015-2019
Table 246:Japan Agave Nectar Market Historical Volume (MT) Analysis by Source , 2015-2019
Table 247:Japan Agave Nectar Market Forecast Value (US$ Mn) Analysis by Source , 2020-2030
Table 248:Japan Agave Nectar Market Forecast Volume (MT) Analysis by Source , 2020-2030
Table 249:Japan Agave Nectar Market Historical Value (US$ Mn) Analysis by Distribution Channel , 2015-2019
Table 250:Japan Agave Nectar Market Historical Volume (MT) Analysis by Distribution Channel , 2015-2019
Table 251:Japan Agave Nectar Market Forecast Value (US$ Mn) Analysis by Distribution Channel , 2020-2030
Table 252:Japan Agave Nectar Market Forecast Volume (MT) Analysis by Distribution Channel , 2020-2030
Table 253:Japan Agave Nectar Market Historical Value (US$ Mn) Analysis by Country , 2015-2019
Table 254:Japan Agave Nectar Market Historical Volume (MT) Analysis by Country , 2015-2019
Table 255:Japan Agave Nectar Market Forecast Value (US$ Mn) Analysis by Country , 2020-2030
Table 256:Japan Agave Nectar Market Forecast Volume (MT) Analysis by Country , 2020-2030
List of Figures
Figure 1:Global Agave Nectar Market Value Y-o-Y Growth and Forecast, 2015-2030
Figure 2:Global Agave Nectar Market Incremental $ Opportunity, 2020-2030
Figure 3:Global Agave Nectar Market Incremental Volume (MT), 2020-2030
Figure 4:Global Agave Nectar Market Value Y-o-Y Growth and Forecast, by Region, 2015-2030
Figure 5:Global Agave Nectar Market Incremental $ Opportunity, by Region, 2020-2030
Figure 6:Global Agave Nectar Market Attractiveness Index, by Region, 2020-2030
Figure 7:Global Agave Nectar Market Value Y-o-Y Growth and Forecast, by Product Type , 2015-2030
Figure 8:Global Agave Nectar Market Incremental $ Opportunity, by Product Type , 2020-2030
Figure 9:Global Agave Nectar Market Attractiveness Index, by Product Type , 2020-2030
Figure 10:Global Agave Nectar Market Value Y-o-Y Growth and Forecast, by Form , 2015-2030
Figure 11:Global Agave Nectar Market Incremental $ Opportunity, by Form , 2020-2030
Figure 12:Global Agave Nectar Market Attractiveness Index, by Form , 2020-2030
Figure 13:Global Agave Nectar Market Value Y-o-Y Growth and Forecast, by Nature , 2015-2030
Figure 14:Global Agave Nectar Market Incremental $ Opportunity, by Nature , 2020-2030
Figure 15:Global Agave Nectar Market Attractiveness Index, by Nature , 2020-2030
Figure 16:Global Agave Nectar Market Value Y-o-Y Growth and Forecast, by Flavour , 2015-2030
Figure 17:Global Agave Nectar Market Incremental $ Opportunity, by Flavour , 2020-2030
Figure 18:Global Agave Nectar Market Attractiveness Index, by Flavour , 2020-2030
Figure 19:Global Agave Nectar Market Value Y-o-Y Growth and Forecast, by Price Range , 2015-2030
Figure 20:Global Agave Nectar Market Incremental $ Opportunity, by Price Range , 2020-2030
Figure 21:Global Agave Nectar Market Attractiveness Index, by Price Range , 2020-2030
Figure 22:Global Agave Nectar Market Value Y-o-Y Growth and Forecast, by Source , 2015-2030
Figure 23:Global Agave Nectar Market Incremental $ Opportunity, by Source , 2020-2030
Figure 24:Global Agave Nectar Market Attractiveness Index, by Source , 2020-2030
Figure 25:Global Agave Nectar Market Value Y-o-Y Growth and Forecast, by Distribution Channel , 2015-2030
Figure 26:Global Agave Nectar Market Incremental $ Opportunity, by Distribution Channel , 2020-2030
Figure 27:Global Agave Nectar Market Attractiveness Index, by Distribution Channel , 2020-2030
Figure 28:North America Agave Nectar Market Value Y-o-Y Growth and Forecast, 2015-2030
Figure 29:North America Agave Nectar Market Incremental $ Opportunity, 2020-2030
Figure 30:North America Agave Nectar Market Incremental Volume (MT), 2020-2030
Figure 31:North America Agave Nectar Market Value Y-o-Y Growth and Forecast, by Country, 2015-2030
Figure 32:North America Agave Nectar Market Incremental $ Opportunity, by Country, 2020-2030
Figure 33:North America Agave Nectar Market Attractiveness Index, by Country, 2020-2030
Figure 34:North America Agave Nectar Market Value Y-o-Y Growth and Forecast, by Product Type , 2015-2030
Figure 35:North America Agave Nectar Market Incremental $ Opportunity, by Product Type , 2020-2030
Figure 36:North America Agave Nectar Market Attractiveness Index, by Product Type , 2020-2030
Figure 37:North America Agave Nectar Market Value Y-o-Y Growth and Forecast, by Form , 2015-2030
Figure 38:North America Agave Nectar Market Incremental $ Opportunity, by Form , 2020-2030
Figure 39:North America Agave Nectar Market Attractiveness Index, by Form , 2020-2030
Figure 40:North America Agave Nectar Market Value Y-o-Y Growth and Forecast, by Nature , 2015-2030
Figure 41:North America Agave Nectar Market Incremental $ Opportunity, by Nature , 2020-2030
Figure 42:North America Agave Nectar Market Attractiveness Index, by Nature , 2020-2030
Figure 43:North America Agave Nectar Market Value Y-o-Y Growth and Forecast, by Flavour , 2015-2030
Figure 44:North America Agave Nectar Market Incremental $ Opportunity, by Flavour , 2020-2030
Figure 45:North America Agave Nectar Market Attractiveness Index, by Flavour , 2020-2030
Figure 46:North America Agave Nectar Market Value Y-o-Y Growth and Forecast, by Price Range , 2015-2030
Figure 47:North America Agave Nectar Market Incremental $ Opportunity, by Price Range , 2020-2030
Figure 48:North America Agave Nectar Market Attractiveness Index, by Price Range , 2020-2030
Figure 49:North America Agave Nectar Market Value Y-o-Y Growth and Forecast, by Source , 2015-2030
Figure 50:North America Agave Nectar Market Incremental $ Opportunity, by Source , 2020-2030
Figure 51:North America Agave Nectar Market Attractiveness Index, by Source , 2020-2030
Figure 52:North America Agave Nectar Market Value Y-o-Y Growth and Forecast, by Distribution Channel , 2015-2030
Figure 53:North America Agave Nectar Market Incremental $ Opportunity, by Distribution Channel , 2020-2030
Figure 54:North America Agave Nectar Market Attractiveness Index, by Distribution Channel , 2020-2030
Figure 55:Latin America Agave Nectar Market Value Y-o-Y Growth and Forecast, 2015-2030
Figure 56:Latin America Agave Nectar Market Incremental $ Opportunity, 2020-2030
Figure 57:Latin America Agave Nectar Market Incremental Volume (MT), 2020-2030
Figure 58:Latin America Agave Nectar Market Value Y-o-Y Growth and Forecast, by Country, 2015-2030
Figure 59:Latin America Agave Nectar Market Incremental $ Opportunity, by Country, 2020-2030
Figure 60:Latin America Agave Nectar Market Attractiveness Index, by Country, 2020-2030
Figure 61:Latin America Agave Nectar Market Value Y-o-Y Growth and Forecast, by Product Type , 2015-2030
Figure 62:Latin America Agave Nectar Market Incremental $ Opportunity, by Product Type , 2020-2030
Figure 63:Latin America Agave Nectar Market Attractiveness Index, by Product Type , 2020-2030
Figure 64:Latin America Agave Nectar Market Value Y-o-Y Growth and Forecast, by Form , 2015-2030
Figure 65:Latin America Agave Nectar Market Incremental $ Opportunity, by Form , 2020-2030
Figure 66:Latin America Agave Nectar Market Attractiveness Index, by Form , 2020-2030
Figure 67:Latin America Agave Nectar Market Value Y-o-Y Growth and Forecast, by Nature , 2015-2030
Figure 68:Latin America Agave Nectar Market Incremental $ Opportunity, by Nature , 2020-2030
Figure 69:Latin America Agave Nectar Market Attractiveness Index, by Nature , 2020-2030
Figure 70:Latin America Agave Nectar Market Value Y-o-Y Growth and Forecast, by Flavour , 2015-2030
Figure 71:Latin America Agave Nectar Market Incremental $ Opportunity, by Flavour , 2020-2030
Figure 72:Latin America Agave Nectar Market Attractiveness Index, by Flavour , 2020-2030
Figure 73:Latin America Agave Nectar Market Value Y-o-Y Growth and Forecast, by Price Range , 2015-2030
Figure 74:Latin America Agave Nectar Market Incremental $ Opportunity, by Price Range , 2020-2030
Figure 75:Latin America Agave Nectar Market Attractiveness Index, by Price Range , 2020-2030
Figure 76:Latin America Agave Nectar Market Value Y-o-Y Growth and Forecast, by Source , 2015-2030
Figure 77:Latin America Agave Nectar Market Incremental $ Opportunity, by Source , 2020-2030
Figure 78:Latin America Agave Nectar Market Attractiveness Index, by Source , 2020-2030
Figure 79:Latin America Agave Nectar Market Value Y-o-Y Growth and Forecast, by Distribution Channel , 2015-2030
Figure 80:Latin America Agave Nectar Market Incremental $ Opportunity, by Distribution Channel , 2020-2030
Figure 81:Latin America Agave Nectar Market Attractiveness Index, by Distribution Channel , 2020-2030
Figure 82:Europe Agave Nectar Market Value Y-o-Y Growth and Forecast, 2015-2030
Figure 83:Europe Agave Nectar Market Incremental $ Opportunity, 2020-2030
Figure 84:Europe Agave Nectar Market Incremental Volume (MT), 2020-2030
Figure 85:Europe Agave Nectar Market Value Y-o-Y Growth and Forecast, by Country, 2015-2030
Figure 86:Europe Agave Nectar Market Incremental $ Opportunity, by Country, 2020-2030
Figure 87:Europe Agave Nectar Market Attractiveness Index, by Country, 2020-2030
Figure 88:Europe Agave Nectar Market Value Y-o-Y Growth and Forecast, by Product Type , 2015-2030
Figure 89:Europe Agave Nectar Market Incremental $ Opportunity, by Product Type , 2020-2030
Figure 90:Europe Agave Nectar Market Attractiveness Index, by Product Type , 2020-2030
Figure 91:Europe Agave Nectar Market Value Y-o-Y Growth and Forecast, by Form , 2015-2030
Figure 92:Europe Agave Nectar Market Incremental $ Opportunity, by Form , 2020-2030
Figure 93:Europe Agave Nectar Market Attractiveness Index, by Form , 2020-2030
Figure 94:Europe Agave Nectar Market Value Y-o-Y Growth and Forecast, by Nature , 2015-2030
Figure 95:Europe Agave Nectar Market Incremental $ Opportunity, by Nature , 2020-2030
Figure 96:Europe Agave Nectar Market Attractiveness Index, by Nature , 2020-2030
Figure 97:Europe Agave Nectar Market Value Y-o-Y Growth and Forecast, by Flavour , 2015-2030
Figure 98:Europe Agave Nectar Market Incremental $ Opportunity, by Flavour , 2020-2030
Figure 99:Europe Agave Nectar Market Attractiveness Index, by Flavour , 2020-2030
Figure 100:Europe Agave Nectar Market Value Y-o-Y Growth and Forecast, by Price Range , 2015-2030
Figure 101:Europe Agave Nectar Market Incremental $ Opportunity, by Price Range , 2020-2030
Figure 102:Europe Agave Nectar Market Attractiveness Index, by Price Range , 2020-2030
Figure 103:Europe Agave Nectar Market Value Y-o-Y Growth and Forecast, by Source , 2015-2030
Figure 104:Europe Agave Nectar Market Incremental $ Opportunity, by Source , 2020-2030
Figure 105:Europe Agave Nectar Market Attractiveness Index, by Source , 2020-2030
Figure 106:Europe Agave Nectar Market Value Y-o-Y Growth and Forecast, by Distribution Channel , 2015-2030
Figure 107:Europe Agave Nectar Market Incremental $ Opportunity, by Distribution Channel , 2020-2030
Figure 108:Europe Agave Nectar Market Attractiveness Index, by Distribution Channel , 2020-2030
Figure 109:Asia Pacific Agave Nectar Market Value Y-o-Y Growth and Forecast, 2015-2030
Figure 110:Asia Pacific Agave Nectar Market Incremental $ Opportunity, 2020-2030
Figure 111:Asia Pacific Agave Nectar Market Incremental Volume (MT), 2020-2030
Figure 112:Asia Pacific Agave Nectar Market Value Y-o-Y Growth and Forecast, by Country, 2015-2030
Figure 113:Asia Pacific Agave Nectar Market Incremental $ Opportunity, by Country, 2020-2030
Figure 114:Asia Pacific Agave Nectar Market Attractiveness Index, by Country, 2020-2030
Figure 115:Asia Pacific Agave Nectar Market Value Y-o-Y Growth and Forecast, by Product Type , 2015-2030
Figure 116:Asia Pacific Agave Nectar Market Incremental $ Opportunity, by Product Type , 2020-2030
Figure 117:Asia Pacific Agave Nectar Market Attractiveness Index, by Product Type , 2020-2030
Figure 118:Asia Pacific Agave Nectar Market Value Y-o-Y Growth and Forecast, by Form , 2015-2030
Figure 119:Asia Pacific Agave Nectar Market Incremental $ Opportunity, by Form , 2020-2030
Figure 120:Asia Pacific Agave Nectar Market Attractiveness Index, by Form , 2020-2030
Figure 121:Asia Pacific Agave Nectar Market Value Y-o-Y Growth and Forecast, by Nature , 2015-2030
Figure 122:Asia Pacific Agave Nectar Market Incremental $ Opportunity, by Nature , 2020-2030
Figure 123:Asia Pacific Agave Nectar Market Attractiveness Index, by Nature , 2020-2030
Figure 124:Asia Pacific Agave Nectar Market Value Y-o-Y Growth and Forecast, by Flavour , 2015-2030
Figure 125:Asia Pacific Agave Nectar Market Incremental $ Opportunity, by Flavour , 2020-2030
Figure 126:Asia Pacific Agave Nectar Market Attractiveness Index, by Flavour , 2020-2030
Figure 127:Asia Pacific Agave Nectar Market Value Y-o-Y Growth and Forecast, by Price Range , 2015-2030
Figure 128:Asia Pacific Agave Nectar Market Incremental $ Opportunity, by Price Range , 2020-2030
Figure 129:Asia Pacific Agave Nectar Market Attractiveness Index, by Price Range , 2020-2030
Figure 130:Asia Pacific Agave Nectar Market Value Y-o-Y Growth and Forecast, by Source , 2015-2030
Figure 131:Asia Pacific Agave Nectar Market Incremental $ Opportunity, by Source , 2020-2030
Figure 132:Asia Pacific Agave Nectar Market Attractiveness Index, by Source , 2020-2030
Figure 133:Asia Pacific Agave Nectar Market Value Y-o-Y Growth and Forecast, by Distribution Channel , 2015-2030
Figure 134:Asia Pacific Agave Nectar Market Incremental $ Opportunity, by Distribution Channel , 2020-2030
Figure 135:Asia Pacific Agave Nectar Market Attractiveness Index, by Distribution Channel , 2020-2030
Figure 136:Oceania Agave Nectar Market Value Y-o-Y Growth and Forecast, 2015-2030
Figure 137:Oceania Agave Nectar Market Incremental $ Opportunity, 2020-2030
Figure 138:Oceania Agave Nectar Market Incremental Volume (MT), 2020-2030
Figure 139:Oceania Agave Nectar Market Value Y-o-Y Growth and Forecast, by Country, 2015-2030
Figure 140:Oceania Agave Nectar Market Incremental $ Opportunity, by Country, 2020-2030
Figure 141:Oceania Agave Nectar Market Attractiveness Index, by Country, 2020-2030
Figure 142:Oceania Agave Nectar Market Value Y-o-Y Growth and Forecast, by Product Type , 2015-2030
Figure 143:Oceania Agave Nectar Market Incremental $ Opportunity, by Product Type , 2020-2030
Figure 144:Oceania Agave Nectar Market Attractiveness Index, by Product Type , 2020-2030
Figure 145:Oceania Agave Nectar Market Value Y-o-Y Growth and Forecast, by Form , 2015-2030
Figure 146:Oceania Agave Nectar Market Incremental $ Opportunity, by Form , 2020-2030
Figure 147:Oceania Agave Nectar Market Attractiveness Index, by Form , 2020-2030
Figure 148:Oceania Agave Nectar Market Value Y-o-Y Growth and Forecast, by Nature , 2015-2030
Figure 149:Oceania Agave Nectar Market Incremental $ Opportunity, by Nature , 2020-2030
Figure 150:Oceania Agave Nectar Market Attractiveness Index, by Nature , 2020-2030
Figure 151:Oceania Agave Nectar Market Value Y-o-Y Growth and Forecast, by Flavour , 2015-2030
Figure 152:Oceania Agave Nectar Market Incremental $ Opportunity, by Flavour , 2020-2030
Figure 153:Oceania Agave Nectar Market Attractiveness Index, by Flavour , 2020-2030
Figure 154:Oceania Agave Nectar Market Value Y-o-Y Growth and Forecast, by Price Range , 2015-2030
Figure 155:Oceania Agave Nectar Market Incremental $ Opportunity, by Price Range , 2020-2030
Figure 156:Oceania Agave Nectar Market Attractiveness Index, by Price Range , 2020-2030
Figure 157:Oceania Agave Nectar Market Value Y-o-Y Growth and Forecast, by Source , 2015-2030
Figure 158:Oceania Agave Nectar Market Incremental $ Opportunity, by Source , 2020-2030
Figure 159:Oceania Agave Nectar Market Attractiveness Index, by Source , 2020-2030
Figure 160:Oceania Agave Nectar Market Value Y-o-Y Growth and Forecast, by Distribution Channel , 2015-2030
Figure 161:Oceania Agave Nectar Market Incremental $ Opportunity, by Distribution Channel , 2020-2030
Figure 162:Oceania Agave Nectar Market Attractiveness Index, by Distribution Channel , 2020-2030
Figure 163:MEA Agave Nectar Market Value Y-o-Y Growth and Forecast, 2015-2030
Figure 164:MEA Agave Nectar Market Incremental $ Opportunity, 2020-2030
Figure 165:MEA Agave Nectar Market Incremental Volume (MT), 2020-2030
Figure 166:MEA Agave Nectar Market Value Y-o-Y Growth and Forecast, by Country, 2015-2030
Figure 167:MEA Agave Nectar Market Incremental $ Opportunity, by Country, 2020-2030
Figure 168:MEA Agave Nectar Market Attractiveness Index, by Country, 2020-2030
Figure 169:MEA Agave Nectar Market Value Y-o-Y Growth and Forecast, by Product Type , 2015-2030
Figure 170:MEA Agave Nectar Market Incremental $ Opportunity, by Product Type , 2020-2030
Figure 171:MEA Agave Nectar Market Attractiveness Index, by Product Type , 2020-2030
Figure 172:MEA Agave Nectar Market Value Y-o-Y Growth and Forecast, by Form , 2015-2030
Figure 173:MEA Agave Nectar Market Incremental $ Opportunity, by Form , 2020-2030
Figure 174:MEA Agave Nectar Market Attractiveness Index, by Form , 2020-2030
Figure 175:MEA Agave Nectar Market Value Y-o-Y Growth and Forecast, by Nature , 2015-2030
Figure 176:MEA Agave Nectar Market Incremental $ Opportunity, by Nature , 2020-2030
Figure 177:MEA Agave Nectar Market Attractiveness Index, by Nature , 2020-2030
Figure 178:MEA Agave Nectar Market Value Y-o-Y Growth and Forecast, by Flavour , 2015-2030
Figure 179:MEA Agave Nectar Market Incremental $ Opportunity, by Flavour , 2020-2030
Figure 180:MEA Agave Nectar Market Attractiveness Index, by Flavour , 2020-2030
Figure 181:MEA Agave Nectar Market Value Y-o-Y Growth and Forecast, by Price Range , 2015-2030
Figure 182:MEA Agave Nectar Market Incremental $ Opportunity, by Price Range , 2020-2030
Figure 183:MEA Agave Nectar Market Attractiveness Index, by Price Range , 2020-2030
Figure 184:MEA Agave Nectar Market Value Y-o-Y Growth and Forecast, by Source , 2015-2030
Figure 185:MEA Agave Nectar Market Incremental $ Opportunity, by Source , 2020-2030
Figure 186:MEA Agave Nectar Market Attractiveness Index, by Source , 2020-2030
Figure 187:MEA Agave Nectar Market Value Y-o-Y Growth and Forecast, by Distribution Channel , 2015-2030
Figure 188:MEA Agave Nectar Market Incremental $ Opportunity, by Distribution Channel , 2020-2030
Figure 189:MEA Agave Nectar Market Attractiveness Index, by Distribution Channel , 2020-2030
Figure 190:Japan Agave Nectar Market Value Y-o-Y Growth and Forecast, 2015-2030
Figure 191:Japan Agave Nectar Market Incremental $ Opportunity, 2020-2030
Figure 192:Japan Agave Nectar Market Incremental Volume (MT), 2020-2030
Figure 193:Japan Agave Nectar Market Value Y-o-Y Growth and Forecast, by Country, 2015-2030
Figure 194:Japan Agave Nectar Market Incremental $ Opportunity, by Country, 2020-2030
Figure 195:Japan Agave Nectar Market Attractiveness Index, by Country, 2020-2030
Figure 196:Japan Agave Nectar Market Value Y-o-Y Growth and Forecast, by Product Type , 2015-2030
Figure 197:Japan Agave Nectar Market Incremental $ Opportunity, by Product Type , 2020-2030
Figure 198:Japan Agave Nectar Market Attractiveness Index, by Product Type , 2020-2030
Figure 199:Japan Agave Nectar Market Value Y-o-Y Growth and Forecast, by Form , 2015-2030
Figure 200:Japan Agave Nectar Market Incremental $ Opportunity, by Form , 2020-2030
Figure 201:Japan Agave Nectar Market Attractiveness Index, by Form , 2020-2030
Figure 202:Japan Agave Nectar Market Value Y-o-Y Growth and Forecast, by Nature , 2015-2030
Figure 203:Japan Agave Nectar Market Incremental $ Opportunity, by Nature , 2020-2030
Figure 204:Japan Agave Nectar Market Attractiveness Index, by Nature , 2020-2030
Figure 205:Japan Agave Nectar Market Value Y-o-Y Growth and Forecast, by Flavor , 2015-2030
Figure 206:Japan Agave Nectar Market Incremental $ Opportunity, by Flavor , 2020-2030
Figure 207:Japan Agave Nectar Market Attractiveness Index, by Flavor , 2020-2030
Figure 208:Japan Agave Nectar Market Value Y-o-Y Growth and Forecast, by Price Range , 2015-2030
Figure 209:Japan Agave Nectar Market Incremental $ Opportunity, by Price Range , 2020-2030
Figure 210:Japan Agave Nectar Market Attractiveness Index, by Price Range , 2020-2030
Figure 211:Japan Agave Nectar Market Value Y-o-Y Growth and Forecast, by Source , 2015-2030
Figure 212:Japan Agave Nectar Market Incremental $ Opportunity, by Source , 2020-2030
Figure 213:Japan Agave Nectar Market Attractiveness Index, by Source , 2020-2030
Figure 214:Japan Agave Nectar Market Value Y-o-Y Growth and Forecast, by Distribution Channel , 2015-2030
Figure 215:Japan Agave Nectar Market Incremental $ Opportunity, by Distribution Channel , 2020-2030
Figure 216:Japan Agave Nectar Market Attractiveness Index, by Distribution Channel , 2020-2030
Copyright © Transparency Market Research, Inc. All Rights reserved
Trust Online

Agave Nectar Market