
Reports
Reports
The global market for aerial imaging has been witnessing a substantial growth over the past few years, thanks to the increased adoption of advanced drone/unmanned aerial vehicle (UAV) in the defense and various other industries. The growing footprint of aerial imaging solutions across various applications, such as cartography, construction and development, defense and security, and intelligence surveillance, is another important factor, bolstering the growth of this market.
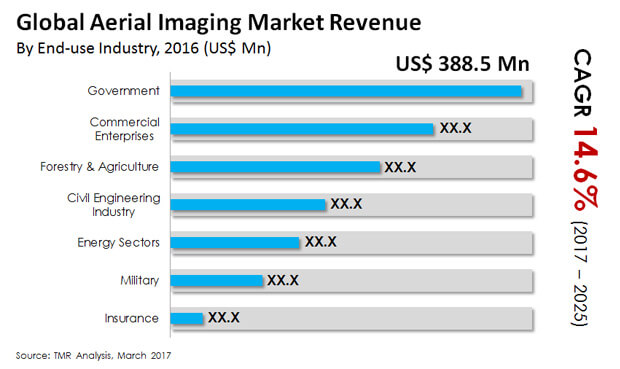
The worldwide aerial imaging market stood at US$1.36 bn in 2016 and is anticipated to register a CAGR of 14.6% from 2017 to 2025, reaching a value of US$4.58 bn by the end of 2025. The rising popularity of location-based services and various technological developments in the field of advanced aerial camera systems and drone technology are expected to propel this market substantially over the forthcoming years.
Aerial imaging finds a widespread application in energy, natural resources management, geospatial technology, construction and development, defense and intelligence, disaster response management, conservation and research, and media and entertainment. Geospatial technology has been reporting a greater application of aerial imaging. In 2016, it emerged as the leading application area of aerial imaging with a share of 21.5% in terms of revenue contribution.
The defense and security sector also has always been a prominent consumer of aerial imagery and geospatial data. The usage of aerial imagery in this sector has now increased significantly due to the high level of awareness among consumers and the availability of high-resolution aerial imagery from numerous suppliers. The construction and development, geospatial technology, and natural resource management are likely to surface as promising applications areas of aerial imaging over the next few years.
The global market for aerial imaging boasts of an extensive presence across North America, the Middle East and Africa, Europe, Asia Pacific, and South America. With US$575.9 bn in revenues, North America dominated the overall market in 2016. Thanks to the rise in the agriculture and forestry industry, this regional is likely to remain leading over the years to come. Since aerial photography helps farmers to identify their crops and take decisions regarding whether or not to increase the water supply to the crops, its application in farming has increased, reflecting greatly on the overall market.
The Europe market for aerial imaging stood second in 2016 and is anticipated to continue in this position in the near future. The growing usage of aerial imagery for monitoring the aquatic vegetation, increasing developments in imagery Intelligence solutions, and the rising number of organizations in Europe involved in collection of aerial photography are stimulating this regional market.
The Asia Pacific Aerial Imaging market is being driven by the escalating usage of aerial images for ground water mapping purposes while the increasing application of aerial imagery in the tourism industry is boosting the Middle East and Africa market. The South America market is likely to gain from the steady growth of the agricultural and the industrial sectors in the years to come.
NRC Group ASA, Fugro N.V., Digital Aerial Solutions LLC, Nearmap Ltd., Google Inc., EagleView Technologies, Inc., Cooper Aerial Surveys Co., Landiscor Real Estate Mapping, GeoVantage Inc., and Kucera International Inc. are the most prominent players in the global aerial imaging market.
Increase in Research and Development Activities to Boost Growth of Aerial Imaging Market
The extensive adoption of unmanned aerial vehicles (UAV) or drones for defense and commercial activities may bring tremendous growth opportunities for the aerial imaging market through the forecast period of 2017-2025. The utilization of aerial imaging across a large number of applications such as defense, security, cartography, construction, surveillance, and others may bring promising growth for the aerial imaging market during the assessment period of 2017-2025.
Aerial imaging market to reach a value of US$4.58 bn by the end of 2025
Aerial imaging market is anticipated to register a CAGR of 14.6% from 2017 to 2025
Aerial imaging market to be driven by rising popularity of location-based services and various technological developments in the field of advanced aerial camera systems and drone technology
The end-use segments in aerial imaging market are Government, Commercial Enterprises, Civil Engineering Industry, Military, Forestry and Agriculture, Energy Sector, Insurance
Key players in the global aerial imaging market are NRC Group ASA, Google Inc., High Eye Aerial Imaging Inc., Fugro N.V., EagleView Technologies Inc., and ARC Aerial Imaging Limited.
1. Preface
1.1. Market Definition and Scope
1.2. Market Segmentation
1.3. Key Research Objectives
1.4. Research Highlights
2. Assumptions and Research Methodology
3. Executive Summary : Global Aerial Imaging Market
4. Market Overview
4.1. Market Dynamics
4.1.1. Drivers
4.1.2. Restraints
4.1.3. Opportunity
4.2. Key Market Trends
5. Global Aerial Imaging Market Analysis and Forecasts, By End-use Industry
5.1. Introduction & Definition
5.2. Market Size (US$ Mn) Forecast, By End-use Industry
5.2.1. Government, 2015 – 2025 (US$ Mn)
5.2.2. Commercial Enterprises, 2015 – 2025 (US$ Mn)
5.2.3. Civil Engineering Industry, 2015 – 2025 (US$ Mn)
5.2.4. Military, 2015 – 2025 (US$ Mn)
5.2.5. Forestry and Agriculture, 2015 – 2025 (US$ Mn)
5.2.6. Energy Sector, 2015 – 2025 (US$ Mn)
5.2.7. Insurance, 2015 – 2025 (US$ Mn)
6. Global Aerial Imaging Market Analysis and Forecasts, By Application
6.1. Introduction & Definition
6.2. Market Size (US$ Mn) Forecast, By Application
6.2.1. Energy, 2015 – 2025 (US$ Mn)
6.2.2. Geospatial Technology, 2015 – 2025 (US$ Mn)
6.2.3. Natural Resources Management, 2015 – 2025 (US$ Mn)
6.2.4. Construction & Development, 2015 – 2025 (US$ Mn)
6.2.5. Disaster Response Management, 2015 – 2025 (US$ Mn)
6.2.6. Defense & Intelligence, 2015 – 2025 (US$ Mn)
6.2.7. Conservation & Research, 2015 – 2025 (US$ Mn)
6.2.8. Media & Entertainment, 2015 – 2025 (US$ Mn)
7. Global Aerial Imaging Market Analysis and Forecasts, By Region
7.1. Key Findings
7.2. Market Size (US$ Mn) Forecast By Region
7.2.1. North America
7.2.2. Europe
7.2.3. Asia Pacific
7.2.4. Middle East and Africa
7.2.5. South America
8. North America Aerial Imaging Market Analysis and Forecast
8.1. Key Trends
8.2. Market Size (US$ Mn) Forecast, By End-use Industry
8.2.1. Government, 2015 – 2025 (US$ Mn)
8.2.2. Commercial Enterprises, 2015 – 2025 (US$ Mn)
8.2.3. Civil Engineering Industry, 2015 – 2025 (US$ Mn)
8.2.4. Military, 2015 – 2025 (US$ Mn)
8.2.5. Forestry and Agriculture, 2015 – 2025 (US$ Mn)
8.2.6. Energy Sector, 2015 – 2025 (US$ Mn)
8.2.7. Insurance, 2015 – 2025 (US$ Mn)
8.3. Market Size (US$ Mn) Forecast, By Application
8.3.1. Energy, 2015 – 2025 (US$ Mn)
8.3.2. Geospatial Technology, 2015 – 2025 (US$ Mn)
8.3.3. Natural Resources Management, 2015 – 2025 (US$ Mn)
8.3.4. Construction & Development, 2015 – 2025 (US$ Mn)
8.3.5. Disaster Response Management, 2015 – 2025 (US$ Mn)
8.3.6. Defense & Intelligence, 2015 – 2025 (US$ Mn)
8.3.7. Conservation & Research, 2015 – 2025 (US$ Mn)
8.3.8. Media & Entertainment, 2015 – 2025 (US$ Mn)
8.4. Market Size (US$ Mn) Forecast, By Country
8.4.1. The U.S., 2015 – 2025 (US$ Mn)
8.4.2. Canada, 2015 – 2025 (US$ Mn)
8.4.3. Rest of North America, 2015 – 2025 (US$ Mn)
9. Europe Aerial Imaging Market Analysis and Forecast
9.1. Key Trends
9.2. Market Size (US$ Mn) Forecast, By End-use Industry
9.2.1. Government, 2015 – 2025 (US$ Mn)
9.2.2. Commercial Enterprises, 2015 – 2025 (US$ Mn)
9.2.3. Civil Engineering Industry, 2015 – 2025 (US$ Mn)
9.2.4. Military, 2015 – 2025 (US$ Mn)
9.2.5. Forestry and Agriculture, 2015 – 2025 (US$ Mn)
9.2.6. Energy Sector, 2015 – 2025 (US$ Mn)
9.2.7. Insurance, 2015 – 2025 (US$ Mn)
9.3. Market Size (US$ Mn) Forecast, By Application
9.3.1. Energy, 2015 – 2025 (US$ Mn)
9.3.2. Geospatial Technology, 2015 – 2025 (US$ Mn)
9.3.3. Natural Resources Management, 2015 – 2025 (US$ Mn)
9.3.4. Construction & Development, 2015 – 2025 (US$ Mn)
9.3.5. Disaster Response Management, 2015 – 2025 (US$ Mn)
9.3.6. Defense & Intelligence, 2015 – 2025 (US$ Mn)
9.3.7. Conservation & Research, 2015 – 2025 (US$ Mn)
9.3.8. Media & Entertainment, 2015 – 2025 (US$ Mn)
9.4. Market Size (US$ Mn) Forecast, By Country
9.4.1. The U.K., 2015 – 2025 (US$ Mn)
9.4.2. Germany, 2015 – 2025 (US$ Mn)
9.4.3. France, 2015 – 2025 (US$ Mn)
9.4.4. Spain, 2015 – 2025 (US$ Mn)
9.4.5. Italy, 2015 – 2025 (US$ Mn)
9.4.6. Rest of Europe, 2015 – 2025 (US$ Mn)
10. Asia Pacific Aerial Imaging Analysis and Forecast
10.1. Key Trends
10.2. Market Size (US$ Mn) Forecast, By End-use Industry
10.2.1. Government, 2015 – 2025 (US$ Mn)
10.2.2. Commercial Enterprises, 2015 – 2025 (US$ Mn)
10.2.3. Civil Engineering Industry, 2015 – 2025 (US$ Mn)
10.2.4. Military, 2015 – 2025 (US$ Mn)
10.2.5. Forestry and Agriculture, 2015 – 2025 (US$ Mn)
10.2.6. Energy Sector, 2015 – 2025 (US$ Mn)
10.2.7. Insurance, 2015 – 2025 (US$ Mn)
10.3. Market Size (US$ Mn) Forecast, By Application
10.3.1. Energy, 2015 – 2025 (US$ Mn)
10.3.2. Geospatial Technology, 2015 – 2025 (US$ Mn)
10.3.3. Natural Resources Management, 2015 – 2025 (US$ Mn)
10.3.4. Construction & Development, 2015 – 2025 (US$ Mn)
10.3.5. Disaster Response Management, 2015 – 2025 (US$ Mn)
10.3.6. Defense & Intelligence, 2015 – 2025 (US$ Mn)
10.3.7. Conservation & Research, 2015 – 2025 (US$ Mn)
10.3.8. Media & Entertainment, 2015 – 2025 (US$ Mn)
10.4. Market Size (US$ Mn) Forecast, By Country
10.4.1. China, 2015 – 2025 (US$ Mn)
10.4.2. Japan, 2015 – 2025 (US$ Mn)
10.4.3. India, 2015 – 2025 (US$ Mn)
10.4.4. Indonesia, 2015 – 2025 (US$ Mn)
10.4.5. Australasia, 2015 – 2025 (US$ Mn)
10.4.6. Rest of Asia Pacific, 2015 – 2025 (US$ Mn)
11. Middle East and Africa Aerial Imaging Market Analysis and Forecast
11.1. Key Trends
11.2. Market Size (US$ Mn) Forecast, By End-use Industry
11.2.1. Government, 2015 – 2025 (US$ Mn)
11.2.2. Commercial Enterprises, 2015 – 2025 (US$ Mn)
11.2.3. Civil Engineering Industry, 2015 – 2025 (US$ Mn)
11.2.4. Military, 2015 – 2025 (US$ Mn)
11.2.5. Forestry and Agriculture, 2015 – 2025 (US$ Mn)
11.2.6. Energy Sector, 2015 – 2025 (US$ Mn)
11.2.7. Insurance, 2015 – 2025 (US$ Mn)
11.3. Market Size (US$ Mn) Forecast, By Application
11.3.1. Energy, 2015 – 2025 (US$ Mn)
11.3.2. Geospatial Technology, 2015 – 2025 (US$ Mn)
11.3.3. Natural Resources Management, 2015 – 2025 (US$ Mn)
11.3.4. Construction & Development, 2015 – 2025 (US$ Mn)
11.3.5. Disaster Response Management, 2015 – 2025 (US$ Mn)
11.3.6. Defense & Intelligence, 2015 – 2025 (US$ Mn)
11.3.7. Conservation & Research, 2015 – 2025 (US$ Mn)
11.3.8. Media & Entertainment, 2015 – 2025 (US$ Mn)
11.4. Market Size (US$ Mn) Forecast, By Country
11.4.1. UAE, 2015 – 2025 (US$ Mn)
11.4.2. Saudi Arabia, 2015 – 2025 (US$ Mn)
11.4.3. South Africa, 2015 – 2025 (US$ Mn)
11.4.4. Rest of Middle East and Africa, 2015 – 2025 (US$ Mn)
12. South America Aerial Imaging Market Analysis and Forecast
12.1. Key Trends
12.2. Market Size (US$ Mn) Forecast, By End-use Industry
12.2.1. Government, 2015 – 2025 (US$ Mn)
12.2.2. Commercial Enterprises, 2015 – 2025 (US$ Mn)
12.2.3. Civil Engineering Industry, 2015 – 2025 (US$ Mn)
12.2.4. Military, 2015 – 2025 (US$ Mn)
12.2.5. Forestry and Agriculture, 2015 – 2025 (US$ Mn)
12.2.6. Energy Sector, 2015 – 2025 (US$ Mn)
12.2.7. Insurance, 2015 – 2025 (US$ Mn)
12.3. Market Size (US$ Mn) Forecast, By Application
12.3.1. Energy, 2015 – 2025 (US$ Mn)
12.3.2. Geospatial Technology, 2015 – 2025 (US$ Mn)
12.3.3. Natural Resources Management, 2015 – 2025 (US$ Mn)
12.3.4. Construction & Development, 2015 – 2025 (US$ Mn)
12.3.5. Disaster Response Management, 2015 – 2025 (US$ Mn)
12.3.6. Defense & Intelligence, 2015 – 2025 (US$ Mn)
12.3.7. Conservation & Research, 2015 – 2025 (US$ Mn)
12.3.8. Media & Entertainment, 2015 – 2025 (US$ Mn)
12.4. Market Size (US$ Mn) Forecast, By Country
12.4.1. Brazil, 2015 – 2025 (US$ Mn)
12.4.2. Rest of South America, 2015 – 2025 (US$ Mn)
13. Competition Landscape
13.1. Market Share Analysis By Company (2016)
13.2. Company Profiles (Details – Overview, Financials, SWOT Analysis, Recent Developments, Strategy)
13.1.1. NRC Group ASA
13.1.1.1. Company Details
13.1.1.2. Company Description
13.1.1.3. Business Overview
13.1.1.4. Financial Overview
13.1.1.5. Regional Share
13.1.1.6. Strategic Overview
13.1.1.7. SWOT Analysis
13.1.2. Fugro N.V.
13.1.2.1. Company Details
13.1.2.2. Company Description
13.1.2.3. Business Overview
13.1.2.4. Financial Overview
13.1.2.5. Regional Share
13.1.2.6. Strategic Overview
13.1.2.7. SWOT Analysis
13.1.3. Digital Aerial Solutions, LLC
13.1.3.1. Company Details
13.1.3.2. Company Description
13.1.3.3. Business Overview
13.1.3.4. Financial Overview
13.1.3.5. Regional Share
13.1.3.6. Strategic Overview
13.1.3.7. SWOT Analysis
13.1.4. Nearmap Ltd.
13.1.4.1. Company Details
13.1.4.2. Company Description
13.1.4.3. Business Overview
13.1.4.4. Financial Overview
13.1.4.5. Regional Share
13.1.4.6. Strategic Overview
13.1.4.7. SWOT Analysis
13.1.5. Google, Inc.
13.1.5.1. Company Details
13.1.5.2. Company Description
13.1.5.3. Business Overview
13.1.5.4. Financial Overview
13.1.5.5. Regional Share
13.1.5.6. Strategic Overview
13.1.5.7. SWOT Analysis
13.1.6. EagleView Technologies, Inc.
13.1.6.1. Company Details
13.1.6.2. Company Description
13.1.6.3. Business Overview
13.1.6.4. Financial Overview
13.1.6.5. Regional Share
13.1.6.6. Strategic Overview
13.1.6.7. SWOT Analysis
13.1.7. Cooper Aerial Surveys Co.
13.1.7.1. Company Details
13.1.7.2. Company Description
13.1.7.3. Business Overview
13.1.7.4. Financial Overview
13.1.7.5. Regional Share
13.1.7.6. Strategic Overview
13.1.7.7. SWOT Analysis
13.1.8. Landiscor Real Estate Mapping
13.1.8.1. Company Details
13.1.8.2. Company Description
13.1.8.3. Business Overview
13.1.8.4. Financial Overview
13.1.8.5. Regional Share
13.1.8.6. Strategic Overview
13.1.8.7. SWOT Analysis
13.1.9. GeoVantage, Inc.
13.1.9.1. Company Details
13.1.9.2. Company Description
13.1.9.3. Business Overview
13.1.9.4. Financial Overview
13.1.9.5. Regional Share
13.1.9.6. Strategic Overview
13.1.9.7. SWOT Analysis
13.1.10. Kucera International, Inc.
13.1.10.1. Company Details
13.1.10.2. Company Description
13.1.10.3. Business Overview
13.1.10.4. Financial Overview
13.1.10.5. Regional Share
13.1.10.6. Strategic Overview
13.1.10.7. SWOT Analysis
14. Key Take Away
List of Tables
Table 01 Global Aerial Imaging Market Size (US$ Mn) Forecast, By End-use Industry, 2015–2025
Table 02 Global Aerial Imaging Market Size (US$ Mn) Forecast, By End-use Industry, 2015–2025
Table 03 Europe Aerial Imaging Market Size (US$ Mn) Forecast, By Application, 2015–2025
Table 04 Europe Aerial Imaging Market Size (US$ Mn) Forecast, By Application, 2015–2025
Table 05 Global Aerial Imaging Market Size (US$ Mn) Forecast, By Region, 2015–2025
Table 06 North America Aerial Imaging Market Size (US$ Mn) Forecast, By End-use Industry, 2015–2025
Table 07 North America Aerial Imaging Market Size (US$ Mn) Forecast, By End-use Industry, 2015–2025
Table 08 North America Aerial Imaging Market Size (US$ Mn) Forecast, By Application, 2015–2025
Table 09 North America Aerial Imaging Market Size (US$ Mn) Forecast, By Application, 2015–2025
Table 10 North America Aerial Imaging Market Size (US$ Mn) Forecast, By Country/Region, 2015–2025
Table 11 Europe Aerial Imaging Market Size (US$ Mn) Forecast, By End-use Industry, 2015–2025
Table 12 Europe Aerial Imaging Market Size (US$ Mn) Forecast, By End-use Industry, 2015–2025
Table 13 Europe Aerial Imaging Market Size (US$ Mn) Forecast, By Application, 2015–2025
Table 14 Europe Aerial Imaging Market Size (US$ Mn) Forecast, By Application, 2015–2025
Table 15 Europe Aerial Imaging Market Size (US$ Mn) Forecast, By Country/Region, 2015–2025
Table 16 Europe Aerial Imaging Market Size (US$ Mn) Forecast, By Country/Region, 2015–2025
Table 17 Asia Pacific Aerial Imaging Market Size (US$ Mn) Forecast, By End-use Industry, 2015–2025
Table 18 Asia Pacific Aerial Imaging Market Size (US$ Mn) Forecast, By End-use Industry, 2015–2025
Table 19 Asia Pacific Aerial Imaging Market Size (US$ Mn) Forecast, By Application, 2015–2025
Table 20 Asia Pacific Aerial Imaging Market Size (US$ Mn) Forecast, By Application, 2015–2025
Table 21 Asia Pacific Aerial Imaging Market Size (US$ Mn) Forecast, By Country/Region, 2015–2025
Table 22 Asia Pacific Aerial Imaging Market Size (US$ Mn) Forecast, By Country/Region, 2015–2025
Table 23 Middle East and Africa Aerial Imaging Market Size (US$ Mn) Forecast, By End-use Industry, 2015–2025
Table 24 Middle East and Africa Aerial Imaging Market Size (US$ Mn) Forecast, By End-use Industry, 2015–2025
Table 25 Middle East & Africa Aerial Imaging Market Size (US$ Mn) Forecast, By Application, 2015–2025
Table 26 Middle East & Africa Aerial Imaging Market Size (US$ Mn) Forecast, By Application, 2015–2025
Table 27 Middle East and Africa Aerial Imaging Market Size (US$ Mn) Forecast, By Country/Region, 2015–2025
Table 28 South America Aerial Imaging Market Size (US$ Mn) Forecast, By End-use Industry, 2015–2025
Table 29 South America Aerial Imaging Market Size (US$ Mn) Forecast, By End-use Industry, 2015–2025
Table 30 South America Aerial Imaging Market Size (US$ Mn) Forecast, By Application, 2015–2025
Table 31 South America Aerial Imaging Market Size (US$ Mn) Forecast, By Application, 2015–2025
Table 32 South America Aerial Imaging Market Size (US$ Mn) Forecast, By Country/Region, 2015–2025
List of Figures
Figure 01 Global Aerial Imaging Market Revenue Share Analysis, By End-use Industry, 2016 and 2025
Figure 02 Global Aerial Imaging Market Revenue Share Analysis, By Application, 2016 and 2025
Figure 03 North America Aerial Imaging Market Size (US$ Mn) Forecast, 2015–2025
Figure 04 North America Aerial Imaging Market Size Y-o-Y Growth Projections, 2016–2025
Figure 05 North America Aerial Imaging Market Revenue Share Analysis, By End-use Industry, 2016 and 2025
Figure 06 North America Aerial Imaging Market Revenue Share Analysis, By Application, 2016 and 2025
Figure 06 North America Aerial Imaging Market Revenue Share Analysis, By Country/Region, 2016 and 2025
Figure 07 Europe Aerial Imaging Market Size (US$ Mn) Forecast, 2015–2025
Figure 08 Europe Aerial Imaging Market Size Y-o-Y Growth Projections, 2016–2025
Figure 09 Europe Aerial Imaging Market Revenue Share Analysis, By End-use Industry, 2016 and 2025
Figure 10 Europe Aerial Imaging Market Revenue Share Analysis, By Application, 2016 and 2025
Figure 11 Europe Aerial Imaging Market Revenue Share Analysis, By Country/Region, 2016 and 2025
Figure 12 Asia Pacific Aerial Imaging Market Size (US$ Mn) Forecast, 2015–2025
Figure 13 Asia Pacific Aerial Imaging Market Size Y-o-Y Growth Projections, 2016–2025
Figure 14 Asia Pacific Aerial Imaging Market Revenue Share Analysis, By End-use Industry, 2016 and 2025
Figure 15 Asia Pacific Aerial Imaging Market Revenue Share Analysis, By Application, 2016 and 2025
Figure 16 Asia Pacific Aerial Imaging Market Revenue Share Analysis, By Country/Region, 2016 and 2025
Figure 17 Middle East and Africa Aerial Imaging Market Size (US$ Mn) Forecast, 2015–2025
Figure 18 Middle East and Africa Aerial Imaging Market Size Y-o-Y Growth Projections, 2016–2025
Figure 19 Middle East and Africa Aerial Imaging Market Revenue Share Analysis, By End-use Industry, 2016 and 2025
Figure 20 Middle East & Africa Aerial Imaging Market Revenue Share Analysis, By Application, 2016 and 2025
Figure 21 Middle East and Africa Aerial Imaging Market Revenue Share Analysis, By Country/Region, 2016 and 2025
Figure 22 South America Aerial Imaging Market Size (US$ Mn) Forecast, 2015–2025
Figure 23 South America Aerial Imaging Market Size Y-o-Y Growth Projections, 2016–2025
Figure 24 South America Aerial Imaging Market Revenue Share Analysis, By End-use Industry, 2016 and 2025
Figure 25 South America Aerial Imaging Market Revenue Share Analysis, By Application, 2016 and 2025
Figure 26 South America Aerial Imaging Market Revenue Share Analysis, By Country/Region, 2016 and 2025
Figure 27 Aerial Imaging Market Share Analysis By Company (2016)
Copyright © Transparency Market Research, Inc. All Rights reserved
Trust Online

Aerial Imaging Market Growth Analysis Report 2017 - 2025