
Reports
Reports
Analysts’ Viewpoint on Disaster Recovery as a Service (DRaaS) Market Scenario
Increase in adoption of cloud services among industry verticals such as BFSI and IT & telecom has created the need for cost-effective and faster data recovery solutions such as DRaaS. Natural calamities, technical variations, and human errors result in loss of data, revenue, and employee productivity. Rise in regulatory compliance, advancements in IT infrastructure, cybersecurity issues, need for business continuity, improved RPO, and need for data protection as a service and backup facility are expected to drive the adoption of disaster as a service (DRaaS) among businesses in the near future. During the COVID-19 pandemic, most companies chose to work remotely as a safety precaution in affected countries across the globe. This has led to a rise in security breaches and cyberattack incidents, thereby driving the demand for DRaaS solutions.
In the past, businesses found it difficult to afford off-site disaster recovery solutions. As a result, end-user organizations were less likely to spend on a second (mirror) data center that is rarely used. Nowadays, technological innovations have overcome the issue with the emergence of disaster recovery as a service (DraaS), which helps in replicating and hosting servers on a third-party vendor site. Disaster recovery as a service (DRaaS) is a service model that allows an enterprise to back up data and IT infrastructure in a third-party cloud environment and prevent damage from natural disasters such as floods, wildfires, earthquakes; equipment failures, power outages & cyberattacks; and other operational disasters. The number of cybercrimes is increasing rapidly with the rising penetration of smartphones and the Internet of Things. This has led to a rise in demand for disaster recovery as a service (DRaaS) solutions to perform recovery tasks to secure data centers or servers owned and operated by an organization. Disaster recovery as a service (DRaaS) solution can be used to monitor disasters in business operations, secure backup, and achieve recovery point objective (RPO) and recovery time objective (RTO). Backup and disaster recovery appliances are gaining popularity in organizations in developing countries to protect their data. Organizations are regularly testing and updating DRaaS to protect operational data in a secure and safe manner to avoid losses and prevent downtime.
The security of companies with a data center can suffer due to various threats that have a significant impact on business continuity and IT infrastructure. Natural disasters such as earthquakes and floods; human threats that comprise network attacks, including ransomware attacks and unauthorized access to confidential information; and lastly, environmental interruptions such as long-term power failure and exposure to pollution or chemical substances interrupt data center operations. These interruptions are known as downtime, which operators are most concerned about in their day-to-day data center operations. Interruption or halt in operations can occur in any size of business, from small and medium enterprises (SMEs) to large enterprises and even MNCs. This downtime may cause data loss, loss of revenue, and loss of customers, which is expected to have a severe impact on the operations of enterprises.
Rise in usage of cost-effective backup and disaster recovery services, especially among SMEs, leads to reduced operational risks and continual business operations. Other benefits of DRaaS include scalability as per increasing/decreasing requirements; pay-per-use model; geographic redundancy, wherein departments can spread backed-up resources across multiple geographic regions and maximize their availability; and faster restoration of server/data. This is projected to smoothen business operations in any disaster condition and help reduce downtime.
Increase in adoption of operational recovery goals such as recovery point objective (RPO), which refers to the length of time taken by business operations to restore data; and recovery time objective (RTO), which refers to the amount of time between backups, plays an important role in reducing the downtime to restore business operations. According to Acronis’ Cyber Protection Week Global Report published in 2021, 76% of organizations experienced downtime and data loss issues in 2021 due to system crashes, human errors, and cyberattacks.
Increase in adoption of digital technologies across various industry verticals leads to risks associated with cybersecurity, which disrupts enterprise operations, and may have a severe impact on the business. This generates the need for data backup and disaster recovery solutions and services. Rise in cyberattacks as well as ransomware attacks generates the need to secure data centers by adopting hosted backup and disaster recovery-as-a-service (DRaaS) solutions to protect end-user systems, cloud applications, and enterprise infrastructure from cyber threats. Increase in number of data centers in the U.S., Canada, and Germany has attracted cybercriminals, leading to the risk of cyberattack incidents. This is expected to create significant demand for the adoption of data protection and recovery solutions among various end-users during the forecast period. According to Cloudscene, a total of 2,793 data centers are present in the U.S. alone. This leads to the risk of a large number of cyberattacks in the country.
North America held major share of the overall disaster recovery as a service (DRaaS) market, followed by Europe, in 2021. These two regions are expected to retain their positions throughout the forecast period due to the increase in digital transformation in BFSI, IT & telecom, government, and media & entertainment, telecommunication, among other sectors. Increase in demand for best disaster recovery as a service (DRaaS) solutions can be ascribed to the rise in risk of data loss and downtime leading to business losses. Rise in demand for DRaaS in North America and Europe can be ascribed to the growth in need to secure data and accelerate restoration in data centers, especially in the U.S. and U.K.
The Asia Pacific market is projected to grow at the fastest CAGR during the forecast period. China and India are the major disaster recovery service provider countries in Asia Pacific, offering vast scope for disaster recovery companies operating in the market. The popularity of DRaaS in Asia Pacific can be ascribed to the increase in natural calamities such as floods, earthquakes, and human errors, which in turn lead to data leaks. This is estimated to drive the DRaaS market in the region during the forecast period.
The disaster recovery as a service (DRaaS) market is highly fragmented, and vendors are looking for ways to successfully tap growth opportunities and strengthen their presence in the market. Disaster recovery as a service (DRaaS) providers are expanding their product portfolio and market reach through mergers and acquisitions, new product developments, and partnerships with leading players. The next few years are expected to offer scope for the establishment of disaster recovery as a service (DRaaS) in untapped markets. Many retailers and IT companies are focusing on adopting disaster recovery as a service (DRaaS) solutions to provide better customer experiences and unhindered access. Microsoft, IBM Corporation, VMware, Inc., Amazon Web Services, Inc., and iland are some of the leading companies profiled in the disaster recovery as a service (DRaaS) market research report.
Each of these players has been profiled in global disaster recovery as a service (DRaaS) market report based on parameters such as company overview, financial overview, business strategies, product portfolio, business segments, and recent developments.
|
Attribute |
Detail |
|
Market Size Value in 2021 |
US$ 7.07 Bn |
|
Market Forecast Value in 2031 |
US$ 47.06 Bn |
|
Growth Rate (CAGR) |
21.3% |
|
Forecast Period |
2022–2031 |
|
Historical Data Available for |
2017–2020 |
|
Quantitative Units |
US$ Bn for Value |
|
Market Analysis |
Includes cross-segment analysis at global as well as regional level. Furthermore, qualitative analysis includes drivers, restraints, opportunities, key trends, ecosystem analysis, and COVID-19 impact analysis. |
|
Competition Landscape |
|
|
Format |
Electronic (PDF) + Excel |
|
Market Segmentation |
|
|
Regions Covered |
|
|
Countries Covered |
|
|
Companies Profiled |
|
|
Customization Scope |
Available upon request |
|
Pricing |
Available upon request |
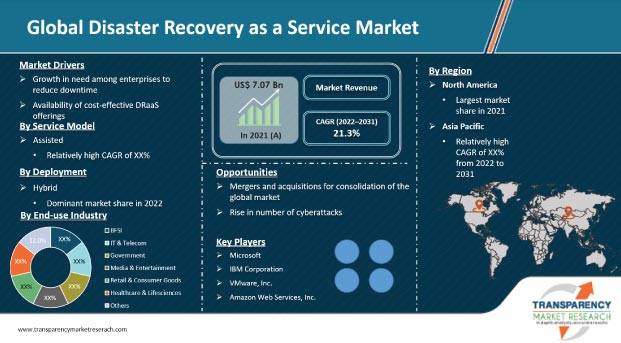
The disaster recovery as a service (DRaaS) market stood at US$ 7.07 Bn in 2021.
The disaster recovery as a service market is estimated to grow at a CAGR of 21.3% during the forecast period.
Growth in need among enterprises to reduce downtime and the availability of cost-effective DRaaS offerings.
The assisted segment is expected to account for the highest CAGR in the disaster recovery as a service market during the forecast period.
North America is a more attractive region for vendors in the disaster recovery as a service market.
Microsoft, IBM Corporation, VMware, Inc., Amazon Web Services, Inc., Acronis International GmbH, iland, Sungard Availability Services LP, Axcient, Unitrends, Infrascale, Inc., Cloudian, Nutanix, Carbonite, Inc., phoenixNAP, and Recovery Point Systems, Inc.
1. Preface
1.1. Market Introduction
1.2. Market Segmentation
1.3. Key Research Objectives
2. Assumptions and Research Methodology
2.1. Research Methodology
2.1.1. List of Primary and Secondary Sources
2.2. Key Assumptions for Data Modeling
3. Executive Summary: Global Disaster Recovery as a Service Market
4. Market Overview
4.1. Market Definition
4.2. Technology/Product Roadmap
4.3. Market Factor Analysis
4.3.1. Forecast Factors
4.3.2. Ecosystem/ Value Chain Analysis
4.3.3. Market Dynamics (Growth Influencers)
4.3.3.1. Drivers
4.3.3.2. Restraints
4.3.3.3. Opportunities
4.3.3.4. Impact Analysis of Drivers and Restraints
4.4. COVID-19 Impact Analysis
4.4.1. Impact of COVID-19 on Disaster Recovery as a Service Market
4.4.2. End-use Industry Sentiment Analysis: Comparative Analysis on Spending
4.4.2.1. Increase in Spending
4.4.2.2. Decrease in Spending
4.4.3. Short Term and Long Term Impact on the Market
4.5. Market Opportunity Assessment – by Region (North America/Europe/Asia Pacific/Middle East & Africa/South America)
4.5.1. By Service Model
4.5.2. By Deployment
4.5.3. By End-use Industry
5. Global Disaster Recovery as a Service Market Analysis and Forecast
5.1. Market Revenue Analysis (US$ Mn), 2016-2031
5.1.1. Historic Growth Trends, 2016-2021
5.1.2. Forecast Trends, 2022-2031
5.2. Pricing Model Analysis/Price Trend Analysis
6. Global Disaster Recovery as a Service Market Analysis, by Service Model
6.1. Overview and Definitions
6.2. Key Segment Analysis
6.3. Disaster Recovery as a Service Market Size (US$ Mn) Forecast, by Service Model, 2018 - 2031
6.3.1. Managed
6.3.2. Self-service
6.3.3. Assisted
7. Global Disaster Recovery as a Service Market Analysis, by Deployment
7.1. Overview and Definitions
7.2. Key Segment Analysis
7.3. Disaster Recovery as a Service Market Size (US$ Mn) Forecast, by Deployment, 2018 - 2031
7.3.1. Public Cloud
7.3.2. Private Cloud
7.3.3. Hybrid Cloud
8. Global Disaster Recovery as a Service Market Analysis, by End-use Industry
8.1. Overview and Definitions
8.2. Key Segment Analysis
8.3. Disaster Recovery as a Service Market Size (US$ Mn) Forecast, by End-use Industry, 2018 - 2031
8.3.1. BFSI
8.3.2. IT & Telecom
8.3.3. Government
8.3.4. Media & Entertainment
8.3.5. Retail & Consumer Goods
8.3.6. Government & Lifesciences
8.3.7. Others (Manufacturing, Energy & Utilities, and Transportation & Logistics)
9. Global Disaster Recovery as a Service Market Analysis and Forecasts, by Region
9.1. Key Findings
9.2. Market Size (US$ Mn) Forecast by Region, 2018-2031
9.2.1. North America
9.2.2. Europe
9.2.3. Asia Pacific
9.2.4. Middle East & Africa
9.2.5. South America
10. North America Disaster Recovery as a Service Market Analysis and Forecast
10.1. Regional Outlook
10.2. Disaster Recovery as a Service Market Size (US$ Mn) Analysis and Forecast, 2018 - 2031
10.2.1. By Service Model
10.2.2. By Deployment
10.2.3. By End-use Industry
10.3. Disaster Recovery as a Service Market Size (US$ Mn) Forecast, by Country, 2018 - 2031
10.3.1. U.S.
10.3.2. Canada
10.3.3. Mexico
11. Europe Disaster Recovery as a Service Market Analysis and Forecast
11.1. Regional Outlook
11.2. Disaster Recovery as a Service Market Size (US$ Mn) Analysis and Forecast, 2018 - 2031
11.2.1. By Service Model
11.2.2. By Deployment
11.2.3. By End-use Industry
11.3. Disaster Recovery as a Service Market Size (US$ Mn) Forecast, by Country & Sub-region, 2018 - 2031
11.3.1. Germany
11.3.2. UK
11.3.3. France
11.3.4. Italy
11.3.5. Spain
11.3.6. Rest of Europe
12. Asia Pacific Disaster Recovery as a Service Market Analysis and Forecast
12.1. Regional Outlook
12.2. Disaster Recovery as a Service Market Size (US$ Mn) Analysis and Forecast, 2018 - 2031
12.2.1. By Service Model
12.2.2. By Deployment
12.2.3. By End-use Industry
12.3. Disaster Recovery as a Service Market Size (US$ Mn) Forecast, by Country & Sub-region, 2018 - 2031
12.3.1. China
12.3.2. India
12.3.3. Japan
12.3.4. ASEAN
12.3.5. Rest of Asia Pacific
13. Middle East & Africa Disaster Recovery as a Service Market Analysis and Forecast
13.1. Regional Outlook
13.2. Disaster Recovery as a Service Market Size (US$ Mn) Analysis and Forecast, 2018 - 2031
13.2.1. By Service Model
13.2.2. By Deployment
13.2.3. By End-use Industry
13.3. Disaster Recovery as a Service Market Size (US$ Mn) Forecast, by Country & Sub-region, 2018 - 2031
13.3.1. Saudi Arabia
13.3.2. United Arab Emirates
13.3.3. South Africa
13.3.4. Rest of Middle East & Africa
14. South America Disaster Recovery as a Service Market Analysis and Forecast
14.1. Regional Outlook
14.2. Disaster Recovery as a Service Market Size (US$ Mn) Analysis and Forecast, 2018 - 2031
14.2.1. By Service Model
14.2.2. By Deployment
14.2.3. By End-use Industry
14.3. Disaster Recovery as a Service Market Size (US$ Mn) Forecast, by Country & Sub-region, 2018 - 2031
14.3.1. Brazil
14.3.2. Argentina
14.3.3. Rest of South America
15. Competition Landscape
15.1. Market Competition Matrix, by Leading Players
15.2. Market Revenue Share Analysis (%), by Leading Players (2021)
15.3. Competitive Scenario
15.3.1. List of Emerging, Prominent, and Leading Players
15.3.2. Major Mergers & Acquisitions, Expansions, Partnership, Contacts, Deals, etc.
16. Company Profiles
16.1. Microsoft
16.1.1. Business Overview
16.1.2. Company Revenue
16.1.3. Product Portfolio
16.1.4. Geographic Footprint
16.1.5. Strategic Partnership
16.1.6. Merger & Acquisition
16.1.7. Business Expansion
16.1.8. New Product Launch
16.1.9. Innovation, etc.
16.2. IBM Corporation
16.2.1. Business Overview
16.2.2. Company Revenue
16.2.3. Product Portfolio
16.2.4. Geographic Footprint
16.2.5. Strategic Partnership
16.2.6. Merger & Acquisition
16.2.7. Business Expansion
16.2.8. New Product Launch
16.2.9. Innovation, etc.
16.3. VMware, Inc.
16.3.1. Business Overview
16.3.2. Company Revenue
16.3.3. Product Portfolio
16.3.4. Geographic Footprint
16.3.5. Strategic Partnership
16.3.6. Merger & Acquisition
16.3.7. Business Expansion
16.3.8. New Product Launch
16.3.9. Innovation, etc.
16.4. Amazon Web Self-Service, Inc.
16.4.1. Business Overview
16.4.2. Company Revenue
16.4.3. Product Portfolio
16.4.4. Geographic Footprint
16.4.5. Strategic Partnership
16.4.6. Merger & Acquisition
16.4.7. Business Expansion
16.4.8. New Product Launch
16.4.9. Innovation, etc.
16.5. Acronis International GmbH
16.5.1. Business Overview
16.5.2. Company Revenue
16.5.3. Product Portfolio
16.5.4. Geographic Footprint
16.5.5. Strategic Partnership
16.5.6. Merger & Acquisition
16.5.7. Business Expansion
16.5.8. New Product Launch
16.5.9. Innovation, etc.
16.6. iland
16.6.1. Business Overview
16.6.2. Company Revenue
16.6.3. Product Portfolio
16.6.4. Geographic Footprint
16.6.5. Strategic Partnership
16.6.6. Merger & Acquisition
16.6.7. Business Expansion
16.6.8. New Product Launch
16.6.9. Innovation, etc.
16.7. Sungard Availability Self-Service LP
16.7.1. Business Overview
16.7.2. Company Revenue
16.7.3. Product Portfolio
16.7.4. Geographic Footprint
16.7.5. Strategic Partnership
16.7.6. Merger & Acquisition
16.7.7. Business Expansion
16.7.8. New Product Launch
16.7.9. Innovation, etc.
16.8. Axcient
16.8.1. Business Overview
16.8.2. Company Revenue
16.8.3. Product Portfolio
16.8.4. Geographic Footprint
16.8.5. Strategic Partnership
16.8.6. Merger & Acquisition
16.8.7. Business Expansion
16.8.8. New Product Launch
16.8.9. Innovation, etc.
16.9. Unitrends
16.9.1. Business Overview
16.9.2. Company Revenue
16.9.3. Product Portfolio
16.9.4. Geographic Footprint
16.9.5. Strategic Partnership
16.9.6. Merger & Acquisition
16.9.7. Business Expansion
16.9.8. New Product Launch
16.9.9. Innovation, etc.
16.10. Infrascale, Inc.
16.10.1. Business Overview
16.10.2. Company Revenue
16.10.3. Product Portfolio
16.10.4. Geographic Footprint
16.10.5. Strategic Partnership
16.10.6. Merger & Acquisition
16.10.7. Business Expansion
16.10.8. New Product Launch
16.10.9. Innovation, etc.
16.11. Cloudian
16.11.1. Business Overview
16.11.2. Company Revenue
16.11.3. Product Portfolio
16.11.4. Geographic Footprint
16.11.5. Strategic Partnership
16.11.6. Merger & Acquisition
16.11.7. Business Expansion
16.11.8. New Product Launch
16.11.9. Innovation, etc.
16.12. Nutanix
16.12.1. Business Overview
16.12.2. Company Revenue
16.12.3. Product Portfolio
16.12.4. Geographic Footprint
16.12.5. Strategic Partnership
16.12.6. Merger & Acquisition
16.12.7. Business Expansion
16.12.8. New Product Launch
16.12.9. Innovation, etc.
16.13. Carbonite, Inc.
16.13.1. Business Overview
16.13.2. Company Revenue
16.13.3. Product Portfolio
16.13.4. Geographic Footprint
16.13.5. Strategic Partnership
16.13.6. Merger & Acquisition
16.13.7. Business Expansion
16.13.8. New Product Launch
16.13.9. Innovation, etc.
16.14. phoenixNAP
16.14.1. Business Overview
16.14.2. Company Revenue
16.14.3. Product Portfolio
16.14.4. Geographic Footprint
16.14.5. Strategic Partnership
16.14.6. Merger & Acquisition
16.14.7. Business Expansion
16.14.8. New Product Launch
16.14.9. Innovation, etc.
16.15. Recovery Point Systems, Inc.
16.15.1. Business Overview
16.15.2. Company Revenue
16.15.3. Product Portfolio
16.15.4. Geographic Footprint
16.15.5. Strategic Partnership
16.15.6. Merger & Acquisition
16.15.7. Business Expansion
16.15.8. New Product Launch
16.15.9. Innovation, etc.
16.16. Others
16.16.1. Business Overview
16.16.2. Company Revenue
16.16.3. Product Portfolio
16.16.4. Geographic Footprint
16.16.5. Strategic Partnership
16.16.6. Merger & Acquisition
16.16.7. Business Expansion
16.16.8. New Product Launch
16.16.9. Innovation, etc.
17. Key Takeaways
List of Tables
Table 1: Acronyms Used in the Disaster Recovery as a Service Market
Table 2: North America Disaster Recovery as a Service Market Revenue Analysis, by Country, 2022 - 2031 (US$ Mn)
Table 3: Europe Disaster Recovery as a Service Market Revenue Analysis, by Country, 2022 - 2031 (US$ Mn)
Table 4: Asia Pacific Disaster Recovery as a Service Market Revenue Analysis, by Country, 2022 - 2031 (US$ Mn)
Table 5: Middle East & Africa Disaster Recovery as a Service Market Revenue Analysis, by Country, 2021 and 2031 (US$ Mn)
Table 6: South America Disaster Recovery as a Service Market Revenue Analysis, by Country, 2022 - 2031 (US$ Mn)
Table 7: Impact Analysis of Drivers & Restraints
Table 8: Global Disaster Recovery as a Service Market Value (US$ Mn) Forecast, by Service Model, 2018 – 2031
Table 9: Global Disaster Recovery as a Service Market Value (US$ Mn) Forecast, by Deployment, 2018 – 2031
Table 10: Global Disaster Recovery as a Service Market Value (US$ Mn) Forecast, by End-use Industry, 2018 – 2031
Table 11: Global Disaster Recovery as a Service Market Volume (US$ Mn) Forecast, by Region, 2018 – 2031
Table 12: North America Disaster Recovery as a Service Market Value (US$ Mn) Forecast, by Service Model, 2018 – 2031
Table 13: North America Disaster Recovery as a Service Market Value (US$ Mn) Forecast, by Deployment, 2018 – 2031
Table 14: North America Disaster Recovery as a Service Market Value (US$ Mn) Forecast, by End-use Industry, 2018 – 2031
Table 15: North America Disaster Recovery as a Service Market Value (US$ Mn) Forecast, by Country, 2018 - 2031
Table 16: U.S. Disaster Recovery as a Service Market Revenue CAGR Breakdown (%), by Growth Term
Table 17: Canada Disaster Recovery as a Service Market Revenue CAGR Breakdown (%), by Growth Term
Table 18: Mexico Disaster Recovery as a Service Market Revenue CAGR Breakdown (%), by Growth Term
Table 19: Europe Disaster Recovery as a Service Market Value (US$ Mn) Forecast, by Service Model, 2018 – 2031
Table 20: Europe Disaster Recovery as a Service Market Value (US$ Mn) Forecast, by Deployment, 2018 – 2031
Table 21: Europe Disaster Recovery as a Service Market Value (US$ Mn) Forecast, by End-use Industry, 2018 – 2031
Table 22: Europe Disaster Recovery as a Service Market Value (US$ Mn) Forecast, by Country, 2018 - 2031
Table 23: Germany Disaster Recovery as a Service Market Revenue CAGR Breakdown (%), by Growth Term
Table 24: U.K. Disaster Recovery as a Service Market Revenue CAGR Breakdown (%), by Growth Term
Table 25: France Disaster Recovery as a Service Market Revenue CAGR Breakdown (%), by Growth Term
Table 26: Spain Disaster Recovery as a Service Market Revenue CAGR Breakdown (%), by Growth Term
Table 27: Italy Disaster Recovery as a Service Market Revenue CAGR Breakdown (%), by Growth Term
Table 28: Asia Pacific Disaster Recovery as a Service Market Value (US$ Mn) Forecast, by Service Model, 2018 – 2031
Table 29: Asia Pacific Disaster Recovery as a Service Market Value (US$ Mn) Forecast, by Deployment, 2018 – 2031
Table 30: Asia Pacific Disaster Recovery as a Service Market Value (US$ Mn) Forecast, by End-use Industry, 2018 – 2031
Table 31: Asia Pacific Disaster Recovery as a Service Market Value (US$ Mn) Forecast, by Country, 2018 - 2031
Table 32: China Disaster Recovery as a Service Market Revenue CAGR Breakdown (%), by Growth Term
Table 33: India Disaster Recovery as a Service Market Revenue CAGR Breakdown (%), by Growth Term
Table 34: Japan Disaster Recovery as a Service Market Revenue CAGR Breakdown (%), by Growth Term
Table 35: ASEAN Disaster Recovery as a Service Market Revenue CAGR Breakdown (%), by Growth Term
Table 36: Middle East & Africa Disaster Recovery as a Service Market Value (US$ Mn) Forecast, by Service Model, 2018 – 2031
Table 37: Middle East & Africa Disaster Recovery as a Service Market Value (US$ Mn) Forecast, by Deployment, 2018 – 2031
Table 38: Middle East & Africa Disaster Recovery as a Service Market Value (US$ Mn) Forecast, by End-use Industry, 2018 – 2031
Table 39: Middle East & Africa Disaster Recovery as a Service Market Value (US$ Mn) Forecast, by Country, 2018 - 2031
Table 40: Saudi Arabia Disaster Recovery as a Service Market Revenue CAGR Breakdown (%), by Growth Term
Table 41: U.A.E. Disaster Recovery as a Service Market Revenue CAGR Breakdown (%), by Growth Term
Table 42: South Africa Disaster Recovery as a Service Market Revenue CAGR Breakdown (%), by Growth Term
Table 43: South America Disaster Recovery as a Service Market Value (US$ Mn) Forecast, by Service Model, 2018 – 2031
Table 44: South America Disaster Recovery as a Service Market Value (US$ Mn) Forecast, by Deployment, 2018 – 2031
Table 45: South America Disaster Recovery as a Service Market Value (US$ Mn) Forecast, by End-use Industry, 2018 – 2031
Table 46: South America Disaster Recovery as a Service Market Value (US$ Mn) Forecast, by Country, 2018 - 2031
Table 47: Brazil Disaster Recovery as a Service Market Revenue CAGR Breakdown (%), by Growth Term
Table 48: Argentina Disaster Recovery as a Service Market Revenue CAGR Breakdown (%), by Growth Term
Table 49: Mergers & Acquisitions, Expansions (1/4)
Table 50: Mergers & Acquisitions, Expansions (2/4)
Table 51: Mergers & Acquisitions, Expansions (3/4)
Table 52: Mergers & Acquisitions, Expansions (4/4)
List of Figures
Figure 1: Global Disaster Recovery as a Service Market Size (US$ Mn) Forecast, 2018–2031
Figure 2: Global Disaster Recovery as a Service Market Revenue (US$ Mn) Opportunity Assessment, by Region, 2021E
Figure 3: Top Segment Analysis of Disaster Recovery as a Service Market
Figure 4: Global Disaster Recovery as a Service Market Revenue (US$ Mn) Opportunity Assessment, by Region, 2031F
Figure 5: Global Disaster Recovery as a Service Market Attractiveness Assessment, by Service Model
Figure 6: Global Disaster Recovery as a Service Market Attractiveness Assessment, by Deployment
Figure 7: Global Disaster Recovery as a Service Market Attractiveness Assessment, by End-use Industry
Figure 8: Global Disaster Recovery as a Service Market Attractiveness Assessment, by Region
Figure 9: Global Disaster Recovery as a Service Market Revenue (US$ Mn) Historic Trends, 2016 - 2020
Figure 10: Global Disaster Recovery as a Service Market Revenue Opportunity (US$ Mn) Historic Trends, 2016 - 2020
Figure 11: Global Disaster Recovery as a Service Market Value Share Analysis, by Service Model, 2021
Figure 12: Global Disaster Recovery as a Service Market Value Share Analysis, by Service Model, 2031
Figure 13: Global Disaster Recovery as a Service Market Absolute Opportunity (US$ Mn), by Managed, 2022 – 2031
Figure 14: Global Disaster Recovery as a Service Market Absolute Opportunity (US$ Mn), by Self-Service, 2022 – 2031
Figure 15: Global Disaster Recovery as a Service Market Value Share Analysis, by Assisted, 2021
Figure 16: Global Disaster Recovery as a Service Market Value Share Analysis, by Deployment, 2031
Figure 17: Global Disaster Recovery as a Service Market Value Share Analysis, by Deployment, 2031
Figure 18: Global Disaster Recovery as a Service Market Absolute Opportunity (US$ Mn), by Public, 2022 – 2031
Figure 19: Global Disaster Recovery as a Service Market Absolute Opportunity (US$ Mn), by Private, 2022 – 2031
Figure 20: Global Disaster Recovery as a Service Market Absolute Opportunity (US$ Mn), by Hybrid, 2022 – 2031
Figure 21: Global Disaster Recovery as a Service Market Value Share Analysis, by End-use Industry, 2031
Figure 22: Global Disaster Recovery as a Service Market Value Share Analysis, by End-use Industry, 2031
Figure 23: Global Disaster Recovery as a Service Market Absolute Opportunity (US$ Mn), by BFSI, 2022 – 2031
Figure 24: Global Disaster Recovery as a Service Market Absolute Opportunity (US$ Mn), by IT & Telecom, 2022 – 2031
Figure 25: Global Disaster Recovery as a Service Market Absolute Opportunity (US$ Mn), by Government, 2022 – 2031
Figure 26: Global Disaster Recovery as a Service Market Absolute Opportunity (US$ Mn), by Media & Entertainment, 2022 – 2031
Figure 27: Global Disaster Recovery as a Service Market Absolute Opportunity (US$ Mn), by Retail & Consumer Goods, 2022 – 2031
Figure 28: Global Disaster Recovery as a Service Market Absolute Opportunity (US$ Mn), by Healthcare & Lifesciences2022 – 2031
Figure 29: Global Disaster Recovery as a Service Market Absolute Opportunity (US$ Mn), by Others, 2022 – 2031
Figure 30: Global Disaster Recovery as a Service Market Value Share Analysis, by Region, 2031
Figure 31: North America Disaster Recovery as a Service Market Absolute Opportunity (US$ Mn), 2022 – 2031
Figure 32: Europe Disaster Recovery as a Service Market Absolute Opportunity (US$ Mn), 2022 – 2031
Figure 33: Asia Pacific Disaster Recovery as a Service Market Absolute Opportunity (US$ Mn), 2022 – 2031
Figure 34: Middle East & Africa Disaster Recovery as a Service Market Absolute Opportunity (US$ Mn), 2022 – 2031
Figure 35: South America Disaster Recovery as a Service Market Absolute Opportunity (US$ Mn), 2022 – 2031
Figure 36: North America Disaster Recovery as a Service Revenue Opportunity Share, by Service Model
Figure 37: North America Disaster Recovery as a Service Revenue Opportunity Share, by Deployment
Figure 38: North America Disaster Recovery as a Service Revenue Opportunity Share, by End-use Industry
Figure 39: North America l Disaster Recovery as a Service Market Value Share Analysis, by Service Model, 2021
Figure 40: North America Disaster Recovery as a Service Market Value Share Analysis, by Service Model, 2031
Figure 41: North America Disaster Recovery as a Service Market Absolute Opportunity (US$ Mn), by Managed, 2022 – 2031
Figure 42: North America Disaster Recovery as a Service Market Absolute Opportunity (US$ Mn), by Self-service, 2022 – 2031
Figure 43: North America Disaster Recovery as a Service Market Value Share Analysis, by Deployment, 2021
Figure 44: North America Disaster Recovery as a Service Market Value Share Analysis, by Deployment, 2031
Figure 45: North America Disaster Recovery as a Service Market Absolute Opportunity (US$ Mn), by Public, 2022 – 2031
Figure 46: North America Disaster Recovery as a Service Market Absolute Opportunity (US$ Mn), by Private, 2022 – 2031
Figure 47: North America Disaster Recovery as a Service Market Absolute Opportunity (US$ Mn), by Hybrid, 2022 – 2031
Figure 48: North America Disaster Recovery as a Service Market Value Share Analysis, by End-use Industry, 2021
Figure 49: North America Disaster Recovery as a Service Market Value Share Analysis, by End-use Industry, 2031
Figure 50: North America Disaster Recovery as a Service Market Absolute Opportunity (US$ Mn), by BFSI, 2022 – 2031
Figure 51: North America Disaster Recovery as a Service Market Absolute Opportunity (US$ Mn), by IT & Telecom, 2022 – 2031
Figure 52: North America Disaster Recovery as a Service Market Absolute Opportunity (US$ Mn), by Government, 2022 – 2031
Figure 53: North America Disaster Recovery as a Service Market Absolute Opportunity (US$ Mn), by Media & Entertainment, 2022 – 2031
Figure 54: North America Disaster Recovery as a Service Market Absolute Opportunity (US$ Mn), by Retail & Consumer Goods, 2022 – 2031
Figure 55: North America Disaster Recovery as a Service Market Absolute Opportunity (US$ Mn), by Healthcare & LifesciencesGoods, 2022 – 2031
Figure 56 North America Disaster Recovery as a Service Market Absolute Opportunity (US$ Mn), by Others, 2022 – 2031
Figure 57: North America Disaster Recovery as a Service Market Absolute Opportunity (US$ Mn), by Country, 2022 – 2031
Figure 58: North America Disaster Recovery as a Service Market Absolute Opportunity (US$ Mn), by Country, 2022 – 2031
Figure 59: Mexico Disaster Recovery as a Service Market Opportunity Growth Analysis (US$ Mn) Forecast, 2022 – 2031
Figure 60: Europe Disaster Recovery as a Service Revenue Opportunity Share, by Service Model
Figure 61: Europe Disaster Recovery as a Service Revenue Opportunity Share, by Deployment
Figure 62: Europe Disaster Recovery as a Service Revenue Opportunity Share, by End-use Industry
Figure 63: Europe Disaster Recovery as a Service Market Value Share Analysis, by Service Model, 2021
Figure 64: Europe Disaster Recovery as a Service Market Value Share Analysis, by Service Model, 2031
Figure 65: Europe Disaster Recovery as a Service Market Absolute Opportunity (US$ Mn), by Managed , 2022 – 2031
Figure 66: Europe Disaster Recovery as a Service Market Absolute Opportunity (US$ Mn), by Self-service, 2022 – 2031
Figure 67: Europe Disaster Recovery as a Service Market Value Share Analysis, by Deployment, 2021
Figure 68: Europe Disaster Recovery as a Service Market Value Share Analysis, by Deployment, 2031
Figure 69: Europe Disaster Recovery as a Service Market Absolute Opportunity (US$ Mn), by Public, 2022 – 2031
Figure 70: Europe Disaster Recovery as a Service Market Absolute Opportunity (US$ Mn), by Private, 2022 – 2031
Figure 71: Europe Disaster Recovery as a Service Market Absolute Opportunity (US$ Mn), by Hybrid, 2022 – 2031
Figure 72: Europe Disaster Recovery as a Service Market Value Share Analysis, by End-use Industry, 2021
Figure 73: Europe Disaster Recovery as a Service Market Value Share Analysis, by End-use Industry, 2031
Figure 74: Europe Disaster Recovery as a Service Market Absolute Opportunity (US$ Mn), by BFSI, 2022 – 2031
Figure 75: Europe Disaster Recovery as a Service Market Absolute Opportunity (US$ Mn), by IT & Telecom, 2022 – 2031
Figure 76: Europe Disaster Recovery as a Service Market Absolute Opportunity (US$ Mn), by Government, 2022 – 2031
Figure 77: Europe Disaster Recovery as a Service Market Absolute Opportunity (US$ Mn), by Media & Entertainment, 2022 – 2031
Figure 78: Europe Disaster Recovery as a Service Market Absolute Opportunity (US$ Mn), by Retail & Consumer Goods, 2022 – 2031
Figure 79: Europe Disaster Recovery as a Service Market Absolute Opportunity (US$ Mn), by Healthcare & Lifesciences, 2022 – 2031
Figure 81: Europe Disaster Recovery as a Service Market Absolute Opportunity (US$ Mn), by Others, 2022 – 2031
Figure 82: Europe Disaster Recovery as a Service Market Value Share Analysis, by Country, 2021
Figure 83: Europe Disaster Recovery as a Service Market Value Share Analysis, by Country, 2031
Figure 84: Germany Disaster Recovery as a Service Market Opportunity Growth Analysis (US$ Mn) Forecast, 2022 – 2031
Figure 85: U.K. Disaster Recovery as a Service Market Opportunity Growth Analysis (US$ Mn) Forecast, 2022 – 2031
Figure 86: France Disaster Recovery as a Service Market Opportunity Growth Analysis (US$ Mn) Forecast, 2022 – 2031
Figure 87: Italy Disaster Recovery as a Service Market Opportunity Growth Analysis (US$ Mn) Forecast, 2022 – 2031
Figure 88: Spain Disaster Recovery as a Service Market Opportunity Growth Analysis (US$ Mn) Forecast, 2022 – 2031
Figure 89: Asia Pacific Disaster Recovery as a Service Revenue Opportunity Share, by Service Model
Figure 90: Asia Pacific Disaster Recovery as a Service Revenue Opportunity Share, by Deployment
Figure 91: Asia Pacific Disaster Recovery as a Service Revenue Opportunity Share, by End-use Industry
Figure 92: Asia Pacific l Disaster Recovery as a Service Market Value Share Analysis, by Service Model, 2021
Figure 93: Asia Pacific Disaster Recovery as a Service Market Value Share Analysis, by Service Model, 2031
Figure 94: Asia Pacific Disaster Recovery as a Service Market Absolute Opportunity (US$ Mn), by Managed , 2022 – 2031
Figure 95: Asia Pacific Disaster Recovery as a Service Market Absolute Opportunity (US$ Mn), by Self-service, 2022 – 2031
Figure 96: Asia Pacific Disaster Recovery as a Service Market Value Share Analysis, by Deployment, 2021
Figure 97: Asia Pacific Disaster Recovery as a Service Market Value Share Analysis, by Deployment, 2031
Figure 98: Asia Pacific Disaster Recovery as a Service Market Absolute Opportunity (US$ Mn), by Public, 2022 – 2031
Figure 99: Asia Pacific Disaster Recovery as a Service Market Absolute Opportunity (US$ Mn), by Private, 2022 – 2031
Figure 100: Asia Pacific Disaster Recovery as a Service Market Absolute Opportunity (US$ Mn), by Hybrid, 2022 – 2031
Figure 101: Asia Pacific Disaster Recovery as a Service Market Value Share Analysis, by End-use Industry, 2021
Figure 102: Asia Pacific Disaster Recovery as a Service Market Value Share Analysis, by End-use Industry, 2031
Figure 103: Asia Pacific Disaster Recovery as a Service Market Absolute Opportunity (US$ Mn), by BFSI, 2022 – 2031
Figure 105: Asia Pacific Disaster Recovery as a Service Market Absolute Opportunity (US$ Mn), by IT & Telecom, 2022 – 2031
Figure 106: Asia Pacific Disaster Recovery as a Service Market Absolute Opportunity (US$ Mn), by Government, 2022 – 2031
Figure 107: Asia Pacific Disaster Recovery as a Service Market Absolute Opportunity (US$ Mn), by Media & Entertainment, 2022 – 2031
Figure 108: Asia Pacific Disaster Recovery as a Service Market Absolute Opportunity (US$ Mn), by Retail & Consumer Goods, 2022 – 2031
Figure 106: Asia Pacific Disaster Recovery as a Service Market Absolute Opportunity (US$ Mn), by Healthcare & Lifesciences, 2022 – 2031
Figure 107: Asia Pacific Disaster Recovery as a Service Market Absolute Opportunity (US$ Mn), by Others, 2022 – 2031
Figure 108: Asia Pacific Disaster Recovery as a Service Market Value Share Analysis, by Country, 2021
Figure 110: Asia Pacific Disaster Recovery as a Service Market Value Share Analysis, by Country, 2031
Figure 111: China Disaster Recovery as a Service Market Opportunity Growth Analysis (US$ Mn) Forecast, 2022 – 2031
Figure 112: India Disaster Recovery as a Service Market Opportunity Growth Analysis (US$ Mn) Forecast, 2022 – 2031
Figure 113: Japan Disaster Recovery as a Service Market Opportunity Growth Analysis (US$ Mn) Forecast, 2022 – 2031
Figure 114: ASEAN Disaster Recovery as a Service Market Opportunity Growth Analysis (US$ Mn) Forecast, 2022 – 2031
Figure 115: Middle East & Africa Disaster Recovery as a Service Revenue Opportunity Share, by Service Model
Figure 116: Middle East & Africa Disaster Recovery as a Service Revenue Opportunity Share, by Deployment
Figure 117: Middle East & Africa Disaster Recovery as a Service Revenue Opportunity Share, by End-use Industry
Figure 118: Middle East & Africa l Disaster Recovery as a Service Market Value Share Analysis, by Service Model, 2021
Figure 119: Middle East & Africa Disaster Recovery as a Service Market Value Share Analysis, by Service Model, 2031
Figure 120: Middle East & Africa Disaster Recovery as a Service Market Absolute Opportunity (US$ Mn), by Managed (SIP) Trunking, 2022 – 2031
Figure 121: Middle East & Africa Disaster Recovery as a Service Market Absolute Opportunity (US$ Mn), by Self-service, 2022 – 2031
Figure 122: Middle East & Africa Disaster Recovery as a Service Market Value Share Analysis, by Deployment, 2021
Figure 123: Middle East & Africa Disaster Recovery as a Service Market Value Share Analysis, by Deployment, 2031
Figure 124: Middle East & Africa Disaster Recovery as a Service Market Absolute Opportunity (US$ Mn), by Public, 2022 – 2031
Figure 125: Middle East & Africa Disaster Recovery as a Service Market Absolute Opportunity (US$ Mn), by Private, 2022 – 2031
Figure 126: Middle East & Africa Disaster Recovery as a Service Market Absolute Opportunity (US$ Mn), by Hybrid, 2022 – 2031
Figure 127: Middle East & Africa Disaster Recovery as a Service Market Value Share Analysis, by End-use Industry, 2021
Figure 128: Middle East & Africa Disaster Recovery as a Service Market Value Share Analysis, by End-use Industry, 2031
Figure 129: Middle East & Africa Disaster Recovery as a Service Market Absolute Opportunity (US$ Mn), by BFSI, 2022 – 2031
Figure 130: Middle East & Africa Disaster Recovery as a Service Market Absolute Opportunity (US$ Mn), by IT & Telecom, 2022 – 2031
Figure 131: Middle East & Africa Disaster Recovery as a Service Market Absolute Opportunity (US$ Mn), by Government, 2022 – 2031
Figure 132: Middle East & Africa Disaster Recovery as a Service Market Absolute Opportunity (US$ Mn), by Media & Entertainment, 2022 – 2031
Figure 133: Middle East & Africa Disaster Recovery as a Service Market Absolute Opportunity (US$ Mn), by Retail & Consumer Goods, 2022 – 2031
Figure 134: Middle East & Africa Disaster Recovery as a Service Market Absolute Opportunity (US$ Mn), by Healthcare & Lifesciences, 2022 – 2031
Figure 135 Middle East & Africa Disaster Recovery as a Service Market Absolute Opportunity (US$ Mn), by Others, 2022 – 2031
Figure 136: Middle East & Africa Disaster Recovery as a Service Market Value Share Analysis, by Country, 2021
Figure 137: Middle East & Africa Disaster Recovery as a Service Market Value Share Analysis, by Country, 2031
Figure 138: Saudi Arabia Disaster Recovery as a Service Market Opportunity Growth Analysis (US$ Mn) Forecast, 2022 – 2031
Figure 139: U.A.E. Disaster Recovery as a Service Market Opportunity Growth Analysis (US$ Mn) Forecast, 2022 – 2031
Figure 140: South Africa Disaster Recovery as a Service Market Opportunity Growth Analysis (US$ Mn) Forecast, 2022 – 2031
Figure 141: South America Disaster Recovery as a Service Revenue Opportunity Share, by Service Model
Figure 142: South America Disaster Recovery as a Service Revenue Opportunity Share, by Deployment
Figure 143: South America Disaster Recovery as a Service Revenue Opportunity Share, by End-use Industry
Figure 144: South America Disaster Recovery as a Service Market Value Share Analysis, by Service Model, 2021
Figure 145: South America Disaster Recovery as a Service Market Value Share Analysis, by Service Model, 2031
Figure 146: South America Disaster Recovery as a Service Market Absolute Opportunity (US$ Mn), by Managed, 2022 – 2031
Figure 147: South America Disaster Recovery as a Service Market Absolute Opportunity (US$ Mn), by Self-service, 2022 – 2031
Figure 149: South America Disaster Recovery as a Service Market Value Share Analysis, by Deployment, 2021
Figure 150: South America Disaster Recovery as a Service Market Value Share Analysis, by Deployment, 2031
Figure 151: South America Disaster Recovery as a Service Market Absolute Opportunity (US$ Mn), by Public, 2022 – 2031
Figure 152: South America Disaster Recovery as a Service Market Absolute Opportunity (US$ Mn), by Private, 2022 – 2031
Figure 153: South America Disaster Recovery as a Service Market Absolute Opportunity (US$ Mn), by Hybrid, 2022 – 2031
Figure 154: South America Disaster Recovery as a Service Market Value Share Analysis, by End-use Industry, 2021
Figure 155: South America Disaster Recovery as a Service Market Value Share Analysis, by End-use Industry, 2031
Figure 156: South America Disaster Recovery as a Service Market Absolute Opportunity (US$ Mn), by BFSI, 2022 – 2031
Figure 157: South America Disaster Recovery as a Service Market Absolute Opportunity (US$ Mn), by IT & Telecom, 2022 – 2031
Figure 158: South America Disaster Recovery as a Service Market Absolute Opportunity (US$ Mn), by Government, 2022 – 2031
Figure 159: South America Disaster Recovery as a Service Market Absolute Opportunity (US$ Mn), by Media & Entertainment, 2022 – 2031
Figure 160: South America Disaster Recovery as a Service Market Absolute Opportunity (US$ Mn), by Retail & Consumer Goods, 2022 – 2031
Figure 161: South America Disaster Recovery as a Service Market Absolute Opportunity (US$ Mn), by Healthcare & Lifesciences, 2022 – 2031
Figure 162: South America Disaster Recovery as a Service Market Absolute Opportunity (US$ Mn), by Others, 2022 – 2031
Figure 163: South America Disaster Recovery as a Service Market Value Share Analysis, by Country, 2021
Figure 164: South America Disaster Recovery as a Service Market Value Share Analysis, by Country, 2031
Figure 165: Brazil Disaster Recovery as a Service Market Opportunity Growth Analysis (US$ Mn) Forecast, 2022 – 2031
Figure 166: Argentina Disaster Recovery as a Service Market Opportunity Growth Analysis (US$ Mn) Forecast, 2022 – 2031
Copyright © Transparency Market Research, Inc. All Rights reserved
Trust Online

Disaster Recovery as a Service (DRaaS) Market