
Reports
Reports
Due to rising global energy needs, fast depletion of traditional energy sources, and worries about pollution from traditional energy sources, the global energy industry is shifting toward waste to energy solutions. Governments all around the world are promoting measures and financial incentives to boost energy production from agricultural and industrial waste. This factor is likely to foster growth of the global waste to energy market in the years to come.
While there are just a few multinational businesses operating in the global waste to energy market, it is predicted to grow at a substantial rate in the next five years, owing to the participation of developing nations. Ongoing research is also expected to address present conversion and efficiency difficulties, allowing trash to become a mainstream source of energy.
The global waste to energy market is being driven by increasing trash production, a growing focus on non-fossil fuel energy sources, and increasing concern about waste management to fulfill the requirement for sustainable urban living. The high cost of incinerators is projected to limit industry expansion, especially when energy prices fall and numerous units become unable to meet operating expenses. Moreover, numerous European and Asian-Pacific nations intend to place a greater emphasis on recycling, which saves three to five times as much energy as waste to energy, putting a cap on the waste to energy industry.
Due to the rising construction of trash incineration facilities throughout the world, thermal technology is predicted to account for the largest market share in the global waste to energy market in the years to come. Plants that combine cogeneration of thermal power (cooling and heating) with electricity generation are expected to achieve optimal efficiency of 80%.
Incineration is a very well-known waste to energy technique for the processing of municipal solid waste (MSW) in the current context. However, waste to energy systems, notably incineration, pollute the environment, and pose health dangers. Owners of incineration plants have implemented a variety of process units for cleansing the flue gas stream in order to minimize particle and gas-phase emissions, resulting in a major improvement in environmental sustainability.
In recent years, the global waste to energy technologies market has been receiving great accolade. These technologies are used for generating energy from waste material and turn it into fuel. The energy produced from this procedure is similar to the one generated by burning natural gas, coal, oil, or other traditional methods. The waste to energy technologies helps in reducing the municipal solid wastes landfill by a considerable amount. It further helps in reducing the emissions of carbon dioxide from the generated waste.
Considerable rise in terms of consumption of power along with growing focus on generating energy through renewable sources of energy are projected to be the key driving factors for the overall development of the global waste to energy technologies market in the near future. This growth of the global market is also attributed to the fast paced development in the activities of urbanization and industrialization in developing economies in Asia Pacific such as China and India. Moreover, in recent years, there have been considerable rise in the levels of investments put in by the key stakeholders in the global waste to energy technologies market. This too is expected to further fuel up the development of the global market.
The leading companies in the global market for waste to energy technologies are concentrating on developing new and innovative products. The companies in the market are trying to explore new geographical segments and areas for potential revenue generation and lucrative business opportunities. The companies in the market are also expected to adopt aggressive growth strategies such as mergers, acquisitions, and joint ventures in order to stay ahead of the competitive curve. For instance, in October 2017, John Wood Group announced that the company has acquired Amec Foster Wheeler. This takeover has helped John Wood Group to bolster their portfolio in the energy business sector.
Waste-to-energy is another efficient alternative for energy production. It helps in reduction of carbon emissions and replenish fossil fuels. It is also an effective way to getting rid of trash through disposal methods, and even recovers valuable resources. Waste-to-energy holds an important role in sustainable waste management chain.
Waste to energy is achieved through esterification, thermos-chemical or bio-chemical technologies. The utilization of technologies is dependent on several factors for example, type and composition of waste, final energy form, and calorific value. The energy produced is used in applications like heat and electricity generation, mainly achieved through incineration. Moreover, transport fuel like bio-deisel, ethanol, and bio-jet fuel are extracted from waste processing. This blending of gasoline and ethanol boosts the growth in global ethanol production.
The study caters an elaborated analysis of the global waste-to-energy market on the basis of various segments as per technology, type, region, and application. On the basis of waste type, the market is divided into agricultural waste, municipal solid waste, and so on. Moreover, as per the technology, the global waste-to-energy market is segregated as biochemical and thermochemical. Application-wise, the market has been divided into heat, electricity, and so forth. These segments are studied from present as well as future point of view, both.
Several new waste-to-energy projects are being established in the world, and supporting the global energy mix consistently in coming years. Moreover, government regulations are as well furling the demand in the waste-to-energy market. Policies for example, tax credits, feed-in-tariffs, and capital subsidies are given to for waste-to-energy plants in India, the U.S., China, and nations in the EU.
A key factor responsible for pull down the growth of global waste-to-energy market is the high initial cost for constructing a waste-to-energy plant. In fact, the average time for payback of an anaerobic digestion project is above five years. This fortifies the restricting factor behind the market growth in forecast period.
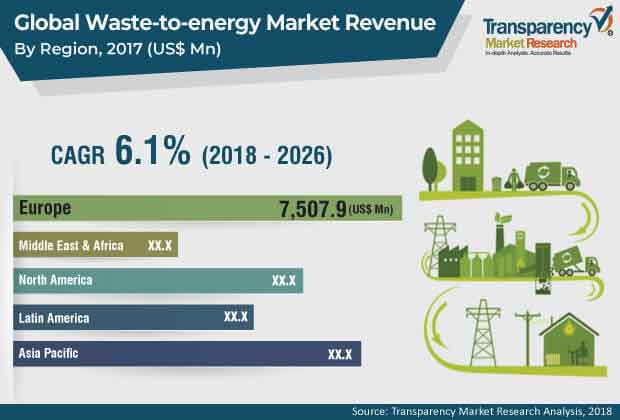
Regionally, in 2017, Europe led the global waste-to-energy market. Rising initiatives by the governments, new targets regarding renewable energy, and increasing investments in biogas technology are estimated to fuel the growth of waste-to-energy market in Europe in the span of coming years. In year 2016 itself, nearly 41 new biomethane plants were established in the region. In addition, the Asia Pacific waste-to-energy market in Asia Pacific is likely to grow rapidly in the forthcoming years. In various nations in Asia Pacific, such as Thailand, India, Malaysia, and South Korea, the consumption of energy is consistently increasing. Growth in industrialization, and increasing importance of renewable source of energy is estimated to fuel the mentioned region in the forecast period.
The global waste-to-energy market appears to be immensely fragmented. Several regional and global players are operating in the market. The major firms leading the global waste-to-energy market are SUEZ, Veolia, Covanta Holding Corporation, Constructions industrielles de la Méditerranée (CNIM), Keppel Corporation Limited, China Everbright International Limited, STEAG GmbH, Future Biogas Limited, Babcock & Wilcox Enterprises, Inc., and Gazasia Ltd.
1. Preface
1.1. Report Scope and Market Segmentation
1.2. Research Highlights
2. Assumptions and Research Methodology
2.1. Report Assumptions
2.2. Secondary Sources and Acronyms Used
2.3. Research Methodology
3. Executive Summary
3.1. Market Snapshot
3.2. Top Trends
4. Market Overview
4.1. Introduction
4.2. Market Indicators
5. Market Dynamics
5.1. Drivers and Restraints Snapshot Analysis
5.1.1. Drivers
5.1.2. Restraint
5.1.3. Opportunity
5.2. Porter’s Five Forces Analysis
5.2.1. Threat of Substitutes
5.2.2. Bargaining Power of Buyers
5.2.3. Bargaining Power of Suppliers
5.2.4. Threat of New Entrants
5.2.5. Degree of Competition
5.3. Regulatory Scenario
5.4. Value Chain Analysis
6. Global Waste-to-energy Market Analysis and Forecast, by Waste Type, 2017–2026
6.1. Key Findings
6.2. Introduction
6.3. Global Waste-to-energy Market Value (US$ Mn) & Volume (Thousand Tons) Analysis & Forecast, by Waste Type, 2017–2026
6.3.1. Municipal Solid Waste (MSW)
6.3.2. Agricultural Waste
6.3.3. Others
6.4. Global Waste-to-energy Market Attractiveness Analysis, by Waste Type
7. Global Waste-to-energy Market Analysis, by Technology
7.1. Key Findings
7.2. Introduction
7.3. Global Waste-to-energy Market Value (US$ Mn) & Volume (Thousand Tons) Analysis & Forecast, by Technology, 2017–2026
7.3.1. Thermochemical
7.3.1.1. Incineration
7.3.1.2. Others
7.3.2. Biochemical
7.3.2.1. Anaerobic Digestion
7.3.2.2. Others
7.4. Global Waste-to-energy Market Attractiveness Analysis, by Technology
8. Global Waste-to-energy Market Analysis and Forecast, by Application, 2017–2026
8.1. Key Findings
8.2. Introduction
8.3. Global Waste-to-energy Market Value (US$ Mn) & Volume (Thousand Tons) Analysis & Forecast, by Application, 2017–2026
8.3.1. Electricity
8.3.2. Heat
8.3.3. Others
8.4. Global Waste-to-energy Market Attractiveness Analysis, by Application
9. Global Waste-to-energy Market Analysis, by Region, 2017–2026
9.1. Key Findings
9.2. Global Waste-to-energy Market Value (US$ Mn) & Volume (Thousand Tons) Analysis & Forecast, by Region, 2017–2026
9.2.1. North America
9.2.2. Europe
9.2.3. Asia Pacific
9.2.4. Latin America
9.2.5. Middle East & Africa
9.3. Global Waste-to-energy Market Attractiveness Analysis, by Region
10. North America Waste-to-energy Market Analysis, 2017–2026
10.1. Key Findings
10.2. North America Waste-to-energy Market Value (US$ Mn) & Volume (Thousand Tons) Analysis & Forecast, by Waste Type
10.2.1. Municipal Solid Waste (MSW)
10.2.2. Agricultural Waste
10.2.3. Others
10.3. North America Waste-to-energy Market Value (US$ Mn) & Volume (Thousand Tons) Analysis & Forecast, by Technology
10.3.1. Thermochemical
10.3.1.1. Incineration
10.3.1.2. Others
10.3.2. Biochemical
10.3.2.1. Anaerobic Digestion
10.3.2.2. Others
10.4. North America Waste-to-energy Market Value (US$ Mn) & Volume (Thousand Tons) Analysis & Forecast, by Application
10.4.1. Electricity
10.4.2. Heat
10.4.3. Others
10.5. U.S. Waste-to-energy Market Value (US$ Mn) & Volume (Thousand Tons) Forecast, by Waste Type
10.5.1. Municipal Solid Waste (MSW)
10.5.2. Agricultural Waste
10.5.3. Others
10.6. U.S. Waste-to-energy Market Value (US$ Mn) & Volume (Thousand Tons) Forecast, by Technology
10.6.1. Thermochemical
10.6.1.1. Incineration
10.6.1.2. Others
10.6.2. Biochemical
10.6.2.1. Anaerobic Digestion
10.6.2.2. Others
10.7. U.S. Waste-to-energy Market Value (US$ Mn) & Volume (Thousand Tons) Forecast, by Application
10.7.1. Electricity
10.7.2. Heat
10.7.3. Others
10.8. Canada Waste-to-energy Market Value (US$ Mn) & Volume (Thousand Tons) Forecast, by Waste Type
10.8.1. Municipal Solid Waste (MSW)
10.8.2. Agricultural Waste
10.8.3. Others
10.9. Canada Waste-to-energy Market Value (US$ Mn) & Volume (Thousand Tons) Forecast, by Technology
10.9.1. Thermochemical
10.9.1.1. Incineration
10.9.1.2. Others
10.9.2. Biochemical
10.9.2.1. Anaerobic Digestion
10.9.2.2. Others
10.10. Canada Waste-to-energy Market Value (US$ Mn) & Volume (Thousand Tons) Forecast, by Application
10.10.1. Electricity
10.10.2. Heat
10.10.3. Others
10.11. North America Waste-to-energy Market Attractiveness Analysis
10.11.1. by Waste Type
10.11.2. by Technology
10.11.3. by Application
11. Europe Waste-to-energy Market Analysis, 2017–2026
11.1. Key Findings
11.2. Europe Waste-to-energy Market Value (US$ Mn) & Volume (Thousand Tons) Analysis & Forecast, by Waste Type
11.2.1. Municipal Solid Waste (MSW)
11.2.2. Agricultural Waste
11.2.3. Others
11.3. Europe Waste-to-energy Market Value (US$ Mn) & Volume (Thousand Tons) Analysis & Forecast, by Technology
11.3.1. Thermochemical
11.3.1.1. Incineration
11.3.1.2. Others
11.3.2. Biochemical
11.3.2.1. Anaerobic Digestion
11.3.2.2. Others
11.4. Europe Waste-to-energy Market Value (US$ Mn) & Volume (Thousand Tons) Analysis & Forecast, by Application
11.4.1. Electricity
11.4.2. Heat
11.4.3. Others
11.5. Germany Waste-to-energy Market Value (US$ Mn) & Volume (Thousand Tons) Forecast, by Waste Type
11.5.1. Municipal Solid Waste (MSW)
11.5.2. Agricultural Waste
11.5.3. Others
11.6. Germany Waste-to-energy Market Value (US$ Mn) & Volume (Thousand Tons) Forecast, by Technology
11.6.1. Thermochemical
11.6.1.1. Incineration
11.6.1.2. Others
11.6.2. Biochemical
11.6.2.1. Anaerobic Digestion
11.6.2.2. Others
11.7. Germany Waste-to-energy Market Value (US$ Mn) & Volume (Thousand Tons) Forecast, by Application
11.7.1. Electricity
11.7.2. Heat
11.7.3. Others
11.8. U.K. Waste-to-energy Market Value (US$ Mn) & Volume (Thousand Tons) Forecast, by Waste Type
11.8.1. Municipal Solid Waste (MSW)
11.8.2. Agricultural Waste
11.8.3. Others
11.9. U.K. Waste-to-energy Market Value (US$ Mn) & Volume (Thousand Tons) Forecast, by Technology
11.9.1. Thermochemical
11.9.1.1. Incineration
11.9.1.2. Others
11.9.2. Biochemical
11.9.2.1. Anaerobic Digestion
11.9.2.2. Others
11.10. U.K. Waste-to-energy Market Value (US$ Mn) & Volume (Thousand Tons) Forecast, by Application
11.10.1. Electricity
11.10.2. Heat
11.10.3. Others
11.11. France Waste-to-energy Market Value (US$ Mn) & Volume (Thousand Tons) Forecast, by Waste Type
11.11.1. Municipal Solid Waste (MSW)
11.11.2. Agricultural Waste
11.11.3. Others
11.12. France Waste-to-energy Market Value (US$ Mn) & Volume (Thousand Tons) Forecast, by Technology
11.12.1. Thermochemical
11.12.1.1. Incineration
11.12.1.2. Others
11.12.2. Biochemical
11.12.2.1. Anaerobic Digestion
11.12.2.2. Others
11.13. France Waste-to-energy Market Value (US$ Mn) & Volume (Thousand Tons) Forecast, by Application
11.13.1. Electricity
11.13.2. Heat
11.13.3. Others
11.14. Italy Waste-to-energy Market Value (US$ Mn) & Volume (Thousand Tons) Forecast, by Waste Type
11.14.1. Municipal Solid Waste (MSW)
11.14.2. Agricultural Waste
11.14.3. Others
11.15. Italy Waste-to-energy Market Value (US$ Mn) & Volume (Thousand Tons) Forecast, by Technology
11.15.1. Thermochemical
11.15.1.1. Incineration
11.15.1.2. Others
11.15.2. Biochemical
11.15.2.1. Anaerobic Digestion
11.15.2.2. Others
11.16. Italy Waste-to-energy Market Value (US$ Mn) & Volume (Thousand Tons) Forecast, by Application
11.16.1. Electricity
11.16.2. Heat
11.16.3. Others
11.17. Sweden Waste-to-energy Market Value (US$ Mn) & Volume (Thousand Tons) Forecast, by Waste Type
11.17.1. Municipal Solid Waste (MSW)
11.17.2. Agricultural Waste
11.17.3. Others
11.18. Sweden Waste-to-energy Market Value (US$ Mn) & Volume (Thousand Tons) Forecast, by Technology
11.18.1. Thermochemical
11.18.1.1. Incineration
11.18.1.2. Others
11.18.2. Biochemical
11.18.2.1. Anaerobic Digestion
11.18.2.2. Others
11.19. Sweden Waste-to-energy Market Value (US$ Mn) & Volume (Thousand Tons) Forecast, by Application
11.19.1. Electricity
11.19.2. Heat
11.19.3. Others
11.20. Switzerland Waste-to-energy Market Value (US$ Mn) & Volume (Thousand Tons) Forecast, by Waste Type
11.20.1. Municipal Solid Waste (MSW)
11.20.2. Agricultural Waste
11.20.3. Others
11.21. Switzerland Waste-to-energy Market Value (US$ Mn) & Volume (Thousand Tons) Forecast, by Technology
11.21.1. Thermochemical
11.21.1.1. Incineration
11.21.1.2. Others
11.21.2. Biochemical
11.21.2.1. Anaerobic Digestion
11.21.2.2. Others
11.22. Switzerland Waste-to-energy Market Value (US$ Mn) & Volume (Thousand Tons) Forecast, by Application
11.22.1. Electricity
11.22.2. Heat
11.22.3. Others
11.23. Netherlands Waste-to-energy Market Value (US$ Mn) & Volume (Thousand Tons) Forecast, by Waste Type
11.23.1. Municipal Solid Waste (MSW)
11.23.2. Agricultural Waste
11.23.3. Others
11.24. Netherlands Waste-to-energy Market Value (US$ Mn) & Volume (Thousand Tons) Forecast, by Technology
11.24.1. Thermochemical
11.24.1.1. Incineration
11.24.1.2. Others
11.24.2. Biochemical
11.24.2.1. Anaerobic Digestion
11.24.2.2. Others
11.25. Netherlands Waste-to-energy Market Value (US$ Mn) & Volume (Thousand Tons) Forecast, by Application
11.25.1. Electricity
11.25.2. Heat
11.25.3. Others
11.26. Belgium Waste-to-energy Market Value (US$ Mn) & Volume (Thousand Tons) Forecast, by Waste Type
11.26.1. Municipal Solid Waste (MSW)
11.26.2. Agricultural Waste
11.26.3. Others
11.27. Belgium Waste-to-energy Market Value (US$ Mn) & Volume (Thousand Tons) Forecast, by Technology
11.27.1. Thermochemical
11.27.1.1. Incineration
11.27.1.2. Others
11.27.2. Biochemical
11.27.2.1. Anaerobic Digestion
11.27.2.2. Others
11.28. Belgium Waste-to-energy Market Value (US$ Mn) & Volume (Thousand Tons) Forecast, by Application
11.28.1. Electricity
11.28.2. Heat
11.28.3. Others
11.29. Spain Waste-to-energy Market Value (US$ Mn) & Volume (Thousand Tons) Forecast, by Waste Type
11.29.1. Municipal Solid Waste (MSW)
11.29.2. Agricultural Waste
11.29.3. Others
11.30. Spain Waste-to-energy Market Value (US$ Mn) & Volume (Thousand Tons) Forecast, by Technology
11.30.1. Thermochemical
11.30.1.1. Incineration
11.30.1.2. Others
11.30.2. Biochemical
11.30.2.1. Anaerobic Digestion
11.30.2.2. Others
11.31. Spain Waste-to-energy Market Value (US$ Mn) & Volume (Thousand Tons) Forecast, by Application
11.31.1. Electricity
11.31.2. Heat
11.31.3. Others
11.32. Rest of Europe Waste-to-energy Market Value (US$ Mn) & Volume (Thousand Tons) Forecast, by Waste Type
11.32.1. Municipal Solid Waste (MSW)
11.32.2. Agricultural Waste
11.32.3. Others
11.33. Rest of Europe Waste-to-energy Market Value (US$ Mn) & Volume (Thousand Tons) Forecast, by Technology
11.33.1. Thermochemical
11.33.1.1. Incineration
11.33.1.2. Others
11.33.2. Biochemical
11.33.2.1. Anaerobic Digestion
11.33.2.2. Others
11.34. Rest of Europe Waste-to-energy Market Value (US$ Mn) & Volume (Thousand Tons) Forecast, by Application
11.34.1. Electricity
11.34.2. Heat
11.34.3. Others
11.35. Europe Waste-to-energy Market Attractiveness Analysis
11.35.1. by Waste Type
11.35.2. by Technology
11.35.3. by Application
12. Asia Pacific Waste-to-energy Market Analysis, 2017–2026
12.1. Key Findings
12.2. Asia Pacific Waste-to-energy Market Value (US$ Mn) & Volume (Thousand Tons) Analysis & Forecast, by Waste Type
12.2.1. Municipal Solid Waste (MSW)
12.2.2. Agricultural Waste
12.2.3. Others
12.3. Asia Pacific Waste-to-energy Market Value (US$ Mn) & Volume (Thousand Tons) Analysis & Forecast, by Technology
12.3.1. Thermochemical
12.3.1.1. Incineration
12.3.1.2. Others
12.3.2. Biochemical
12.3.2.1. Anaerobic Digestion
12.3.2.2. Others
12.4. Asia Pacific Waste-to-energy Market Value (US$ Mn) & Volume (Thousand Tons) Analysis & Forecast, by Application
12.4.1. Electricity
12.4.2. Heat
12.4.3. Others
12.5. China Waste-to-energy Market Value (US$ Mn) & Volume (Thousand Tons) Forecast, by Waste Type
12.5.1. Municipal Solid Waste (MSW)
12.5.2. Agricultural Waste
12.5.3. Others
12.6. China Waste-to-energy Market Value (US$ Mn) & Volume (Thousand Tons) Forecast, by Technology
12.6.1. Thermochemical
12.6.1.1. Incineration
12.6.1.2. Others
12.6.2. Biochemical
12.6.2.1. Anaerobic Digestion
12.6.2.2. Others
12.7. China Waste-to-energy Market Value (US$ Mn) & Volume (Thousand Tons) Forecast, by Application
12.7.1. Electricity
12.7.2. Heat
12.7.3. Others
12.8. Japan Waste-to-energy Market Value (US$ Mn) & Volume (Thousand Tons) Forecast, by Waste Type
12.8.1. Municipal Solid Waste (MSW)
12.8.2. Agricultural Waste
12.8.3. Others
12.9. Japan Waste-to-energy Market Value (US$ Mn) & Volume (Thousand Tons) Forecast, by Technology
12.9.1. Thermochemical
12.9.1.1. Incineration
12.9.1.2. Others
12.9.2. Biochemical
12.9.2.1. Anaerobic Digestion
12.9.2.2. Others
12.10. Japan Waste-to-energy Market Value (US$ Mn) & Volume (Thousand Tons) Forecast, by Application
12.10.1. Electricity
12.10.2. Heat
12.10.3. Others
12.11. South Korea Waste-to-energy Market Value (US$ Mn) & Volume (Thousand Tons) Forecast, by Waste Type
12.11.1. Municipal Solid Waste (MSW)
12.11.2. Agricultural Waste
12.11.3. Others
12.12. South Korea Waste-to-energy Market Value (US$ Mn) & Volume (Thousand Tons) Forecast, by Technology
12.12.1. Thermochemical
12.12.1.1. Incineration
12.12.1.2. Others
12.12.2. Biochemical
12.12.2.1. Anaerobic Digestion
12.12.2.2. Others
12.13. South Korea Waste-to-energy Market Value (US$ Mn) & Volume (Thousand Tons) Forecast, by Application
12.13.1. Electricity
12.13.2. Heat
12.13.3. Others
12.14. Australia Waste-to-energy Market Value (US$ Mn) & Volume (Thousand Tons) Forecast, by Waste Type
12.14.1. Municipal Solid Waste (MSW)
12.14.2. Agricultural Waste
12.14.3. Others
12.15. Australia Waste-to-energy Market Value (US$ Mn) & Volume (Thousand Tons) Forecast, by Technology
12.15.1. Thermochemical
12.15.1.1. Incineration
12.15.1.2. Others
12.15.2. Biochemical
12.15.2.1. Anaerobic Digestion
12.15.2.2. Others
12.16. Australia Waste-to-energy Market Value (US$ Mn) & Volume (Thousand Tons) Forecast, by Application
12.16.1. Electricity
12.16.2. Heat
12.16.3. Others
12.17. ASEAN Waste-to-energy Market Value (US$ Mn) & Volume (Thousand Tons) Forecast, by Waste Type
12.17.1. Municipal Solid Waste (MSW)
12.17.2. Agricultural Waste
12.17.3. Others
12.18. ASEAN Waste-to-energy Market Value (US$ Mn) & Volume (Thousand Tons) Forecast, by Technology
12.18.1. Thermochemical
12.18.1.1. Incineration
12.18.1.2. Others
12.18.2. Biochemical
12.18.2.1. Anaerobic Digestion
12.18.2.2. Others
12.19. ASEAN Waste-to-energy Market Value (US$ Mn) & Volume (Thousand Tons) Forecast, by Application
12.19.1. Electricity
12.19.2. Heat
12.19.3. Others
12.20. Rest of Asia Pacific Waste-to-energy Market Value (US$ Mn) & Volume (Thousand Tons) Forecast, by Waste Type
12.20.1. Municipal Solid Waste (MSW)
12.20.2. Agricultural Waste
12.20.3. Others
12.21. Rest of Asia Pacific Waste-to-energy Market Value (US$ Mn) & Volume (Thousand Tons) Forecast, by Technology
12.21.1. Thermochemical
12.21.1.1. Incineration
12.21.1.2. Others
12.21.2. Biochemical
12.21.2.1. Anaerobic Digestion
12.21.2.2. Others
12.22. Rest of Asia Pacific Waste-to-energy Market Value (US$ Mn) & Volume (Thousand Tons) Forecast, by Application
12.22.1. Electricity
12.22.2. Heat
12.22.3. Others
12.23. Asia Pacific Waste-to-energy Market Attractiveness Analysis
12.23.1. by Waste Type
12.23.2. by Technology
12.23.3. by Application
13. Latin America Waste-to-energy Market Analysis, 2017–2026
13.1. Key Findings
13.2. Latin America Waste-to-energy Market Value (US$ Mn) & Volume (Thousand Tons) Analysis & Forecast, by Waste Type
13.2.1. Municipal Solid Waste (MSW)
13.2.2. Agricultural Waste
13.2.3. Others
13.3. Latin America Waste-to-energy Market Value (US$ Mn) & Volume (Thousand Tons) Analysis & Forecast, by Technology
13.3.1. Thermochemical
13.3.1.1. Incineration
13.3.1.2. Others
13.3.2. Biochemical
13.3.2.1. Anaerobic Digestion
13.3.2.2. Others
13.4. Latin America Waste-to-energy Market Value (US$ Mn) & Volume (Thousand Tons) Analysis & Forecast, by Application
13.4.1. Electricity
13.4.2. Heat
13.4.3. Others
13.5. Brazil Waste-to-energy Market Value (US$ Mn) & Volume (Thousand Tons) Forecast, by Waste Type
13.5.1. Municipal Solid Waste (MSW)
13.5.2. Agricultural Waste
13.5.3. Others
13.6. Brazil Waste-to-energy Market Value (US$ Mn) & Volume (Thousand Tons) Forecast, by Technology
13.6.1. Thermochemical
13.6.1.1. Incineration
13.6.1.2. Others
13.6.2. Biochemical
13.6.2.1. Anaerobic Digestion
13.6.2.2. Others
13.7. Brazil Waste-to-energy Market Value (US$ Mn) & Volume (Thousand Tons) Forecast, by Application
13.7.1. Electricity
13.7.2. Heat
13.7.3. Others
13.8. Mexico Waste-to-energy Market Value (US$ Mn) & Volume (Thousand Tons) Forecast, by Waste Type
13.8.1. Municipal Solid Waste (MSW)
13.8.2. Agricultural Waste
13.8.3. Others
13.9. Mexico Waste-to-energy Market Value (US$ Mn) & Volume (Thousand Tons) Forecast, by Technology
13.9.1. Thermochemical
13.9.1.1. Incineration
13.9.1.2. Others
13.9.2. Biochemical
13.9.2.1. Anaerobic Digestion
13.9.2.2. Others
13.10. Mexico Waste-to-energy Market Value (US$ Mn) & Volume (Thousand Tons) Forecast, by Application
13.10.1. Electricity
13.10.2. Heat
13.10.3. Others
13.11. Rest of Latin America Waste-to-energy Market Value (US$ Mn) & Volume (Thousand Tons) Forecast, by Waste Type
13.11.1. Municipal Solid Waste (MSW)
13.11.2. Agricultural Waste
13.11.3. Others
13.12. Rest of Latin America Waste-to-energy Market Value (US$ Mn) & Volume (Thousand Tons) Forecast, by Technology
13.12.1. Thermochemical
13.12.1.1. Incineration
13.12.1.2. Others
13.12.2. Biochemical
13.12.2.1. Anaerobic Digestion
13.12.2.2. Others
13.13. Rest of Latin America Waste-to-energy Market Value (US$ Mn) & Volume (Thousand Tons) Forecast, by Application
13.13.1. Electricity
13.13.2. Heat
13.13.3. Other
13.14. Latin America Waste-to-energy Market Attractiveness Analysis
13.14.1. by Waste Type
13.14.2. by Technology
13.14.3. by Application
14. Middle East & Africa Waste-to-energy Market Analysis, 2017–2026
14.1. Key Findings
14.2. Middle East & Africa Waste-to-energy Market Value (US$ Mn) & Volume (Thousand Tons) Analysis & Forecast, by Waste Type
14.2.1. Municipal Solid Waste (MSW)
14.2.2. Agricultural Waste
14.2.3. Others
14.3. Middle East & Africa Waste-to-energy Market Value (US$ Mn) & Volume (Thousand Tons) Analysis & Forecast, by Technology
14.3.1. Thermochemical
14.3.1.1. Incineration
14.3.1.2. Others
14.3.2. Biochemical
14.3.2.1. Anaerobic Digestion
14.3.2.2. Others
14.4. Middle East & Africa Waste-to-energy Market Value (US$ Mn) & Volume (Thousand Tons) Analysis & Forecast, by Application
14.4.1. Electricity
14.4.2. Heat
14.4.3. Others
14.5. GCC Waste-to-energy Market Value (US$ Mn) & Volume (Thousand Tons) Forecast, by Waste Type
14.5.1. Municipal Solid Waste (MSW)
14.5.2. Agricultural Waste
14.5.3. Others
14.6. GCC Waste-to-energy Market Value (US$ Mn) & Volume (Thousand Tons) Forecast, by Technology
14.6.1. Thermochemical
14.6.1.1. Incineration
14.6.1.2. Others
14.6.2. Biochemical
14.6.2.1. Anaerobic Digestion
14.6.2.2. Others
14.7. GCC Waste-to-energy Market Value (US$ Mn) & Volume (Thousand Tons) Forecast, by Application
14.7.1. Electricity
14.7.2. Heat
14.7.3. Others
14.8. Rest of Middle East & Africa Waste-to-energy Market Value (US$ Mn) & Volume (Thousand Tons) Forecast, by Waste Type
14.8.1. Municipal Solid Waste (MSW)
14.8.2. Agricultural Waste
14.8.3. Others
14.9. Rest of Middle East & Africa Waste-to-energy Market Value (US$ Mn) & Volume (Thousand Tons) Forecast, by Technology
14.9.1. Thermochemical
14.9.1.1. Incineration
14.9.1.2. Others
14.9.2. Biochemical
14.9.2.1. Anaerobic Digestion
14.9.2.2. Others
14.10. Rest of Middle East & Africa Waste-to-energy Market Value (US$ Mn) & Volume (Thousand Tons) Forecast, by Application
14.10.1. Electricity
14.10.2. Heat
14.10.3. Others
14.11. Middle East & Africa Waste-to-energy Market Attractiveness Analysis
14.11.1. by Waste Type
14.11.2. by Technology
14.11.3. by Application
15. Competition Landscape
15.1. Competition Matrix
15.2. Global Waste-to-energy Market Share Analysis, by Company (2017)
15.3. Company Profiles
15.3.1. SUEZ
15.3.1.1. Company Details
15.3.1.2. Company Description
15.3.1.3. Business Overview
15.3.1.4. Financial Details
15.3.1.5. Key Developments
15.3.2. Veolia
15.3.2.1. Company Details
15.3.2.2. Company Description
15.3.2.3. Business Overview
15.3.2.4. Financial Details
15.3.2.5. Key Developments
15.3.3. Keppel Corporation Limited
15.3.3.1. Company Details
15.3.3.2. Company Description
15.3.3.3. Business Overview
15.3.3.4. Financial Details
15.3.3.5. Key Developments
15.3.4. Covanta Holding Corporation
15.3.4.1. Company Details
15.3.4.2. Company Description
15.3.4.3. Business Overview
15.3.4.4. Financial Details
15.3.4.5. Key Developments
15.3.5. Constructions industrielles de la Méditerranée (CNIM)
15.3.5.1. Company Details
15.3.5.2. Company Description
15.3.5.3. Business Overview
15.3.5.4. Financial Details
15.3.5.5. Key Developments
15.3.6. China Everbright International Limited
15.3.6.1. Company Details
15.3.6.2. Company Description
15.3.6.3. Business Overview
15.3.6.4. Financial Details
15.3.6.5. Key Developments
15.3.7. Babcock & Wilcox Enterprises, Inc.
15.3.7.1. Company Details
15.3.7.2. Company Description
15.3.7.3. Business Overview
15.3.7.4. Financial Details
15.3.7.5. Key Developments
15.3.8. STEAG GmbH
15.3.8.1. Company Details
15.3.8.2. Company Description
15.3.8.3. Business Overview
15.3.8.4. Key Developments
15.3.9. Future Biogas Limited
15.3.9.1. Company Details
15.3.9.2. Company Description
15.3.9.3. Business Overview
15.3.10. Gazasia Ltd
15.3.10.1. Company Details
15.3.10.2. Company Description
15.3.10.3. Business Overview
16. Primary Research – Key Insights
List of Tables
Table 01: Global Waste-to-energy Market Volume (Thousand Tons) Forecast, by Waste Type, 2017–2026
Table 02: Global Waste-to-energy Market Value (US$ Mn) Forecast, by Waste Type, 2017–2026
Table 03: Global Waste-to-energy Market Volume (Thousand Tons) Forecast, by Technology, 2017–2026
Table 04: Global Waste-to-energy Market Value (US$ Mn) Forecast, by Technology, 2017–2026
Table 05: Global Waste-to-energy Market Volume (Thousand Tons) Forecast, by Application, 2017–2026
Table 06: Global Waste-to-energy Market Value (US$) Forecast, by Application, 2017–2026
Table 07: Global Waste-to-energy Market Volume (Thousand Tons) Forecast, by Region, 2017–2026
Table 08: Global Waste-to-energy Market Value (US$ Mn) Forecast, by Region, 2017–2026
Table 09: North America Waste-to-energy Market Volume (Thousand Tons) Forecast, by Country, 2017–2026
Table 10: North America Waste-to-energy Market Value (US$ Mn) Forecast, by Country, 2017–2026
Table 11: North America Waste-to-energy Market Volume (Thousand Tons) Forecast, by Waste Type, 2017–2026
Table 12: North America Waste-to-energy Market Value (US$ Mn) Forecast, by Waste Type, 2017–2026
Table 13: North America Waste-to-energy Market Volume (Thousand Tons) Forecast, by Technology, 2017–2026
Table 14: North America Waste-to-energy Market Value (US$ Mn) Forecast, by Technology, 2017–2026
Table 15: North America Waste-to-energy Market Volume (Thousand Tons) Forecast, by Application, 2017–2026
Table 16: North America Waste-to-energy Market Value (US$ Mn) Forecast, by Application, 2017–2026
Table 17: U.S. Waste-to-energy Market Volume (Thousand Tons) Forecast, by Waste Type, 2017–2026
Table 18: U.S. Waste-to-energy Market Value (US$ Mn) Forecast, by Waste Type, 2017–2026
Table 19: U.S. Waste-to-energy Market Volume (Thousand Tons) Forecast, by Technology, 2017–2026
Table 20: U.S. Waste-to-energy Market Value (US$ Mn) Forecast, by Technology, 2017–2026
Table 21: U.S. Waste-to-energy Market Volume (Thousand Tons) Forecast, by Application, 2017–2026
Table 22: U.S. Waste-to-energy Market Value (US$ Mn) Forecast, by Application, 2017–2026
Table 23: Canada Waste-to-energy Market Volume (Thousand Tons) Forecast, by Waste Type, 2017–2026
Table 24: Canada Waste-to-energy Market Value (US$ Mn) Forecast, by Waste Type, 2017–2026
Table 25: Canada Waste-to-energy Market Volume (Thousand Tons) Forecast, by Technology, 2017–2026
Table 26: Canada Waste-to-energy Market Value (US$ Mn) Forecast, by Technology, 2017–2026
Table 27: Canada Waste-to-energy Market Volume (Thousand Tons) Forecast, by Application, 2017–2026
Table 28: Canada Waste-to-energy Market Value (US$ Mn) Forecast, by Application, 2017–2026
Table 29: Europe Waste-to-energy Market Volume (Thousand Tons) Forecast, by Country and Sub-region, 2017–2026
Table 30: Europe Waste-to-energy Market Value (US$ Mn) Forecast, by Country and Sub-region, 2017–2026
Table 31: Europe Waste-to-energy Market Volume (Thousand Tons) Forecast, by Waste Type, 2017–2026
Table 32: Europe Waste-to-energy Market Value (US$ Mn) Forecast, by Waste Type, 2017–2026
Table 33: Europe Waste-to-energy Market Volume (Thousand Tons) Forecast, by Technology, 2017–2026
Table 34: Europe Waste-to-energy Market Value (US$ Mn) Forecast, by Technology, 2017–2026
Table 35: Europe Waste-to-energy Market Volume (Thousand Tons) Forecast, by Application, 2017–2026
Table 36: Europe Waste-to-energy Market Value (US$ Mn) Forecast, by Application, 2017–2026
Table 37: Germany Waste-to-energy Market Volume (Thousand Tons) Forecast, by Waste Type, 2017–2026
Table 38: Germany Waste-to-energy Market Value (US$ Mn) Forecast, by Waste Type, 2017–2026
Table 39: Germany Waste-to-energy Market Volume (Thousand Tons) Forecast, by Technology, 2017–2026
Table 40: Germany Waste-to-energy Market Value (US$ Mn) Forecast, by Technology, 2017–2026
Table 41: Germany Waste-to-energy Market Volume (Thousand Tons) Forecast, by Application, 2017–2026
Table 42: Germany Waste-to-energy Market Value (US$ Mn) Forecast, by Application, 2017–2026
Table 43: U.K. Waste-to-energy Market Volume (Thousand Tons) Forecast, by Waste Type, 2017–2026
Table 44: U.K. Waste-to-energy Market Value (US$ Mn) Forecast, by Waste Type, 2017–2026
Table 45: U.K. Waste-to-energy Market Volume (Thousand Tons) Forecast, by Technology, 2017–2026
Table 46: U.K. Waste-to-energy Market Value (US$ Mn) Forecast, by Technology, 2017–2026
Table 47: U.K. Waste-to-energy Market Volume (Thousand Tons) Forecast, by Application, 2017–2026
Table 48: U.K. Waste-to-energy Market Value (US$ Mn) Forecast, by Application, 2017–2026
Table 49: France Waste-to-energy Market Volume (Thousand Tons) Forecast, by Waste Type, 2017–2026
Table 50: France Waste-to-energy Market Value (US$ Mn) Forecast, by Waste Type, 2017–2026
Table 51: France Waste-to-energy Market Volume (Thousand Tons) Forecast, by Technology, 2017–2026
Table 52: France Waste-to-energy Market Value (US$ Mn) Forecast, by Technology, 2017–2026
Table 53: France Waste-to-energy Market Volume (Thousand Tons) Forecast, by Application, 2017–2026
Table 54: France Waste-to-energy Market Value (US$ Mn) Forecast, by Application, 2017–2026
Table 55: Italy Waste-to-energy Market Volume (Thousand Tons) Forecast, by Waste Type, 2017–2026
Table 56: Italy Waste-to-energy Market Value (US$ Mn) Forecast, by Waste Type, 2017–2026
Table 57: Italy Waste-to-energy Market Volume (Thousand Tons) Forecast, by Technology, 2017–2026
Table 58: Italy Waste-to-energy Market Value (US$ Mn) Forecast, by Technology, 2017–2026
Table 59: Italy Waste-to-energy Market Volume (Thousand Tons) Forecast, by Application, 2017–2026
Table 60: Italy Waste-to-energy Market Value (US$ Mn) Forecast, by Application, 2017–2026
Table 61: Sweden Waste-to-energy Market Volume (Thousand Tons) Forecast, by Waste Type, 2017–2026
Table 62: Sweden Waste-to-energy Market Value (US$ Mn) Forecast, by Waste Type, 2017–2026
Table 63: Sweden Waste-to-energy Market Volume (Thousand Tons) Forecast, by Technology, 2017–2026
Table 64: Sweden Waste-to-energy Market Value (US$ Mn) Forecast, by Technology, 2017–2026
Table 65: Sweden Waste-to-energy Market Volume (Thousand Tons) Forecast, by Application, 2017–2026
Table 66: Sweden Waste-to-energy Market Value (US$ Mn) Forecast, by Application, 2017–2026
Table 67: Switzerland Waste-to-energy Market Volume (Thousand Tons) Forecast, by Waste Type, 2017–2026
Table 68: Switzerland Waste-to-energy Market Value (US$ Mn) Forecast, by Waste Type, 2017–2026
Table 69: Switzerland Waste-to-energy Market Volume (Thousand Tons) Forecast, by Technology, 2017–2026
Table 70: Switzerland Waste-to-energy Market Value (US$ Mn) Forecast, by Technology, 2017–2026
Table 71: Switzerland Waste-to-energy Market Volume (Thousand Tons) Forecast, by Application, 2017–2026
Table 72: Switzerland Waste-to-energy Market Value (US$ Mn) Forecast, by Application, 2017–2026
Table 73: Netherlands Waste-to-energy Market Volume (Thousand Tons) Forecast, by Waste Type, 2017–2026
Table 74: Netherlands Waste-to-energy Market Value (US$ Mn) Forecast, by Waste Type, 2017–2026
Table 75: Netherlands Waste-to-energy Market Volume (Thousand Tons) Forecast, by Technology, 2017–2026
Table 76: Netherlands Waste-to-energy Market Value (US$ Mn) Forecast, by Technology, 2017–2026
Table 77: Netherlands Waste-to-energy Market Volume (Thousand Tons) Forecast, by Application, 2017–2026
Table 78: Netherlands Waste-to-energy Market Value (US$ Mn) Forecast, by Application, 2017–2026
Table 79: Belgium Waste-to-energy Market Volume (Thousand Tons) Forecast, by Waste Type, 2017–2026
Table 80: Belgium Waste-to-energy Market Value (US$ Mn) Forecast, by Waste Type, 2017–2026
Table 81: Belgium Waste-to-energy Market Volume (Thousand Tons) Forecast, by Technology, 2017–2026
Table 82: Belgium Waste-to-energy Market Value (US$ Mn) Forecast, by Technology, 2017–2026
Table 83: Belgium Waste-to-energy Market Volume (Thousand Tons) Forecast, by Application, 2017–2026
Table 84: Belgium Waste-to-energy Market Value (US$ Mn) Forecast, by Application, 2017–2026
Table 85: Spain Waste-to-energy Market Volume (Thousand Tons) Forecast, by Waste Type, 2017–2026
Table 86: Spain Waste-to-energy Market Value (US$ Mn) Forecast, by Waste Type, 2017–2026
Table 87: Spain Waste-to-energy Market Volume (Thousand Tons) Forecast, by Technology, 2017–2026
Table 88: Spain Waste-to-energy Market Value (US$ Mn) Forecast, by Technology, 2017–2026
Table 89: Spain Waste-to-energy Market Volume (Thousand Tons) Forecast, by Application, 2017–2026
Table 90: Spain Waste-to-energy Market Value (US$ Mn) Forecast, by Application, 2017–2026
Table 91: Rest of Europe Waste-to-energy Market Volume (Thousand Tons) Forecast, by Waste Type, 2017–2026
Table 92: Rest of Europe Waste-to-energy Market Value (US$ Mn) Forecast, by Waste Type, 2017–2026
Table 93: Rest of Europe Waste-to-energy Market Volume (Thousand Tons) Forecast, by Technology, 2017–2026
Table 94: Rest of Europe Waste-to-energy Market Value (US$ Mn) Forecast, by Technology, 2017–2026
Table 95: Rest of Europe Waste-to-energy Market Volume (Thousand Tons) Forecast, by Application, 2017–2026
Table 96: Rest of Europe Waste-to-energy Market Value (US$ Mn) Forecast, by Application, 2017–2026
Table 97: Asia Pacific Waste-to-energy Market Volume (Thousand Tons) Forecast, by Country and Sub-region, 2017–2026
Table 98: Asia Pacific Waste-to-energy Market Value (US$ Mn) Forecast, by Country and Sub-region, 2017–2026
Table 99: Asia Pacific Waste-to-energy Market Volume (Thousand Tons) Forecast, by Waste Type, 2017–2026
Table 100: Asia Pacific Waste-to-energy Market Value (US$ Mn) Forecast, by Waste Type, 2017–2026
Table 101: Asia Pacific Waste-to-energy Market Volume (Thousand Tons) Forecast, by Technology, 2017–2026
Table 102: Asia Pacific Waste-to-energy Market Value (US$ Mn) Forecast, by Technology, 2017–2026
Table 103: Asia Pacific Waste-to-energy Market Volume (Thousand Tons) Forecast, by Application, 2017–2026
Table 104: Asia Pacific Waste-to-energy Market Value (US$ Mn) Forecast, by Application, 2017–2026
Table 105: China Waste-to-energy Market Volume (Thousand Tons) Forecast, by Waste Type, 2017–2026
Table 106: China Waste-to-energy Market Value (US$ Mn) Forecast, by Waste Type, 2017–2026
Table 107: China Waste-to-energy Market Volume (Thousand Tons) Forecast, by Technology, 2017–2026
Table 108: China Waste-to-energy Market Value (US$ Mn) Forecast, by Technology, 2017–2026
Table 109: China Waste-to-energy Market Volume (Thousand Tons) Forecast, by Application, 2017–2026
Table 110: China Waste-to-energy Market Value (US$ Mn) Forecast, by Application, 2017–2026
Table 111: Japan Waste-to-energy Market Volume (Thousand Tons) Forecast, by Waste Type, 2017–2026
Table 112: Japan Waste-to-energy Market Value (US$ Mn) Forecast, by Waste Type, 2017–2026
Table 113: Japan Waste-to-energy Market Volume (Thousand Tons) Forecast, by Technology, 2017–2026
Table 114: Japan Waste-to-energy Market Value (US$ Mn) Forecast, by Technology, 2017–2026
Table 115: Japan Waste-to-energy Market Volume (Thousand Tons) Forecast, by Application, 2017–2026
Table 116: Japan Waste-to-energy Market Value (US$ Mn) Forecast, by Application, 2017–2026
Table 117: South Korea Waste-to-energy Market Volume (Thousand Tons) Forecast, by Waste Type, 2017–2026
Table 118: South Korea Waste-to-energy Market Value (US$ Mn) Forecast, by Waste Type, 2017–2026
Table 119: South Korea Waste-to-energy Market Volume (Thousand Tons) Forecast, by Technology, 2017–2026
Table 120: South Korea Waste-to-energy Market Value (US$ Mn) Forecast, by Technology, 2017–2026
Table 121: South Korea Waste-to-energy Market Volume (Thousand Tons) Forecast, by Application, 2017–2026
Table 122: South Korea Waste-to-energy Market Value (US$ Mn) Forecast, by Application, 2017–2026
Table 123: Australia Waste-to-energy Market Volume (Thousand Tons) Forecast, by Waste Type, 2017–2026
Table 124: Australia Waste-to-energy Market Value (US$ Mn) Forecast, by Waste Type, 2017–2026
Table 125: Australia Waste-to-energy Market Volume (Thousand Tons) Forecast, by Technology, 2017–2026
Table 126: Australia Waste-to-energy Market Value (US$ Mn) Forecast, by Technology, 2017–2026
Table 127: Australia Waste-to-energy Market Volume (Thousand Tons) Forecast, by Application, 2017–2026
Table 128: Australia Waste-to-energy Market Value (US$ Mn) Forecast, by Application, 2017–2026
Table 129: ASEAN Waste-to-energy Market Volume (Thousand Tons) Forecast, by Waste Type, 2017–2026
Table 130: ASEAN Waste-to-energy Market Value (US$ Mn) Forecast, by Waste Type, 2017–2026
Table 131: ASEAN Waste-to-energy Market Volume (Thousand Tons) Forecast, by Technology, 2017–2026
Table 132: ASEAN Waste-to-energy Market Value (US$ Mn) Forecast, by Technology, 2017–2026
Table 133: ASEAN Waste-to-energy Market Volume (Thousand Tons) Forecast, by Application, 2017–2026
Table 134: ASEAN Waste-to-energy Market Value (US$ Mn) Forecast, by Application, 2017–2026
Table 135: Rest of Asia Pacific Waste-to-energy Market Volume (Thousand Tons) Forecast, by Waste Type, 2017–2026
Table 136: Rest of Asia Pacific Waste-to-energy Market Value (US$ Mn) Forecast, by Waste Type, 2017–2026
Table 137: Rest of Asia Pacific Waste-to-energy Market Volume (Thousand Tons) Forecast, by Technology, 2017–2026
Table 138: Rest of Asia Pacific Waste-to-energy Market Value (US$ Mn) Forecast, by Technology, 2017–2026
Table 139: Rest of Asia Pacific Waste-to-energy Market Volume (Thousand Tons) Forecast, by Application, 2017–2026
Table 140: Rest of Asia Pacific Waste-to-energy Market Value (US$ Mn) Forecast, by Application, 2017–2026
Table 141: Latin America Waste-to-energy Market Volume (Thousand Tons) Forecast, by Country and Sub-region, 2017–2026
Table 142: Latin America Waste-to-energy Market Value (US$ Mn) Forecast, by Country and Sub-region, 2017–2026
Table 143: Latin America Waste-to-energy Market Volume (Thousand Tons) Forecast, by Waste Type, 2017–2026
Table 144: Latin America Waste-to-energy Market Value (US$ Mn) Forecast, by Waste Type, 2017–2026
Table 145: Latin America Waste-to-energy Market Volume (Thousand Tons) Forecast, by Technology, 2017–2026
Table 146: Latin America Waste-to-energy Market Value (US$ Mn) Forecast, by Technology, 2017–2026
Table 147: Latin America Waste-to-energy Market Volume (Thousand Tons) Forecast, by Application, 2017–2026
Table 148: Latin America Waste-to-energy Market Value (US$ Mn) Forecast, by Application, 2017–2026
Table 149: Brazil Waste-to-energy Market Volume (Thousand Tons) Forecast, by Waste Type, 2017–2026
Table 150: Brazil Waste-to-energy Market Value (US$ Mn) Forecast, by Waste Type, 2017–2026
Table 151: Brazil Waste-to-energy Market Volume (Thousand Tons) Forecast, by Technology, 2017–2026
Table 152: Brazil Waste-to-energy Market Value (US$ Mn) Forecast, by Technology, 2017–2026
Table 153: Brazil Waste-to-energy Market Volume (Thousand Tons) Forecast, by Application, 2017–2026
Table 154: Brazil Waste-to-energy Market Value (US$ Mn) Forecast, by Application, 2017–2026
Table 155: Mexico Waste-to-energy Market Volume (Thousand Tons) Forecast, by Waste Type, 2017–2026
Table 156: Mexico Waste-to-energy Market Value (US$ Mn) Forecast, by Waste Type, 2017–2026
Table 157: Mexico Waste-to-energy Market Volume (Thousand Tons) Forecast, by Technology, 2017–2026
Table 158: Mexico Waste-to-energy Market Value (US$ Mn) Forecast, by Technology, 2017–2026
Table 159: Mexico Waste-to-energy Market Volume (Thousand Tons) Forecast, by Application, 2017–2026
Table 160: Mexico Waste-to-energy Market Value (US$ Mn) Forecast, by Application, 2017–2026
Table 161: Rest of Latin America Waste-to-energy Market Volume (Thousand Tons) Forecast, by Waste Type, 2017–2026
Table 162: Rest of Latin America Waste-to-energy Market Value (US$ Mn) Forecast, by Waste Type, 2017–2026
Table 163: Rest of Latin America Waste-to-energy Market Volume (Thousand Tons) Forecast, by Technology, 2017–2026
Table 164: Rest of Latin America Waste-to-energy Market Value (US$ Mn) Forecast, by Technology, 2017–2026
Table 165: Rest of Latin America Waste-to-energy Market Volume (Thousand Tons) Forecast, by Application, 2017–2026
Table 166: Rest of Latin America Waste-to-energy Market Value (US$ Mn) Forecast, by Application, 2017–2026
Table 167: Middle East & Africa Waste-to-energy Market Volume (Thousand Tons) Forecast, by Country and Sub-region, 2017–2026
Table 168: Middle East & Africa Waste-to-energy Market Value (US$ Mn) Forecast, by Country and Sub-region, 2017–2026
Table 169: Middle East & Africa Waste-to-energy Market Volume (Thousand Tons) Forecast, by Waste Type, 2017–2026
Table 170: Middle East & Africa Waste-to-energy Market Value (US$ Mn) Forecast, by Waste Type, 2017–2026
Table 171: Middle East & Africa Waste-to-energy Market Volume (Thousand Tons) Forecast, by Technology, 2017–2026
Table 172: Middle East & Africa Waste-to-energy Market Value (US$ Mn) Forecast, by Technology, 2017–2026
Table 173: Middle East & Africa Waste-to-energy Market Volume (Thousand Tons) Forecast, by Application, 2017–2026
Table 174: Middle East & Africa Waste-to-energy Market Value (US$ Mn) Forecast, by Application, 2017–2026
Table 175: GCC Waste-to-energy Market Volume (Thousand Tons) Forecast, by Waste Type, 2017–2026
Table 176: GCC Waste-to-energy Market Value (US$ Mn) Forecast, by Waste Type, 2017–2026
Table 177: GCC Waste-to-energy Market Volume (Thousand Tons) Forecast, by Technology, 2017–2026
Table 178: GCC Waste-to-energy Market Value (US$ Mn) Forecast, by Technology, 2017–2026
Table 179: GCC Waste-to-energy Market Volume (Thousand Tons) Forecast, by Application, 2017–2026
Table 180: GCC Waste-to-energy Market Value (US$ Mn) Forecast, by Application, 2017–2026
Table 181: Rest of Middle East & Africa Waste-to-energy Market Volume (Thousand Tons) Forecast, by Waste Type, 2017–2026
Table 182: Rest of Middle East & Africa Waste-to-energy Market Value (US$ Mn) Forecast, by Waste Type, 2017–2026
Table 183: Rest of Middle East & Africa Waste-to-energy Market Volume (Thousand Tons) Forecast, by Technology, 2017–2026
Table 184: Rest of Middle East & Africa Waste-to-energy Market Value (US$ Mn) Forecast, by Technology, 2017–2026
Table 185: Rest of Middle East & Africa Waste-to-energy Market Volume (Thousand Tons) Forecast, by Application, 2017–2026
Table 186: Rest of Middle East & Africa Waste-to-energy Market Value (US$ Mn) Forecast, by Application, 2017–2026
List of Figures
Figure 01: Global Waste-to-energy Market Value Share Analysis, by Waste Type, 2017 and 2026
Figure 02: Global Waste-to-energy Market Attractiveness Analysis, by Waste Type
Figure 03: Global Waste-to-energy Market Value Share Analysis, by Technology, 2017 and 2026
Figure 04: Global Waste-to-energy Market Attractiveness Analysis, by Technology
Figure 05: Global Waste-to-energy Market Value Share Analysis, by Application, 2017 and 2026
Figure 06: Global Waste-to-energy Market Attractiveness Analysis, by Application
Figure 07: Global Waste-to-energy Market Value Share Analysis, by Region, 2017 and 2026
Figure 08: Global Waste-to-energy Market Attractiveness Analysis, by Region
Figure 09: North America Waste-to-energy Market Value Share Analysis, by Country, 2017 and 2026
Figure 10: North America Waste-to-energy Market Attractiveness Analysis, by Waste Type
Figure 11: North America Waste-to-energy Market Attractiveness Analysis, by Technology
Figure 12: North America Waste-to-energy Market Attractiveness Analysis, by Application
Figure 13: Europe Waste-to-energy Market Value Share Analysis, by Country and Sub-region, 2017 and 2026
Figure 14: Europe Waste-to-energy Market Attractiveness Analysis, by Waste Type
Figure 15: Europe Waste-to-energy Market Attractiveness Analysis, by Technology
Figure 16: Europe Waste-to-energy Market Attractiveness Analysis, by Application
Figure 17: Asia Pacific Waste-to-energy Market Value Share Analysis, by Country and Sub-region, 2017 and 2026
Figure 18: Asia Pacific Waste-to-energy Market Attractiveness Analysis, by Waste Type
Figure 19: Asia Pacific Waste-to-energy Market Attractiveness Analysis, by Technology
Figure 20: Asia Pacific Waste-to-energy Market Attractiveness Analysis, by Application
Figure 21: Latin America Waste-to-energy Market Value Share Analysis, by Country and Sub-region, 2017 and 2026
Figure 22: Latin America Waste-to-energy Market Attractiveness Analysis, by Waste Type
Figure 23: Latin America Waste-to-energy Market Attractiveness Analysis, by Technology
Figure 24: Latin America Waste-to-energy Market Attractiveness Analysis, by Application
Figure 25: Middle East & Africa Waste-to-energy Market Value Share Analysis, by Country and Sub-region, 2017 and 2026
Figure 26: Middle East & Africa Waste-to-energy Market Attractiveness Analysis, by Waste Type
Figure 27: Middle East & Africa Waste-to-energy Market Attractiveness Analysis, by Technology
Figure 28: Middle East & Africa Waste-to-energy Market Attractiveness Analysis, by Application
Copyright © Transparency Market Research, Inc. All Rights reserved
Trust Online

Waste to Energy Market (Forecast, 2022-2031)