
Reports
Reports
Analysts’ Viewpoint on Virtual Reality in Gaming Market Scenario
Rise in disposable income and advancements in gaming technologies, such as interactive graphics, 3D effects, and motion tracking, are driving the global virtual reality in gaming market size. Users are looking for new entertainment sources and VR gaming systems due to the rise in disposable income. Virtual reality in gaming refers to applications where users interact with a 3D (three-dimensional) environment during gameplay. These experiences are made possible due to interactive features and graphics offered by virtual reality in gaming devices. Increase in demand for VR gaming accessories is also propelling the market. VR gaming technology accessories include wireless controllers, gloves, head-mounted displays, motion-sensing devices, and bodysuits furnished with cutting-edge motion sensors. Key players in the market are focused on R&D in gaming software, hardware, and content based on AI and the Internet of Things (IoT).
Virtual reality game system is a term used to describe a new generation of computer games integrated with virtual and augmented reality that offers players a truly immersive, first-person perspective of gameplay. Participants can experience and influence the game environment through various VR gaming devices and accessories, including VR headsets, sensor-equipped gloves, and hand controllers.
R&D of new technologies, such as Full High Definition (FHD), Ultra-High Definition (UHD), and 4K displays, have boosted the adoption of TVs for watching movies and playing games. Rise in investments in advanced technologies has also contributed to the growth of virtual reality in the gaming industry. VR in gaming offers a realistic representation of gameplay, which makes it more intuitive and lucrative for players. 3D gaming glasses can help achieve the feeling of real presence in five aspects including interaction, emotions, immersion, real-time, and cognitive science. Oculus Rift 3D gaming glasses are equipped with two HD screens for both eyes and offer a better view during gameplay.
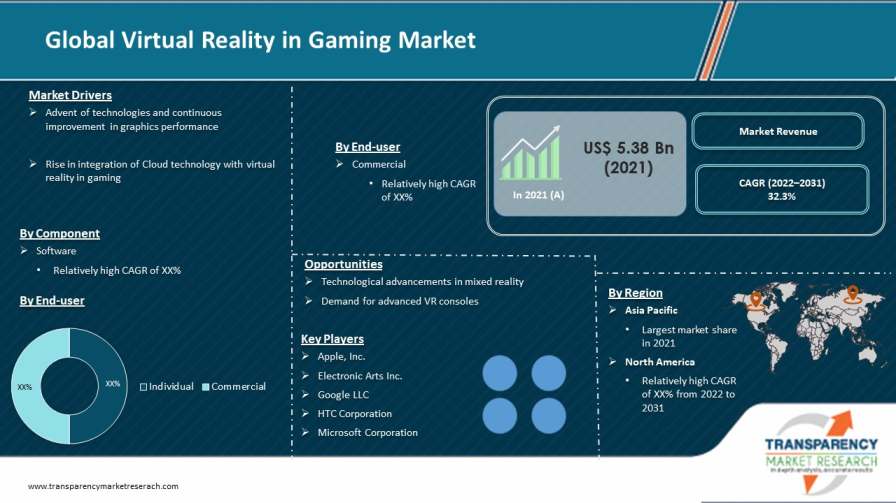
Continuous improvement in graphics performance is expected to drive the future of VR gaming industry. Gaming companies are using powerful graphic processors to integrate virtual and imaginary environments in order to offer the best VR games. Graphics play a vital role in offering a realistic gaming experiences. Technologies such as 3D effects and interactive graphics provide real-time experience to users during gameplays and in VR walking platforms.
Companies operating in the market are adopting cloud technology to offer enhanced gaming experience. Cloud technology enables the modification of gaming libraries and stores games for instant access to user profiles. Additionally, the technology offers an inclusive range of features including live streaming, unlimited storage capability, and connected devices, thereby propelling the future of online gaming industry. Cloud reduces the demand for high-cost offline gaming DVDs and disks. The high initial cost of buying high-end gaming equipment is a major deterrent to numerous gamers; however with recent innovations in cloud computing technology, this is no longer the case. Gamers have unlimited access to critical computing resources on-demand (processing and storage) through cloud gaming, enabling them to play high-end games online, even on very low-end consoles. Thus, the integration of cloud technology in VR gaming is propelling the market.
North America held a dominant share of the global virtual reality in gaming market in 2021. It is expected to maintain its dominance during the forecast period. Growth of the market in the region can be ascribed to the rise in demand for advanced VR gaming consoles empowered with technologies such as VR/AR, 8K, and 4K resolutions, IoT, cloud streaming, and 3D graphics. The U.S. and Canada contribute significantly to the market in North America. The U.S. is expected to hold more than half the share of the market in North America during the forecast period.
Europe follows North America in terms of the revenue share of the global virtual reality in gaming market. Demand for virtual reality in gaming in the region is majorly driven by countries in Western Europe; however, Eastern Europe is witnessing a significant rise in the adoption of virtual reality in gaming.
The virtual reality in gaming market in Asia Pacific is anticipated to grow at a significant pace during the forecast period due to increase in disposable income and rise in the popularity of VR gaming and mixed reality in gaming in the region. The United Arab Emirates (UAE) is the regional leader in the virtual reality in gaming market in Middle East & Africa. Several startups are developing VR products in the UAE; therefore, it offers an attractive opportunity for the market in the region.
The global virtual reality in gaming market is consolidated with a few large-scale vendors controlling a majority of the market share. Most firms are significantly investing in comprehensive research and development to enhance their market share. Expansion of product portfolios and mergers and acquisitions are prominent strategies adopted by key players. Key players in the market are also investing in the development of advanced virtual reality hardware based on GPU-as-a-service cloud capabilities. Apple, Inc., bHaptic, Inc., Electronic Arts Inc., Google LLC, HTC Corporation, Juego Studio Pvt. Ltd., Magic Leap, Inc., Microsoft Corporation, Nintendo Co., Ltd., Nvidia Corporation, Oculus VR LLC, Qualcomm, Inc., Samsung Electronics Co.Ltd., Sony Corporation, Survios, Inc., Teslasuit, Ubisoft Entertainment SA, Unity Technologies, Virtuix OBni, and VirZoom Inc. are the prominent entities operating in the market.
Each of these players has been profiled in the virtual reality in gaming market report based on parameters such as company overview, financial overview, business strategies, product portfolio, business segments, and recent developments.
|
Attribute |
Detail |
|
Market Size (Value) in 2021 |
US$ 5.38 Bn |
|
Market Forecast Value in 2031 |
US$ 86.22 Bn |
|
Growth Rate (CAGR) |
32.3% |
|
Forecast Period |
2022–2031 |
|
Historical Data Available |
2017–2020 |
|
Quantitative Units |
US$ Bn for Value |
|
Market Analysis |
Includes cross-segment analysis at global as well as regional level. Furthermore, qualitative analysis includes drivers, restraints, opportunities, key trends, Porter’s Five Forces analysis, value chain analysis, and key trend analysis. |
|
Competition Landscape |
|
|
Format |
Electronic (PDF) + Excel |
|
Market Segmentation |
|
|
Regions Covered |
|
|
Countries Covered |
|
|
Companies Profiled |
|
|
Customization Scope |
Available upon request |
|
Pricing |
Available upon request |
The global virtual reality in gaming market is expected to reach US$ 86.22 Bn by 2031
The global virtual reality in gaming market is estimated to grow at a CAGR of 32.3% during the forecast period
Advent of technologies and continuous improvement in graphics performance
North America is more attractive for vendors in the global virtual reality in gaming market
Apple, Inc., bHaptic, Inc., Electronic Arts Inc., Google LLC, HTC Corporation, Juego Studio Pvt. Ltd., Magic Leap, Inc., Microsoft Corporation, Nintendo Co., Ltd., Nvidia Corporation, Qualcomm, Inc., Samsung Electronics Co.Ltd., Sony Corporation, Survios, Inc., Teslasuit, Unity Technologies, Virtuix Omni, and VirZoom Inc.
1. Preface
1.1. Market Introduction
1.2. Market Segmentation
1.3. Key Research Objectives
2. Assumptions and Research Methodology
2.1. Research Methodology
2.1.1. List of Primary and Secondary Sources
2.2. Key Assumptions for Data Modelling
3. Executive Summary: Global Virtual Reality in Gaming Market
4. Market Overview
4.1. Market Definition
4.2. Technology/ Product Roadmap
4.3. Market Factor Analysis
4.3.1. Forecast Factors
4.3.2. Ecosystem/ Value Chain Analysis
4.3.3. Market Dynamics (Growth Influencers)
4.3.3.1. Drivers
4.3.3.2. Restraints
4.3.3.3. Opportunities
4.3.3.4. Impact Analysis of Drivers and Restraints
4.4. COVID-19 Impact Analysis
4.4.1. Impact of COVID-19 on Virtual Reality in Gaming Market
4.4.2. End-user Sentiment Analysis: Comparative Analysis on Spending
4.4.2.1. Increase in Spending
4.4.2.2. Decrease in Spending
4.4.3. Short Term and Long Term Impact on the Market
4.5. Market Opportunity Assessment – by Region (North America/ Europe/ Asia Pacific/ Middle East and Africa/ South America)
4.5.1. By Component
4.5.2. By End-user
5. Global Virtual Reality in Gaming Market Analysis and Forecast
5.1. Market Revenue Analysis (US$ Bn), 2016-2031
5.1.1. Historic Growth Trends, 2016-2021
5.1.2. Forecast Trends, 2022-2031
5.2. Pricing Model Analysis/ Price Trend Analysis
6. Global Virtual Reality in Gaming Market Analysis, by Component
6.1. Overview and Definitions
6.2. Key Segment Analysis
6.3. Virtual Reality in Gaming Market Size (US$ Bn) Forecast, by Component, 2018 - 2031
6.3.1. Hardware
6.3.2. Software
6.3.3. Services
7. Global Virtual Reality in Gaming Market Analysis, by End-user
7.1. Key Segment Analysis
7.2. Virtual Reality in Gaming Market Size (US$ Bn) Forecast, by End-user, 2018 - 2031
7.2.1. Individual
7.2.2. Commercial
8. Global Virtual Reality in Gaming Market Analysis and Forecasts, by Region
8.1. Key Findings
8.2. Market Size (US$ Bn) Forecast by Region, 2018-2031
8.2.1. North America
8.2.2. Europe
8.2.3. Asia Pacific
8.2.4. Middle East & Africa
8.2.5. South America
9. North America Virtual Reality in Gaming Market Analysis and Forecast
9.1. Regional Outlook
9.2. Virtual Reality in Gaming Market Size (US$ Bn) Analysis and Forecast, 2018 - 2031
9.2.1. By Component
9.2.2. By End-user
9.3. Virtual Reality in Gaming Market Size (US$ Bn) Forecast, by Country, 2018 - 2031
9.3.1. U.S.
9.3.2. Canada
9.3.3. Mexico
10. Europe Virtual Reality in Gaming Market Analysis and Forecast
10.1. Regional Outlook
10.2. Virtual Reality in Gaming Market Size (US$ Bn) Analysis and Forecast, 2018 - 2031
10.2.1. By Component
10.2.2. By End-user
10.3. Virtual Reality in Gaming Market Size (US$ Bn) Forecast, by Country & Sub-region, 2018 - 2031
10.3.1. Germany
10.3.2. U.K.
10.3.3. France
10.3.4. Italy
10.3.5. Spain
10.3.6. Rest of Europe
11. Asia Pacific Virtual Reality in Gaming Market Analysis and Forecast
11.1. Regional Outlook
11.2. Virtual Reality in Gaming Market Size (US$ Bn) Analysis and Forecast, 2018 - 2031
11.2.1. By Component
11.2.2. By End-user
11.3. Virtual Reality in Gaming Market Size (US$ Bn) Forecast, by Country & Sub-region, 2018 - 2031
11.3.1. China
11.3.2. India
11.3.3. Japan
11.3.4. ASEAN
11.3.5. Rest of Asia Pacific
12. Middle East & Africa Virtual Reality in Gaming Market Analysis and Forecast
12.1. Regional Outlook
12.2. Virtual Reality in Gaming Market Size (US$ Bn) Analysis and Forecast, 2018 - 2031
12.2.1. By Component
12.2.2. By End-user
12.3. Virtual Reality in Gaming Market Size (US$ Bn) Forecast, by Country & Sub-region, 2018 - 2031
12.3.1. Saudi Arabia
12.3.2. United Arab Emirates
12.3.3. South Africa
12.3.4. Rest of Middle East & Africa
13. South America Virtual Reality in Gaming Market Analysis and Forecast
13.1. Regional Outlook
13.2. Virtual Reality in Gaming Market Size (US$ Bn) Analysis and Forecast, 2018 - 2031
13.2.1. By Component
13.2.2. By End-user
13.3. Virtual Reality in Gaming Market Size (US$ Bn) Forecast, by Country & Sub-region, 2018 - 2031
13.3.1. Brazil
13.3.2. Argentina
13.3.3. Rest of South America
14. Competition Landscape
14.1. Market Competition Matrix, by Leading Players
14.2. Market Revenue Share Analysis (%), by Leading Players (2021)
14.3. Competitive Scenario
14.3.1. List of Emerging, Prominent and Leading Players
14.3.2. Major Mergers & Acquisitions, Expansions, Partnership, Contacts, Deals, etc.
15. Company Profiles
15.1. Apple, Inc.
15.1.1. Business Overview
15.1.2. Company Revenue
15.1.3. Product Portfolio
15.1.4. Geographic Footprint
15.1.5. Strategic Partnership, Merger & Acquisition, Business Expansion, New Product Launch, Innovation etc.
15.2. bHaptic, Inc.
15.2.1. Business Overview
15.2.2. Company Revenue
15.2.3. Product Portfolio
15.2.4. Geographic Footprint
15.2.5. Strategic Partnership, Merger & Acquisition, Business Expansion, New Product Launch, Innovation etc.
15.3. Electronic Arts Inc.
15.3.1. Business Overview
15.3.2. Company Revenue
15.3.3. Product Portfolio
15.3.4. Geographic Footprint
15.3.5. Strategic Partnership, Merger & Acquisition, Business Expansion, New Product Launch, Innovation etc.
15.4. Google LLC
15.4.1. Business Overview
15.4.2. Company Revenue
15.4.3. Product Portfolio
15.4.4. Geographic Footprint
15.4.5. Strategic Partnership, Merger & Acquisition, Business Expansion, New Product Launch, Innovation etc.
15.5. HTC Corporation
15.5.1. Business Overview
15.5.2. Company Revenue
15.5.3. Product Portfolio
15.5.4. Geographic Footprint
15.5.5. Strategic Partnership, Merger & Acquisition, Business Expansion, New Product Launch, Innovation etc.
15.6. Juego Studio Pvt. Ltd.
15.6.1. Business Overview
15.6.2. Company Revenue
15.6.3. Product Portfolio
15.6.4. Geographic Footprint
15.6.5. Strategic Partnership, Merger & Acquisition, Business Expansion, New Product Launch, Innovation etc.
15.7. Magic Leap, Inc.
15.7.1. Business Overview
15.7.2. Company Revenue
15.7.3. Product Portfolio
15.7.4. Geographic Footprint
15.7.5. Strategic Partnership, Merger & Acquisition, Business Expansion, New Product Launch, Innovation etc.
15.8. Microsoft Corporation
15.8.1. Business Overview
15.8.2. Company Revenue
15.8.3. Product Portfolio
15.8.4. Geographic Footprint
15.8.5. Strategic Partnership, Merger & Acquisition, Business Expansion, New Product Launch, Innovation etc.
15.9. Nintendo Co., Ltd.
15.9.1. Business Overview
15.9.2. Company Revenue
15.9.3. Product Portfolio
15.9.4. Geographic Footprint
15.9.5. Strategic Partnership, Merger & Acquisition, Business Expansion, New Product Launch, Innovation etc.
15.10. Nvidia Corporation
15.10.1. Business Overview
15.10.2. Company Revenue
15.10.3. Product Portfolio
15.10.4. Geographic Footprint
15.10.5. Strategic Partnership, Merger & Acquisition, Business Expansion, New Product Launch, Innovation etc.
15.11. Qualcomm, Inc.
15.11.1. Business Overview
15.11.2. Company Revenue
15.11.3. Product Portfolio
15.11.4. Geographic Footprint
15.11.5. Strategic Partnership, Merger & Acquisition, Business Expansion, New Product Launch, Innovation etc.
15.12. Samsung Electronics Co. Ltd.
15.12.1. Business Overview
15.12.2. Company Revenue
15.12.3. Product Portfolio
15.12.4. Geographic Footprint
15.12.5. Strategic Partnership, Merger & Acquisition, Business Expansion, New Product Launch, Innovation etc.
15.13. Sony Corporation
15.13.1. Business Overview
15.13.2. Company Revenue
15.13.3. Product Portfolio
15.13.4. Geographic Footprint
15.13.5. Strategic Partnership, Merger & Acquisition, Business Expansion, New Product Launch, Innovation etc.
15.14. Survios, Inc.
15.14.1. Business Overview
15.14.2. Company Revenue
15.14.3. Product Portfolio
15.14.4. Geographic Footprint
15.14.5. Strategic Partnership, Merger & Acquisition, Business Expansion, New Product Launch, Innovation etc.
15.15. Teslasuit
15.15.1. Business Overview
15.15.2. Company Revenue
15.15.3. Product Portfolio
15.15.4. Geographic Footprint
15.15.5. Strategic Partnership, Merger & Acquisition, Business Expansion, New Product Launch, Innovation etc.
15.16. Unity Technologies
15.16.1. Business Overview
15.16.2. Company Revenue
15.16.3. Product Portfolio
15.16.4. Geographic Footprint
15.16.5. Strategic Partnership, Merger & Acquisition, Business Expansion, New Product Launch, Innovation etc.
15.17. Virtuix Omni
15.17.1. Business Overview
15.17.2. Company Revenue
15.17.3. Product Portfolio
15.17.4. Geographic Footprint
15.17.5. Strategic Partnership, Merger & Acquisition, Business Expansion, New Product Launch, Innovation etc.
15.18. VirZoom Inc.
15.18.1. Business Overview
15.18.2. Company Revenue
15.18.3. Product Portfolio
15.18.4. Geographic Footprint
15.18.5. Strategic Partnership, Merger & Acquisition, Business Expansion, New Product Launch, Innovation etc.
16. Key Takeaways
List of Tables
Table 1: Acronyms Used in the Virtual Reality in Gaming Market
Table 2: North America Virtual Reality in Gaming Market Revenue Analysis, by Country, 2022 - 2031 (US$ Bn)
Table 3: Europe Virtual Reality in Gaming Market Revenue Analysis, by Country & Sub-region, 2022 - 2031 (US$ Bn)
Table 4: Asia Pacific Virtual Reality in Gaming Market Revenue Analysis, by Country & Sub-region, 2022 - 2031 (US$ Bn)
Table 5: Middle East & Africa Virtual Reality in Gaming Market Revenue Analysis, by Country & Sub-region, 2021 and 2031 (US$ Bn)
Table 6: South America Virtual Reality in Gaming Market Revenue Analysis, by Country & Sub-region, 2022 - 2031 (US$ Bn)
Table 7: Forecast Factors: Relevance and Impact (1/2)
Table 8: Forecast Factors: Relevance and Impact (2/2)
Table 9: Impact Analysis of Drivers & Restraints
Table 10: List of Companies, Visits Per Minute (VPM), Features, and Pricing
Table 11: List of Companies, Visits Per Minute (VPM), Features, and Pricing
Table 12: Global Virtual Reality in Gaming Market Value (US$ Bn) Forecast, by Component, 2018 – 2031
Table 13: Global Virtual Reality in Gaming Market Value (US$ Bn) Forecast, by End-user, 2022– 2031
Table 14: Global Virtual Reality in Gaming Market Volume (US$ Bn) Forecast, by Region, 2022- 2031
Table 15: North America Virtual Reality in Gaming Market Value (US$ Bn) Forecast, by Component, 2022 – 2031
Table 16: North America Virtual Reality in Gaming Market Value (US$ Bn) Forecast, by End-user, 2018 – 2031
Table 17: North America Virtual Reality in Gaming Market Value (US$ Bn) Forecast, by Country, 2022 - 2031
Table 18: U.S. Virtual Reality in Gaming Market Revenue CAGR Breakdown (%), by Growth Term
Table 19: Canada Virtual Reality in Gaming Market Revenue CAGR Breakdown (%), by Growth Term
Table 20: Mexico Virtual Reality in Gaming Market Revenue CAGR Breakdown (%), by Growth Term
Table 21: Europe Virtual Reality in Gaming Market Value (US$ Bn) Forecast, by Component, 2022 – 2031
Table 22: Europe Virtual Reality in Gaming Market Value (US$ Bn) Forecast, by End-user, 2022– 2031
Table 23: Europe Virtual Reality in Gaming Market Value (US$ Bn) Forecast, by Country & Sub-region, 2022 - 2031
Table 24: Germany Virtual Reality in Gaming Market Revenue CAGR Breakdown (%), by Growth Term
Table 25: U.K. Virtual Reality in Gaming Market Revenue CAGR Breakdown (%), by Growth Term
Table 26: France Virtual Reality in Gaming Market Revenue CAGR Breakdown (%), by Growth Term
Table 27: Italy Virtual Reality in Gaming Market Revenue CAGR Breakdown (%), by Growth Term
Table 28: Spain Virtual Reality in Gaming Market Revenue CAGR Breakdown (%), by Growth Term
Table 29: Asia Pacific Virtual Reality in Gaming Market Value (US$ Bn) Forecast, by Component, 2022 – 2031
Table 30: Asia Pacific Virtual Reality in Gaming Market Value (US$ Bn) Forecast, by End-user, 2022 – 2031
Table 31: Asia Pacific Virtual Reality in Gaming Market Value (US$ Bn) Forecast, by Country & Sub-region, 2022 - 2031
Table 32: China Virtual Reality in Gaming Market Revenue CAGR Breakdown (%), by Growth Term
Table 33: India Virtual Reality in Gaming Market Revenue CAGR Breakdown (%), by Growth Term
Table 34: Japan Virtual Reality in Gaming Market Revenue CAGR Breakdown (%), by Growth Term
Table 35: ASEAN Virtual Reality in Gaming Market Revenue CAGR Breakdown (%), by Growth Term
Table 36: Middle East & Africa Virtual Reality in Gaming Market Value (US$ Bn) Forecast, by Component, 2022 – 2031
Table 37: Middle East & Africa Virtual Reality in Gaming Market Value (US$ Bn) Forecast, by End-user, 22 – 2031
Table 38: Middle East & Africa Virtual Reality in Gaming Market Value (US$ Bn) Forecast, by Country & Sub-region, 2022 - 2031
Table 39: Saudi Arabia Virtual Reality in Gaming Market Revenue CAGR Breakdown (%), by Growth Term
Table 40: The United Arab Emirates Virtual Reality in Gaming Market Revenue CAGR Breakdown (%), by Growth Term
Table 41: South Africa Virtual Reality in Gaming Market Revenue CAGR Breakdown (%), by Growth Term
Table 42: South America Virtual Reality in Gaming Market Value (US$ Bn) Forecast, by Component, 2022 – 2031
Table 43: South America Virtual Reality in Gaming Market Value (US$ Bn) Forecast, by End-user, 2022 – 2031
Table 44: South America Virtual Reality in Gaming Market Value (US$ Bn) Forecast, by Country & Sub-region, 2022 - 2031
Table 45: Brazil Virtual Reality in Gaming Market Revenue CAGR Breakdown (%), by Growth Term
Table 46: Argentina Virtual Reality in Gaming Market Revenue CAGR Breakdown (%), by Growth Term
Table 47: Mergers & Acquisitions, Partnerships (1/2)
Table 48: Mergers & Acquisitions, Partnership (2/2)
List of Figures
Figure 1: Global Virtual Reality in Gaming Market Size (US$ Bn) Forecast, 2018–2031
Figure 2: Global Virtual Reality in Gaming Market Revenue (US$ Bn) Opportunity Assessment, by Region, 2022E
Figure 3: Top Segment Analysis of Virtual Reality in Gaming Market
Figure 4: Global Virtual Reality in Gaming Market Revenue (US$ Bn) Opportunity Assessment, by Region, 2031F
Figure 5: Global Virtual Reality in Gaming Market Attractiveness Assessment, by Component
Figure 6: Global Virtual Reality in Gaming Market Attractiveness Assessment, by End-user
Figure 7: Global Virtual Reality in Gaming Market Attractiveness Assessment, by Region
Figure 8: Global Virtual Reality in Gaming Market Revenue (US$ Bn) Historic Trends, 2016 – 2021
Figure 9: Global Virtual Reality in Gaming Market Revenue Opportunity (US$ Bn) Historic Trends, 2016 – 2021
Figure 10: Global Virtual Reality in Gaming Market Value Share Analysis, by Component, 2022
Figure 11: Global Virtual Reality in Gaming Market Value Share Analysis, by Component, 2031
Figure 12: Global Virtual Reality in Gaming Market Absolute Opportunity (US$ Bn), by Hardware, 2022 – 2031
Figure 13: Global Virtual Reality in Gaming Market Absolute Opportunity (US$ Bn), by Software, 2022 – 2031
Figure 14: Global Virtual Reality in Gaming Market Absolute Opportunity (US$ Bn), by Services, 2022 – 2031
Figure 15: Global Virtual Reality in Gaming Market Value Share Analysis, by End-user, 2022
Figure 16: Global Virtual Reality in Gaming Market Value Share Analysis, by End-user, 2031
Figure 17: Global Virtual Reality in Gaming Market Absolute Opportunity (US$ Bn), by Individual, 2022 – 2031
Figure 18: Global Virtual Reality in Gaming Market Absolute Opportunity (US$ Bn), by Commercial, 2022 – 2031
Figure 19: Global Virtual Reality in Gaming Market Opportunity (US$ Bn), by Region
Figure 20: Global Virtual Reality in Gaming Market Opportunity Share (%), by Region, 2022–2031
Figure 21: Global Virtual Reality in Gaming Market Size (US$ Bn), by Region, 2022 & 2031
Figure 22: Global Virtual Reality in Gaming Market Value Share Analysis, by Region, 2022
Figure 23: Global Virtual Reality in Gaming Market Value Share Analysis, by Region, 2031
Figure 24: North America Virtual Reality in Gaming Market Absolute Opportunity (US$ Bn), 2022 – 2031
Figure 25: Europe Virtual Reality in Gaming Market Absolute Opportunity (US$ Bn), 2022 – 2031
Figure 26: Asia Pacific Virtual Reality in Gaming Market Absolute Opportunity (US$ Bn), 2022 – 2031
Figure 27: Middle East & Africa Virtual Reality in Gaming Market Absolute Opportunity (US$ Bn), 2022 – 2031
Figure 28: South America Virtual Reality in Gaming Market Absolute Opportunity (US$ Bn), 2022 – 2031
Figure 29: North America Virtual Reality in Gaming Market Revenue Opportunity Share, by Component
Figure 30: North America Virtual Reality in Gaming Market Revenue Opportunity Share, by End-user
Figure 31: North America Virtual Reality in Gaming Market Revenue Opportunity Share, by Country
Figure 32: North America Virtual Reality in Gaming Market Value Share Analysis, by Component, 2022
Figure 33: North America Virtual Reality in Gaming Market Value Share Analysis, by Component, 2031
Figure 34: North America Virtual Reality in Gaming Market Absolute Opportunity (US$ Bn), Hardware, 2022 – 2031
Figure 35: North America Virtual Reality in Gaming Market Absolute Opportunity (US$ Bn), by Software, 2022 – 2031
Figure 36: North America Virtual Reality in Gaming Market Absolute Opportunity (US$ Bn), by Services, 2022 – 2031
Figure 37: North America Virtual Reality in Gaming Market Value Share Analysis, by End-user, 2022
Figure 38: North America Virtual Reality in Gaming Market Value Share Analysis, by End-user, 2031
Figure 39: North America Virtual Reality in Gaming Market Absolute Opportunity (US$ Bn), by Individual, 2022 – 2031
Figure 40: North America Virtual Reality in Gaming Market Absolute Opportunity (US$ Bn), by Commercial, 2022 – 2031
Figure 41: North America Virtual Reality in Gaming Market Value Share Analysis, by Country, 2022
Figure 42: North America Virtual Reality in Gaming Market Value Share Analysis, by Country, 2031
Figure 43: U.S. Virtual Reality in Gaming Market Opportunity Growth Analysis (US$ Bn) Forecast, 2022 – 2031
Figure 44: Canada Virtual Reality in Gaming Market Opportunity Growth Analysis (US$ Bn) Forecast, 2022 – 2031
Figure 45: Mexico Virtual Reality in Gaming Market Opportunity Growth Analysis (US$ Bn) Forecast, 2022 – 2031
Figure 46: Europe Virtual Reality in Gaming Market Revenue Opportunity Share, by Component
Figure 47: Europe Virtual Reality in Gaming Market Revenue Opportunity Share, by End-user
Figure 48: Europe Virtual Reality in Gaming Market Revenue Opportunity Share, by Country
Figure 49: Europe Virtual Reality in Gaming Market Value Share Analysis, by Component, 2022
Figure 50: Europe Virtual Reality in Gaming Market Value Share Analysis, by Component, 2031
Figure 51: Europe Virtual Reality in Gaming Market Absolute Opportunity (US$ Bn), by Hardware, 2022 – 2031
Figure 52: Europe Virtual Reality in Gaming Market Absolute Opportunity (US$ Bn), by Software, 2022 – 2031
Figure 53: Europe Virtual Reality in Gaming Market Absolute Opportunity (US$ Bn), by Services, 2022 – 2031
Figure 54: Europe Virtual Reality in Gaming Market Value Share Analysis, by End-user, 2022
Figure 55: Europe Virtual Reality in Gaming Market Value Share Analysis, by End-user, 2031
Figure 56: Europe Virtual Reality in Gaming Market Absolute Opportunity (US$ Bn), by Individual, 2022 – 2031
Figure 57: Europe Virtual Reality in Gaming Market Absolute Opportunity (US$ Bn), by Commercial, 2022 – 2031
Figure 58: Europe Virtual Reality in Gaming Market Value Share Analysis, by Country & Sub-region, 2022
Figure 59: Europe Virtual Reality in Gaming Market Value Share Analysis, by Country & Sub-region, 2031
Figure 60: Germany Virtual Reality in Gaming Market Opportunity Growth Analysis (US$ Bn) Forecast, 2022 – 2031
Figure 61: U.K. Virtual Reality in Gaming Market Opportunity Growth Analysis (US$ Bn) Forecast, 2022 – 2031
Figure 62: France Virtual Reality in Gaming Market Opportunity Growth Analysis (US$ Bn) Forecast, 2022 – 2031
Figure 63: Italy Virtual Reality in Gaming Market Opportunity Growth Analysis (US$ Bn) Forecast, 2022 – 2031
Figure 64: Spain Virtual Reality in Gaming Market Opportunity Growth Analysis (US$ Bn) Forecast, 2022 – 2031
Figure 65: Asia Pacific Virtual Reality in Gaming Market Revenue Opportunity Share, by Component
Figure 66: Asia Pacific Virtual Reality in Gaming Market Revenue Opportunity Share, by End-user
Figure 67: Asia Pacific Virtual Reality in Gaming Market Revenue Opportunity Share, by Country
Figure 68: Asia Pacific Virtual Reality in Gaming Market Value Share Analysis, by Component, 2022
Figure 69: Asia Pacific Virtual Reality in Gaming Market Value Share Analysis, by Component, 2031
Figure 70: Asia Pacific Virtual Reality in Gaming Market Absolute Opportunity (US$ Bn), by Hardware, 2022 – 2031
Figure 71: Asia Pacific Virtual Reality in Gaming Market Absolute Opportunity (US$ Bn), by Software, 2022 – 2031
Figure 72: Asia Pacific Virtual Reality in Gaming Market Absolute Opportunity (US$ Bn), by Services, 2022 – 2031
Figure 73: Asia Pacific Virtual Reality in Gaming Market Value Share Analysis, by End-user, 2022
Figure 74: Asia Pacific Virtual Reality in Gaming Market Value Share Analysis, by End-user, 2031
Figure 75: Asia Pacific Virtual Reality in Gaming Market Absolute Opportunity (US$ Bn), by Individual, 2022 – 2031
Figure 76: Asia Pacific Virtual Reality in Gaming Market Absolute Opportunity (US$ Bn), by Commercial, 2022 – 2031
Figure 77: Asia Pacific Virtual Reality in Gaming Market Value Share Analysis, by Country & Sub-region, 2022
Figure 78: Asia Pacific Virtual Reality in Gaming Market Value Share Analysis, by Country & Sub-region, 2031
Figure 79: China Virtual Reality in Gaming Market Opportunity Growth Analysis (US$ Bn) Forecast, 2022 – 2031
Figure 80: India Virtual Reality in Gaming Market Opportunity Growth Analysis (US$ Bn) Forecast, 2022 – 2031
Figure 81: Japan Virtual Reality in Gaming Market Opportunity Growth Analysis (US$ Bn) Forecast, 2022 – 2031
Figure 82: ASEAN Virtual Reality in Gaming Market Opportunity Growth Analysis (US$ Bn) Forecast, 2022 – 2031
Figure 83: Middle East & Africa Virtual Reality in Gaming Market Revenue Opportunity Share, by Component
Figure 84: Middle East & Africa Virtual Reality in Gaming Market Revenue Opportunity Share, by End-user
Figure 85: Middle East & Africa Virtual Reality in Gaming Market Revenue Opportunity Share, by Country
Figure 86: Middle East & Africa Virtual Reality in Gaming Market Value Share Analysis, by Component, 2022
Figure 87: Middle East & Africa Virtual Reality in Gaming Market Value Share Analysis, by Component, 2031
Figure 88: Middle East & Africa Virtual Reality in Gaming Market Absolute Opportunity (US$ Bn), by Hardware, 2022 – 2031
Figure 89: Middle East & Africa Virtual Reality in Gaming Market Absolute Opportunity (US$ Bn), by Software, 2022 – 2031
Figure 90: Middle East & Africa Virtual Reality in Gaming Market Absolute Opportunity (US$ Bn), by Services, 2022 – 2031
Figure 91: Middle East & Africa Virtual Reality in Gaming Market Value Share Analysis, by End-user, 2022
Figure 92: Middle East & Africa Virtual Reality in Gaming Market Value Share Analysis, by End-user, 2031
Figure 93: Middle East & Africa Virtual Reality in Gaming Market Absolute Opportunity (US$ Bn), by Individual, 2022 – 2031
Figure 94: Middle East & Africa Virtual Reality in Gaming Market Absolute Opportunity (US$ Bn), by Commercial, 2022 – 2031
Figure 95: Middle East & Africa Virtual Reality in Gaming Market Value Share Analysis, by Country & Sub-region, 2022
Figure 96: Middle East & Africa Virtual Reality in Gaming Market Value Share Analysis, by Country & Sub-region, 2031
Figure 97: Saudi Arabia Virtual Reality in Gaming Market Opportunity Growth Analysis (US$ Bn) Forecast, 2022 – 2031
Figure 98: The United Arab Emirates Virtual Reality in Gaming Market Opportunity Growth Analysis (US$ Bn) Forecast, 2022 – 2031
Figure 99: South Africa Virtual Reality in Gaming Market Opportunity Growth Analysis (US$ Bn) Forecast, 2022 – 2031
Figure 100: South America Virtual Reality in Gaming Market Revenue Opportunity Share, by Component
Figure 101: South America Virtual Reality in Gaming Market Revenue Opportunity Share, by End-user
Figure 102: South America Virtual Reality in Gaming Market Revenue Opportunity Share, by Country
Figure 103: South America Virtual Reality in Gaming Market Value Share Analysis, by Component, 2022
Figure 104: South America Virtual Reality in Gaming Market Value Share Analysis, by Component, 2031
Figure 105: South America Virtual Reality in Gaming Market Absolute Opportunity (US$ Bn), by Hardware, 2022 – 2031
Figure 106: South America Virtual Reality in Gaming Market Absolute Opportunity (US$ Bn), by Software, 2022 – 2031
Figure 107: South America Virtual Reality in Gaming Market Absolute Opportunity (US$ Bn), by Services, 2022 – 2031
Figure 108: South America Virtual Reality in Gaming Market Value Share Analysis, by End-user, 2022
Figure 109: South America Virtual Reality in Gaming Market Value Share Analysis, by End-user, 2031
Figure 110: South America Virtual Reality in Gaming Market Absolute Opportunity (US$ Bn), by Individual, 2022 – 2031
Figure 111: South America Virtual Reality in Gaming Market Absolute Opportunity (US$ Bn), by Commercial, 2022 – 2031
Figure 112: South America Virtual Reality in Gaming Market Value Share Analysis, by Country & Sub-region, 2022
Figure 113: South America Virtual Reality in Gaming Market Value Share Analysis, by Country & Sub-region, 2031
Figure 114: Brazil Virtual Reality in Gaming Market Opportunity Growth Analysis (US$ Bn) Forecast, 2022 – 2031
Figure 115: Argentina Virtual Reality in Gaming Market Opportunity Growth Analysis (US$ Bn) Forecast, 2022 – 2031
Copyright © Transparency Market Research, Inc. All Rights reserved
Trust Online

Virtual Reality in Gaming Market