
Reports
Reports
Shifting focus of Metal Processing Companies toward High Capacity Industrial Burners to Drive Global Industrial Burner Market
Industrial furnaces, which are essential elements of heavy-duty industries, are designed to achieve high temperatures in closed systems for the processing of products. Heavy-duty businesses all around the world require high-capacity heating systems to support large-scale manufacturing, from metal melting to heat treatment. Several big metal-processing companies are focusing on high-capacity industrial burners as an alternative to massive, dangerous furnaces. Industrial burners are a preferable alternative since they fulfill the similar task as high-capacity furnaces and reactors, but at a lower cost and with less manufacturing complexities. This factor is likely to drive growth of the global industrial burner market in the years to come.
Need to Regulate Fuel-to-Air Ratio is Estimated to Boost Market Growth
Controlling the fuel-to-air ratio has been a significant problem when utilizing burners in major manufacturing applications for decades. Almost every industrial burner now has an electronic module that allows for fuel-to-air ratio adjustment. The availability of different features such as burner modulation as per the specified fuel-to-air ratio is one of the benefits of new electronic control systems that are substituting conventional relay control. Industrial burners have lambda (AFR) sensors, which allow for extremely accurate surveillance of this ratio in internal combustion activities. These factors are expected to support development of the global industrial burner market in the near future.
Altogether, control panels and stoichiometric sensors and can alter the burner's circuitry to retain the specified operating voltage for combustion as well as heat treatment activities when emission levels rise. In the future years, such factors are expected to have a beneficial influence on the global industrial burner market.
In most industrial processes, energy losses owing to inefficient equipment and mechanical limits are a significant cost component. Improved burner control systems provide plant managers with a substantial chance to increase overall efficiency.
The Industrial Technologies Program of the US Department of Energy discovered that performing routine maintenance as well as substituting underperforming industrial burners can increase combustion performance and quality of products. Regular maintenance and repair can also help to reduce emissions. While the increased demand for such industrial burners produces a balance in terms of their consumption across numerous fuels, manufacturers have challenges in meeting the additional standards for their construction.
The industrial burner market is prognosticated to witness a tremendous growth within the forecast period from 2016 to 2024 owing to the rise in the usage of BMSs or burner management system. This system efficiently deals with the protection from the boilers explosion, and this factor majorly contributes in the growth of global industrial market. The precision, superior performance and efficiency of the industrial burners are also helping in their adoption globally, resulting in an exponential market growth.
Over the next few years, the overall market for industrial burners is probably going to pick up fundamentally on the back of the momentous ascent in the interest for industrial boilers, because of the quick industrialization in developing economies and the far reaching use of these boilers in various ventures, for example, chemicals, sustenance handling, control age, and oil and gas. However, limited availability of skilled labor might have a detrimental effect on the market.
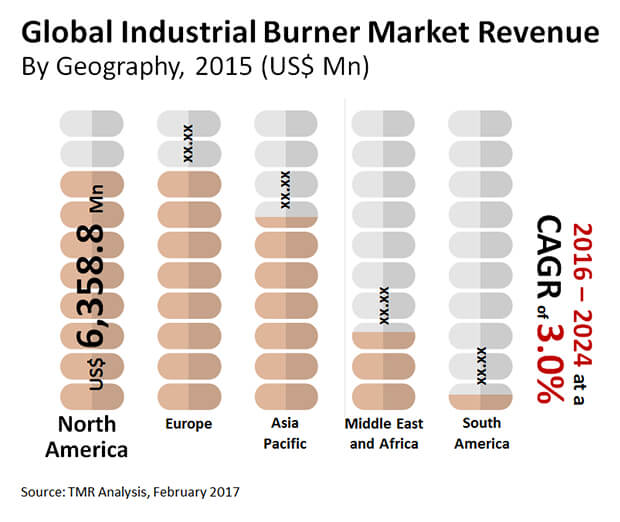
The worldwide industrial burner market was worth US$19.6 bn in year 2015. Expanding at a CAGR of 3.0% within the forecast period from 2016 to 2024, the market is expected to achieve US$25.6 bn before the finish of 2024.
 Increased Implementation of Government Policies to Fuel Market Growth
The minimal effort of work and raw materials in growing regions, for example, Asia Pacific could enable the world industrial burner to market to grandstand a speedier development within the coming years. Moreover, the rising execution of a few government strategies for lessening carbon emission and significant growth in mining and petrochemicals sector have been anticipated to promote industrial burner in Asia Pacific. Regardless of the stunning advancement of the worldwide industrial burner market, there could be some difficulties that are anticipated to hamper the growth. This is because of the cumbersome modification of industrial burners.
Among all the regions, Asia Pacific is expected to emerge as the most important market for industrial burners in the coming years. With a substantial pool of worldwide players setting up their assembling units in India and China, lured by low cost of land and labor and also the affordability of raw materials is anticipated to boost the Asia Pacific industrial burner market in the following couple of years. Developed regions, for example, North America have been estimated to add to the global development of the world industrial burner market in terms of the accessibility of a plentitude of common assets, more prominent profitability, and complex framework. Within a reasonable time-frame, North America could be overwhelmed by Canada and the U.S. where the last is a critical maker of oil and gas over the globe. Contrasted with different nations in North America, the U.S. has been anticipated to display a bigger interest for industrial burner.
ANDRITZ, Alzeta Corp., Baltur S.p.A, Forbes Marshall, Bloom Engineering, Foster Wheeler AG, Limpsfield Combustion Engineering Ltd, Honeywell International Inc., Mitsubishi Hitachi Power Systems Ltd, Osaka Gas Co. Ltd, Oilon, QED Combustion, Wesman Group, and Selas Heat Technology Co. are some of the leading firms dominating the global industrial burner market.
The escalating use of burner management systems around the world and the superior performance of industrial burners may bring extensive growth prospects for the industrial burner market through the assessment period of 2016-2024.
The global Industrial Burner Market was worth US$25.6 bn and is projected to reach a value of US$25.6 bn Mn by the end of 2024
Key players in the global Industrial Burner Market include ANDRITZ, Alzeta Corp., Baltur S.p.A, Forbes Marshall, Bloom Engineering, Foster Wheeler AG, Limpsfield Combustion Engineering Ltd, Honeywell International Inc., Mitsubishi Hitachi Power Systems Ltd, Osaka Gas Co. Ltd, Oilon, QED Combustion, Wesman Group, and Selas Heat Technology Co.
The growing industrial applications of boilers, increasing industrialization in emerging nations, and rise in the demand for industrial boilers have been envisaged to up market growth in the coming years.
The forecast period considered for the Industrial Burner Market is 2016 – 2024
Asia Pacific is more attractive region for vendors in the Industrial Burner Market
1. Preface
1.1. Market Definition and Scope
1.2. Market Segmentation
1.3. Key Research Objectives
1.4. Research Highlights
2. Assumptions and Research Methodology
3. Executive Summary: Global Industrial Burner Market
4. Market Overview
4.1. Industry Developments
4.2. Key Market Indicators
4.2.1. Industrial Boiler Market
4.2.2. Combustion Systems Market
4.3. Market Dynamics
4.3.1. Drivers
4.3.2. Restraints
4.3.3. Opportunity
4.4. Global Industrial Burner Market Analysis and Forecasts, 2014 – 2024
4.4.1. Market Revenue and Volume Projections (US$ Mn and Thousand Units)
4.4.2. Key Findings
4.5. Porter’s Five Forces Analysis
5. Global Industrial Burner Market Analysis and Forecasts, By Fuel Type
5.1. Market Size (US$ Mn and Thousand Units) Forecast By Fuel Type, 2014 – 2024
5.1.1. Oil-based
5.1.1.1. Pressure Jet
5.1.1.2. Swirl
5.1.1.3. Rotary Cup
5.1.1.4. Gun burner
5.1.2. Gas-based
5.1.3. Dual fuel
6. Global Industrial Burner Market Analysis and Forecasts, By Automation
6.1. Market Size (US$ Mn and Thousand Units) Forecast By Automation, 2014 – 2024
6.1.1. Monoblock
6.1.2. Duoblock
7. Global Industrial Burner Market Analysis and Forecasts, By Burner Type
7.1. Definition
7.2. Market Size (US$ Mn and Thousand Units) Forecast By Burner Type, 2014 – 2024
7.2.1. Regenerative Burners (Heat Recovery)
7.2.2. High Velocity Burner
7.2.3. Thermal Radiation
7.2.4. Radiant Burner
7.2.4.1. Wall
7.2.4.2. Tube
7.2.5. Natural Draft
7.2.6. Flat Flame Burner
7.2.7. Line Burner
7.2.8. Customized (Burner Boiler)
7.2.9. Others
8. Global Industrial Burner Market Analysis and Forecasts, By Operating Temperature
8.1. Market Size (US$ Mn and Thousand Units) Forecast By Operating Temperature, 2014 – 2024
8.1.1. High Temperature (> 1400F)
8.1.2. Low Temp (< 1400F)
9. Global Industrial Burner Market Analysis and Forecasts, By Application
9.1. Market Size (US$ Mn and Thousand Units) Forecast By Application, 2014 – 2024
9.1.1. Boilers
9.1.2. Furnace/Oven/Kiln
9.1.3. Air Heating/Drying
9.1.4. Others
10. Global Industrial Burner Market Analysis and Forecasts, By End-Use
10.1. Market Size (US$ Mn and Thousand Units) Forecast By End-Use 2014 – 2024
10.1.1. Petrochemicals (Oil & Gas, Exploration & Refining)
10.1.2. Power Generation
10.1.3. Chemicals & Specialty Chemicals
10.1.4. Mining & Mineral
10.1.5. Metal
10.1.6. Pharmaceutical
10.1.7. Glass
10.1.8. Ceramics
10.1.9. Food Processing
10.1.10. Automotive
10.1.11. Printing & Publishing
10.1.12. Others
10.2. Market Attractiveness by End-Use
11. Global Industrial Burner Market Analysis and Forecasts, By Region
11.1. Key Findings
11.2. Key Trends
11.3. Market Size (US$ Mn and Thousand Units) Forecast By Region, 2014 – 2024
11.3.1. North America
11.3.2. Europe
11.3.3. Asia Pacific
11.3.4. Middle East and Africa
11.3.5. South America
12. Global Industrial Burner Market Attractiveness Analysis
12.1. By Fuel Type
12.2. By Automation
12.3. By Operating Temperature
12.4. By Burner Type
12.5. By Application
12.6. By Industry Vertical
12.7. By Region
13. North America Industrial Burner Market Analysis and Forecast
13.1. Market Size (US$ Mn and Thousand Units) Forecast By Fuel Type, 2014 – 2024
13.1.1. Oil-based
13.1.1.1. Pressure Jet
13.1.1.2. Swirl
13.1.1.3. Rotary Cup
13.1.1.4. Gun burner
13.1.2. Gas-based
13.1.3. Dual fuel
13.2. Market Size (US$ Mn and Thousand Units) Forecast By Automation, 2014 – 2024
13.2.1. Monoblock
13.2.2. Duoblock
13.3. Market Size (US$ Mn and Thousand Units) Forecast By Burner Type, 2014 – 2024
13.3.1. Regenerative Burners (Heat Recovery)
13.3.2. High Velocity Burner
13.3.3. Thermal Radiation
13.3.4. Radiant Burner
13.3.4.1. Wall
13.3.4.2. Tube
13.3.5. Natural Draft
13.3.6. Flat Flame Burner
13.3.7. Line Burner
13.3.8. Customized (Burner Boiler)
13.3.9. Others
13.4. Market Size (US$ Mn and Thousand Units) Forecast By Operating Temperature, 2014 – 2024
13.4.1. High Temperature (> 1400F)
13.4.2. Low Temp (< 1400F)
13.5. Market Size (US$ Mn and Thousand Units) Forecast By Application, 2014 – 2024
13.5.1. Boilers
13.5.2. Furnace/Oven/Kiln
13.5.3. Air Heating/Drying
13.5.4. Others
13.6. Market Size (US$ Mn and Thousand Units) Forecast By End-Use 2014 – 2024
13.6.1. Petrochemicals (Oil & Gas, Exploration & Refining)
13.6.2. Power Generation
13.6.3. Chemicals & Specialty Chemicals
13.6.4. Mining & Mineral
13.6.5. Metal
13.6.6. Pharmaceutical
13.6.7. Glass
13.6.8. Ceramics
13.6.9. Food Processing
13.6.10. Automotive
13.6.11. Printing & Publishing
13.6.12. Others
13.7. Market Size (US$ Mn and Thousand Units) Forecast By Country*, 2014 – 2024
13.7.1. United States
13.7.2. Canada
13.7.3. Mexico
13.7.4. Rest of North America
*Cross segment analysis have been covered for all the above mentioned countries
13.8. Market Attractiveness Analysis
13.8.1. By Fuel Type
13.8.2. By Automation
13.8.3. By Operating Temperature
13.8.4. By Burner Type
13.8.5. By Application
13.8.6. By Industry Vertical
13.8.7. By Country
14. Europe Industrial Burner Market Analysis and Forecast
14.1. Market Size (US$ Mn and Thousand Units) Forecast By Fuel Type, 2014 – 2024
14.1.1. Oil-based
14.1.1.1. Pressure Jet
14.1.1.2. Swirl
14.1.1.3. Rotary Cup
14.1.1.4. Gun burner
14.1.2. Gas-based
14.1.3. Dual fuel
14.2. Market Size (US$ Mn and Thousand Units) Forecast By Automation, 2014 – 2024
14.2.1. Monoblock
14.2.2. Duoblock
14.3. Market Size (US$ Mn and Thousand Units) Forecast By Burner Type, 2014 – 2024
14.3.1. Regenerative Burners (Heat Recovery)
14.3.2. High Velocity Burner
14.3.3. Thermal Radiation
14.3.4. Radiant Burner
14.3.4.1. Wall
14.3.4.2. Tube
14.3.5. Natural Draft
14.3.6. Flat Flame Burner
14.3.7. Line Burner
14.3.8. Customized (Burner Boiler)
14.3.9. Others
14.4. Market Size (US$ Mn and Thousand Units) Forecast By Operating Temperature, 2014 – 2024
14.4.1. High Temperature (> 1400F)
14.4.2. Low Temp (< 1400F)
14.5. Market Size (US$ Mn and Thousand Units) Forecast By Application, 2014 – 2024
14.5.1. Boilers
14.5.2. Furnace/Oven/Kiln
14.5.3. Air Heating/Drying
14.5.4. Others
14.6. Market Size (US$ Mn and Thousand Units) Forecast By End-Use 2014 – 2024
14.6.1.1. Petrochemicals (Oil & Gas, Exploration & Refining)
14.6.1.2. Power Generation
14.6.1.3. Chemicals & Specialty Chemicals
14.6.1.4. Mining & Mineral
14.6.1.5. Metal
14.6.1.6. Pharmaceutical
14.6.1.7. Glass
14.6.1.8. Ceramics
14.6.1.9. Food Processing
14.6.1.10. Automotive
14.6.1.11. Printing & Publishing
14.6.1.12. Others
14.7. Market Size (US$ Mn and Thousand Units) Forecast By Country*, 2014 – 2024
14.7.1. Germany
14.7.2. France
14.7.3. Russia
14.7.4. Turkey
14.7.5. United Kingdom
14.7.6. Rest of Europe
*Cross segment analysis have been covered for all the above mentioned countries
14.8. Market Attractiveness Analysis
14.8.1. By Fuel Type
14.8.2. By Automation
14.8.3. By Operating Temperature
14.8.4. By Burner Type
14.8.5. By Application
14.8.6. By Industry Vertical
14.8.7. By Country
15. Asia Pacific Industrial Burner Market Analysis and Forecast
15.1. Market Size (US$ Mn and Thousand Units) Forecast By Fuel Type, 2014 – 2024
15.1.1. Oil-based
15.1.1.1. Pressure Jet
15.1.1.2. Swirl
15.1.1.3. Rotary Cup
15.1.1.4. Gun burner
15.1.2. Gas-based
15.1.3. Dual fuel
15.2. Market Size (US$ Mn and Thousand Units) Forecast By Automation, 2014 – 2024
15.2.1. Monoblock
15.2.2. Duoblock
15.3. Market Size (US$ Mn and Thousand Units) Forecast By Burner Type, 2014 – 2024
15.3.1. Regenerative Burners (Heat Recovery)
15.3.2. High Velocity Burner
15.3.3. Thermal Radiation
15.3.4. Radiant Burner
15.3.4.1. Wall
15.3.4.2. Tube
15.3.5. Natural Draft
15.3.6. Flat Flame Burner
15.3.7. Line Burner
15.3.8. Customized (Burner Boiler)
15.3.9. Others
15.4. Market Size (US$ Mn and Thousand Units) Forecast By Operating Temperature, 2014 – 2024
15.4.1. High Temperature (> 1400F)
15.4.2. Low Temp (< 1400F)
15.5. Market Size (US$ Mn and Thousand Units) Forecast By Application, 2014 – 2024
15.5.1. Boilers
15.5.2. Furnace/Oven/Kiln
15.5.3. Air Heating/Drying
15.5.4. Others
15.6. Market Size (US$ Mn and Thousand Units) Forecast By End-Use 2014 – 2024
15.6.1. Petrochemicals (Oil & Gas, Exploration & Refining)
15.6.2. Power Generation
15.6.3. Chemicals & Specialty Chemicals
15.6.4. Mining & Mineral
15.6.5. Metal
15.6.6. Pharmaceutical
15.6.7. Glass
15.6.8. Ceramics
15.6.9. Food Processing
15.6.10. Automotive
15.6.11. Printing & Publishing
15.6.12. Others
15.7. Market Size (US$ Mn and Thousand Units) Forecast By Country*, 2014 – 2024
15.7.1. China
15.7.2. India
15.7.3. Japan
15.7.4. Rest of Asia Pacific
*Cross segment analysis have been covered for all the above mentioned countries
15.8. Market Attractiveness Analysis
15.8.1. By Fuel Type
15.8.2. By Automation
15.8.3. By Operating Temperature
15.8.4. By Burner Type
15.8.5. By Application
15.8.6. By Industry Vertical
15.8.7. By Country
16. Middle East and Africa Industrial Burner Market Analysis and Forecast
16.1. Market Size (US$ Mn and Thousand Units) Forecast By Fuel Type, 2014 – 2024
16.1.1. Oil-based
16.1.1.1. Pressure Jet
16.1.1.2. Swirl
16.1.1.3. Rotary Cup
16.1.1.4. Gun burner
16.1.2. Gas-based
16.1.3. Dual fuel
16.2. Market Size (US$ Mn and Thousand Units) Forecast By Automation, 2014 – 2024
16.2.1. Monoblock
16.2.2. Duoblock
16.3. Market Size (US$ Mn and Thousand Units) Forecast By Burner Type, 2014 – 2024
16.3.1. Regenerative Burners (Heat Recovery)
16.3.2. High Velocity Burner
16.3.3. Thermal Radiation
16.3.4. Radiant Burner
16.3.4.1. Wall
16.3.4.2. Tube
16.3.5. Natural Draft
16.3.6. Flat Flame Burner
16.3.7. Line Burner
16.3.8. Customized (Burner Boiler)
16.3.9. Others
16.4. Market Size (US$ Mn and Thousand Units) Forecast By Operating Temperature, 2014 – 2024
16.4.1. High Temperature (> 1400F)
16.4.2. Low Temp (< 1400F)
16.5. Market Size (US$ Mn and Thousand Units) Forecast By Application, 2014 – 2024
16.5.1. Boilers
16.5.2. Furnace/Oven/Kiln
16.5.3. Air Heating/Drying
16.5.4. Others
16.6. Market Size (US$ Mn and Thousand Units) Forecast By End-Use 2014 – 2024
16.6.1. Petrochemicals (Oil & Gas, Exploration & Refining)
16.6.2. Power Generation
16.6.3. Chemicals & Specialty Chemicals
16.6.4. Mining & Mineral
16.6.5. Metal
16.6.6. Pharmaceutical
16.6.7. Glass
16.6.8. Ceramics
16.6.9. Food Processing
16.6.10. Automotive
16.6.11. Printing & Publishing
16.6.12. Others
16.7. Market Size (US$ Mn and Thousand Units) Forecast By Country*, 2014 – 2024
16.7.1. UAE
16.7.2. South Africa
16.7.3. Rest of Middle East and Africa
*Cross segment analysis have been covered for all the above mentioned countries
16.8. Market Attractiveness Analysis
16.8.1. By Fuel Type
16.8.2. By Automation
16.8.3. By Operating Temperature
16.8.4. By Burner Type
16.8.5. By Application
16.8.6. By Industry Vertical
16.8.7. By Country
17. South America Industrial Burner Market Analysis and Forecast
17.1. Market Size (US$ Mn and Thousand Units) Forecast By Fuel Type, 2014 – 2024
17.1.1. Oil-based
17.1.1.1. Pressure Jet
17.1.1.2. Swirl
17.1.1.3. Rotary Cup
17.1.1.4. Gun burner
17.1.2. Gas-based
17.1.3. Dual fuel
17.2. Market Size (US$ Mn and Thousand Units) Forecast By Automation, 2014 – 2024
17.2.1. Monoblock
17.2.2. Duoblock
17.3. Market Size (US$ Mn and Thousand Units) Forecast By Burner Type, 2014 – 2024
17.3.1. Regenerative Burners (Heat Recovery)
17.3.2. High Velocity Burner
17.3.3. Thermal Radiation
17.3.4. Radiant Burner
17.3.4.1. Wall
17.3.4.2. Tube
17.3.5. Natural Draft
17.3.6. Flat Flame Burner
17.3.7. Line Burner
17.3.8. Customized (Burner Boiler)
17.3.9. Others
17.4. Market Size (US$ Mn and Thousand Units) Forecast By Operating Temperature, 2014 -2024
17.4.1. High Temperature (> 1400F)
17.4.2. Low Temp (< 1400F)
17.5. Market Size (US$ Mn and Thousand Units) Forecast By Application, 2014 – 2024
17.5.1. Boilers
17.5.2. Furnace/Oven/Kiln
17.5.3. Air Heating/Drying
17.5.4. Others
17.6. Market Size (US$ Mn and Thousand Units) Forecast By End-Use 2014 – 2024
17.6.1. Petrochemicals (Oil & Gas, Exploration & Refining)
17.6.2. Power Generation
17.6.3. Chemicals & Specialty Chemicals
17.6.4. Mining & Mineral
17.6.5. Metal
17.6.6. Pharmaceutical
17.6.7. Glass
17.6.8. Ceramics
17.6.9. Food Processing
17.6.10. Automotive
17.6.11. Printing & Publishing
17.6.12. Others
17.7. Market Size (US$ Mn and Thousand Units) Forecast By Country*, 2014 – 2024
17.7.1. Brazil
17.7.2. Argentina
17.7.3. Rest of South America
*Cross segment analysis have been covered for all the above mentioned countries
17.8. Market Attractiveness Analysis
17.8.1. By Fuel Type
17.8.2. By Automation
17.8.3. By Operating Temperature
17.8.4. By Burner Type
17.8.5. By Application
17.8.6. By Industry Vertical
17.8.7. By Country
18. Competition Landscape
18.1. Market Player – Competition Matrix (By Tier and Type of companies)
18.2. Market Share Analysis by Company (2015)
18.3. Company Profiles
18.3.1. Alzeta Corporation
18.3.1.1. Company Details (HQ, Foundation Year, Employee Strength)
18.3.1.2. Market Presence, By Segment.
18.3.1.3. Strategy
18.3.1.4. Revenue and Operating Profits
18.3.1.5. SWOT Analysis
*Similar details are provided for all the below mentioned companies
18.3.2. Andritz
18.3.3. Baltur S.p.A
18.3.4. Bloom Engineering
18.3.5. Forbes Marshall
18.3.6. Foster Wheeler AG
18.3.7. Honeywell International Inc. (Maxon)
18.3.8. Limpsfield Combustion Engineering Ltd
18.3.9. Mitsubishi Hitachi Power Systems, Ltd
18.3.10. Oilon
18.3.11. Osaka Gas Co., Ltd
18.3.12. QED Combustion
18.3.13. Selas Heat Technology Company
18.3.14. Wesman Group
18. Key Takeaways
List of Tables
Table 1: Global Industrial Burner Market Revenue (US$ Mn) Forecast and CAGR, by Fuel Type, 2014–2024
Table 2: Global Industrial Burner Market Volume (Thousand Units) Forecast and CAGR, by Fuel Type, 2014–2024
Table 3: Global Industrial Burner Market Revenue (US$ Mn) Forecast and CAGR, by Oil-based, 2014–2024
Table 4: Global Industrial Burner Market Volume (Thousand Units) Forecast and CAGR, by Oil-based, 2014–2024
Table 5: Global Industrial Burner Market Revenue (US$ Mn) Forecast and CAGR, by Automation, 2014–2024
Table 6: Global Industrial Burner Market Volume (Thousand Units) Forecast and CAGR, by Automation, 2014–2024
Table 7: Global Industrial Burner Market Revenue (US$ Mn) Forecast and CAGR, by Burner Type, 2014–2024
Table 8: Global Industrial Burner Market Volume (Thousand Units) Forecast and CAGR, by Burner Type, 2014–2024
Table 9: Global Industrial Burner Market Revenue (US$ Mn) Forecast and CAGR, by Radiant Burner, 2014–2024
Table 10: Global Industrial Burner Market Volume (Thousand Units) Forecast and CAGR, by Radiant Burner, 2014–2024
Table 11: Global Industrial Burner Market Revenue (US$ Mn) Forecast and CAGR, by Operating Temperature, 2014–2024
Table 12: Global Industrial Burner Market Volume (Thousand Units) Forecast and CAGR, by Operating Temperature, 2014–2024
Table 13: Global Industrial Burner Market Revenue (US$ Mn) Forecast and CAGR, by Application, 2014–2024
Table 14: Global Industrial Burner Market Volume (Thousand Units) Forecast and CAGR, by Application, 2014–2024
Table 15: Global Industrial Burner Market Revenue (US$ Mn) Forecast and CAGR, by End-use, 2014–2024
Table 16: Global Industrial Burner Market Volume (Thousand Units) Forecast and CAGR, by End-use, 2014–2024
Table 17: Global Industrial Burner Market Revenue (US$ Mn) Forecast and CAGR, by Region, 2014–2024
Table 18: Global Industrial Burner Market Volume (Thousand Units) Forecast and CAGR, by Region, 2014–2024
Table 19: North America Industrial Burner Market Revenue (US$ Mn) Forecast and CAGR, by Fuel Type, 2014–2024
Table 20: North America Industrial Burner Market Volume (Thousand Units) Forecast and CAGR, by Fuel Type, 2014–2024
Table 21: North America Industrial Burner Market Revenue (US$ Mn) Forecast and CAGR, by Oil-based, 2014–2024
Table 22: North America Industrial Burner Market Volume (Thousand Units) Forecast and CAGR, by Oil-based, 2014–2024
Table 23: North America Industrial Burner Market Revenue (US$ Mn) Forecast and CAGR, by Automation, 2014–2024
Table 24: North America Industrial Burner Market Volume (Thousand Units) Forecast and CAGR, by Automation, 2014–2024
Table 25: North America Industrial Burner Market Revenue (US$ Mn) Forecast and CAGR, by Burner Type, 2014–2024
Table 26: North America Industrial Burner Market Volume (Thousand Units) Forecast and CAGR, by Burner Type, 2014–2024
Table 27: North America Industrial Burner Market Revenue (US$ Mn) Forecast and CAGR, by Radiant Burner, 2014–2024
Table 28: North America Industrial Burner Market Volume (Thousand Units) Forecast and CAGR, by Radiant Burner, 2014–2024
Table 29: North America Industrial Burner Market Revenue (US$ Mn) Forecast and CAGR, by Operating Temperature, 2014–2024
Table 30: North America Industrial Burner Market Volume (Thousand Units) Forecast and CAGR, by Operating Temperature, 2014–2024
Table 31: North America Industrial Burner Market Revenue (US$ Mn) Forecast and CAGR, by Application, 2014–2024
Table 32: North America Industrial Burner Market Volume (Thousand Units) Forecast and CAGR, by Application, 2014–2024
Table 33: North America Industrial Burner Market Revenue (US$ Mn) Forecast and CAGR, by End-use, 2014–2024
Table 34: North America Industrial Burner Market Volume (Thousand Units) Forecast and CAGR, by End-use, 2014–2024
Table 35: North America Industrial Burner Market Revenue (US$ Mn) Forecast and CAGR, by Country, 2014–2024
Table 36: North America Industrial Burner Market Volume (Thousand Units) Forecast and CAGR, by Country, 2014–2024
Table 37: The U.S. Industrial Burner Market Revenue (US$ Mn) Forecast and CAGR, by Fuel Type, 2014–2024
Table 38: The U.S. Industrial Burner Market Volume (Thousand Units) Forecast and CAGR, by Fuel Type, 2014–2024
Table 39: The U.S. Industrial Burner Market Revenue (US$ Mn) Forecast and CAGR, by Oil-based, 2014–2024
Table 40: The U.S. Industrial Burner Market Volume (Thousand Units) Forecast and CAGR, by Oil-based, 2014–2024
Table 41: The U.S. Industrial Burner Market Revenue (US$ Mn) Forecast and CAGR, by Automation, 2014–2024
Table 42: The U.S. Industrial Burner Market Volume (Thousand Units) Forecast and CAGR, by Automation, 2014–2024
Table 43: The U.S. Industrial Burner Market Revenue (US$ Mn) Forecast and CAGR, by Burner Type, 2014–2024
Table 44: The U.S. Industrial Burner Market Volume (Thousand Units) Forecast and CAGR, by Burner Type, 2014–2024
Table 45: The U.S. Industrial Burner Market Revenue (US$ Mn) Forecast and CAGR, by Radiant Burner, 2014–2024
Table 46: The U.S. Industrial Burner Market Volume (Thousand Units) Forecast and CAGR, by Radiant Burner, 2014–2024
Table 47: The U.S. Industrial Burner Market Revenue (US$ Mn) Forecast and CAGR, by Operating Temperature, 2014–2024
Table 48: The U.S. Industrial Burner Market Volume (Thousand Units) Forecast and CAGR, by Operating Temperature, 2014–2024
Table 49: The U.S. Industrial Burner Market Revenue (US$ Mn) Forecast and CAGR, by Application, 2014–2024
Table 50: The U.S. Industrial Burner Market Volume (Thousand Units) Forecast and CAGR, by Application, 2014–2024
Table 51: The U.S. Industrial Burner Market Revenue (US$ Mn) Forecast and CAGR, by End-use, 2014–2024
Table 52: The U.S. Industrial Burner Market Volume (Thousand Units) Forecast and CAGR, by End-use, 2014–2024
Table 53: Canada Industrial Burner Market Revenue (US$ Mn) Forecast and CAGR, by Fuel Type, 2014–2024
Table 54: Canada Industrial Burner Market Volume (Thousand Units) Forecast and CAGR, by Fuel Type, 2014–2024
Table 55: Canada Industrial Burner Market Revenue (US$ Mn) Forecast and CAGR, by Oil-based, 2014–2024
Table 56: Canada Industrial Burner Market Volume (Thousand Units) Forecast and CAGR, by Oil-based, 2014–2024
Table 57: Canada Industrial Burner Market Revenue (US$ Mn) Forecast and CAGR, by Automation, 2014–2024
Table 58: Canada Industrial Burner Market Volume (Thousand Units) Forecast and CAGR, by Automation, 2014–2024
Table 59: Canada Industrial Burner Market Revenue (US$ Mn) Forecast and CAGR, by Burner Type, 2014–2024
Table 60: Canada Industrial Burner Market Volume (Thousand Units) Forecast and CAGR, by Burner Type, 2014–2024
Table 61: Canada Industrial Burner Market Revenue (US$ Mn) Forecast and CAGR, by Radiant Burner, 2014–2024
Table 62: Canada Industrial Burner Market Volume (Thousand Units) Forecast and CAGR, by Radiant Burner, 2014–2024
Table 63: Canada Industrial Burner Market Revenue (US$ Mn) Forecast and CAGR, by Operating Temperature, 2014–2024
Table 64: Canada Industrial Burner Market Volume (Thousand Units) Forecast and CAGR, by Operating Temperature, 2014–2024
Table 65: Canada Industrial Burner Market Revenue (US$ Mn) Forecast and CAGR, by Application, 2014–2024
Table 66: Canada Industrial Burner Market Volume (Thousand Units) Forecast and CAGR, by Application, 2014–2024
Table 67: Canada Industrial Burner Market Revenue (US$ Mn) Forecast and CAGR, by End-use, 2014–2024
Table 68: Canada Industrial Burner Market Volume (Thousand Units) Forecast and CAGR, by End-use, 2014–2024
Table 69: Mexico Industrial Burner Market Revenue (US$ Mn) Forecast and CAGR, by Fuel Type, 2014–2024
Table 70: Mexico Industrial Burner Market Volume (Thousand Units) Forecast and CAGR, by Fuel Type, 2014–2024
Table 71: Mexico Industrial Burner Market Revenue (US$ Mn) Forecast and CAGR, by Oil-based, 2014–2024
Table 72: Mexico Industrial Burner Market Volume (Thousand Units) Forecast and CAGR, by Oil-based, 2014–2024
Table 73: Mexico Industrial Burner Market Revenue (US$ Mn) Forecast and CAGR, by Automation, 2014–2024
Table 74: Mexico Industrial Burner Market Volume (Thousand Units) Forecast and CAGR, by Automation, 2014–2024
Table 75: Mexico Industrial Burner Market Revenue (US$ Mn) Forecast and CAGR, by Burner Type, 2014–2024
Table 76: Mexico Industrial Burner Market Volume (Thousand Units) Forecast and CAGR, by Burner Type, 2014–2024
Table 77: Mexico Industrial Burner Market Revenue (US$ Mn) Forecast and CAGR, by Radiant Burner, 2014–2024
Table 78: Mexico Industrial Burner Market Volume (Thousand Units) Forecast and CAGR, by Radiant Burner, 2014–2024
Table 79: Mexico Industrial Burner Market Revenue (US$ Mn) Forecast and CAGR, by Operating Temperature, 2014–2024
Table 80: Mexico Industrial Burner Market Volume (Thousand Units) Forecast and CAGR, by Operating Temperature, 2014–2024
Table 81: Mexico Industrial Burner Market Revenue (US$ Mn) Forecast and CAGR, by Application, 2014–2024
Table 82: Mexico Industrial Burner Market Volume (Thousand Units) Forecast and CAGR, by Application, 2014–2024
Table 83: Mexico Industrial Burner Market Revenue (US$ Mn) Forecast and CAGR, by End-use, 2014–2024
Table 84: Mexico Industrial Burner Market Volume (Thousand Units) Forecast and CAGR, by End-use, 2014–2024
Table 85: Europe Industrial Burner Market Revenue (US$ Mn) Forecast and CAGR, by Fuel Type, 2014–2024
Table 86: Europe Industrial Burner Market Volume (Thousand Units) Forecast and CAGR, by Fuel Type, 2014–2024
Table 87: Europe Industrial Burner Market Revenue (US$ Mn) Forecast and CAGR, by Oil-based, 2014–2024
Table 88: Europe Industrial Burner Market Volume (Thousand Units) Forecast and CAGR, by Oil-based, 2014–2024
Table 89: Europe Industrial Burner Market Revenue (US$ Mn) Forecast and CAGR, by Automation, 2014–2024
Table 90: Europe Industrial Burner Market Volume (Thousand Units) Forecast and CAGR, by Automation, 2014–2024
Table 91: Europe Industrial Burner Market Revenue (US$ Mn) Forecast and CAGR, by Burner Type, 2014–2024
Table 92: Europe Industrial Burner Market Volume (Thousand Units) Forecast and CAGR, by Burner Type, 2014–2024
Table 93: Europe Industrial Burner Market Revenue (US$ Mn) Forecast and CAGR, by Radiant Burner, 2014–2024
Table 94: Europe Industrial Burner Market Volume (Thousand Units) Forecast and CAGR, by Radiant Burner, 2014–2024
Table 95: Europe Industrial Burner Market Revenue (US$ Mn) Forecast and CAGR, by Operating Temperature, 2014–2024
Table 96: Europe Industrial Burner Market Volume (Thousand Units) Forecast and CAGR, by Operating Temperature, 2014–2024
Table 97: Europe Industrial Burner Market Revenue (US$ Mn) Forecast and CAGR, by Application, 2014–2024
Table 98: Europe Industrial Burner Market Volume (Thousand Units) Forecast and CAGR, by Application, 2014–2024
Table 99: Europe Industrial Burner Market Revenue (US$ Mn) Forecast and CAGR, by End-use, 2014–2024
Table 100: Europe Industrial Burner Market Volume (Thousand Units) Forecast and CAGR, by End-use, 2014–2024
Table 101: Europe Industrial Burner Market Revenue (US$ Mn) Forecast and CAGR, by Country, 2014–2024
Table 102: Europe Industrial Burner Market Volume (Thousand Units) Forecast and CAGR, by Country, 2014–2024
Table 103: Germany Industrial Burner Market Revenue (US$ Mn) Forecast and CAGR, by Fuel Type, 2014–2024
Table 104: Germany Industrial Burner Market Volume (Thousand Units) Forecast and CAGR, by Fuel Type, 2014–2024
Table 105: Germany Industrial Burner Market Revenue (US$ Mn) Forecast and CAGR, by Oil-based, 2014–2024
Table 106: Germany Industrial Burner Market Volume (Thousand Units) Forecast and CAGR, by Oil-based, 2014–2024
Table 107: Germany Industrial Burner Market Revenue (US$ Mn) Forecast and CAGR, by Automation, 2014–2024
Table 108: Germany Industrial Burner Market Volume (Thousand Units) Forecast and CAGR, by Automation, 2014–2024
Table 109: Germany Industrial Burner Market Revenue (US$ Mn) Forecast and CAGR, by Burner Type, 2014–2024
Table 110: Germany Industrial Burner Market Volume (Thousand Units) Forecast and CAGR, by Burner Type, 2014–2024
Table 111: Germany Industrial Burner Market Revenue (US$ Mn) Forecast and CAGR, by Radiant Burner, 2014–2024
Table 112: Germany Industrial Burner Market Volume (Thousand Units) Forecast and CAGR, by Radiant Burner, 2014–2024
Table 113: Germany Industrial Burner Market Revenue (US$ Mn) Forecast and CAGR, by Operating Temperature, 2014–2024
Table 114: Germany Industrial Burner Market Volume (Thousand Units) Forecast and CAGR, by Operating Temperature, 2014–2024
Table 115: Germany Industrial Burner Market Revenue (US$ Mn) Forecast and CAGR, by Application, 2014–2024
Table 116: Germany Industrial Burner Market Volume (Thousand Units) Forecast and CAGR, by Application, 2014–2024
Table 117: Germany Industrial Burner Market Revenue (US$ Mn) Forecast and CAGR, by End-use, 2014–2024
Table 118: Germany Industrial Burner Market Volume (Thousand Units) Forecast and CAGR, by End-use, 2014–2024
Table 119: France Industrial Burner Market Revenue (US$ Mn) Forecast and CAGR, by Fuel Type, 2014–2024
Table 120: France Industrial Burner Market Volume (Thousand Units) Forecast and CAGR, by Fuel Type, 2014–2024
Table 121: France Industrial Burner Market Revenue (US$ Mn) Forecast and CAGR, by Oil-based, 2014–2024
Table 122: France Industrial Burner Market Volume (Thousand Units) Forecast and CAGR, by Oil-based, 2014–2024
Table 123: France Industrial Burner Market Revenue (US$ Mn) Forecast and CAGR, by Automation, 2014–2024
Table 124: France Industrial Burner Market Volume (Thousand Units) Forecast and CAGR, by Automation, 2014–2024
Table 125: France Industrial Burner Market Revenue (US$ Mn) Forecast and CAGR, by Burner Type, 2014–2024
Table 126: France Industrial Burner Market Volume (Thousand Units) Forecast and CAGR, by Burner Type, 2014–2024
Table 127: France Industrial Burner Market Revenue (US$ Mn) Forecast and CAGR, by Radiant Burner, 2014–2024
Table 128: France Industrial Burner Market Volume (Thousand Units) Forecast and CAGR, by Radiant Burner, 2014–2024
Table 129: France Industrial Burner Market Revenue (US$ Mn) Forecast and CAGR, by Operating Temperature, 2014–2024
Table 130: France Industrial Burner Market Volume (Thousand Units) Forecast and CAGR, by Operating Temperature, 2014–2024
Table 131: France Industrial Burner Market Revenue (US$ Mn) Forecast and CAGR, by Application, 2014–2024
Table 132: France Industrial Burner Market Volume (Thousand Units) Forecast and CAGR, by Application, 2014–2024
Table 133: France Industrial Burner Market Revenue (US$ Mn) Forecast and CAGR, by End-use, 2014–2024
Table 134: France Industrial Burner Market Volume (Thousand Units) Forecast and CAGR, by End-use, 2014–2024
Table 135: Russia Industrial Burner Market Revenue (US$ Mn) Forecast and CAGR, by Fuel Type, 2014–2024
Table 136: Russia Industrial Burner Market Volume (Thousand Units) Forecast and CAGR, by Fuel Type, 2014–2024
Table 137: Russia Industrial Burner Market Revenue (US$ Mn) Forecast and CAGR, by Oil-based, 2014–2024
Table 138: Russia Industrial Burner Market Volume (Thousand Units) Forecast and CAGR, by Oil-based, 2014–2024
Table 139: Russia Industrial Burner Market Revenue (US$ Mn) Forecast and CAGR, by Automation, 2014–2024
Table 140: Russia Industrial Burner Market Volume (Thousand Units) Forecast and CAGR, by Automation, 2014–2024
Table 141: Russia Industrial Burner Market Revenue (US$ Mn) Forecast and CAGR, by Burner Type, 2014–2024
Table 142: Russia Industrial Burner Market Volume (Thousand Units) Forecast and CAGR, by Burner Type, 2014–2024
Table 143: Russia Industrial Burner Market Revenue (US$ Mn) Forecast and CAGR, by Radiant Burner, 2014–2024
Table 144: Russia Industrial Burner Market Volume (Thousand Units) Forecast and CAGR, by Radiant Burner, 2014–2024
Table 145: Russia Industrial Burner Market Revenue (US$ Mn) Forecast and CAGR, by Operating Temperature, 2014–2024
Table 146: Russia Industrial Burner Market Volume (Thousand Units) Forecast and CAGR, by Operating Temperature, 2014–2024
Table 147: Russia Industrial Burner Market Revenue (US$ Mn) Forecast and CAGR, by Application, 2014–2024
Table 148: Russia Industrial Burner Market Volume (Thousand Units) Forecast and CAGR, by Application, 2014–2024
Table 149: Russia Industrial Burner Market Revenue (US$ Mn) Forecast and CAGR, by End-use, 2014–2024
Table 150: Russia Industrial Burner Market Volume (Thousand Units) Forecast and CAGR, by End-use, 2014–2024
Table 151: Turkey Industrial Burner Market Revenue (US$ Mn) Forecast and CAGR, by Fuel Type, 2014–2024
Table 152: Turkey Industrial Burner Market Volume (Thousand Units) Forecast and CAGR, by Fuel Type, 2014–2024
Table 153: Turkey Industrial Burner Market Revenue (US$ Mn) Forecast and CAGR, by Oil-based, 2014–2024
Table 154: Turkey Industrial Burner Market Volume (Thousand Units) Forecast and CAGR, by Oil-based, 2014–2024
Table 155: Turkey Industrial Burner Market Revenue (US$ Mn) Forecast and CAGR, by Automation, 2014–2024
Table 156: Turkey Industrial Burner Market Volume (Thousand Units) Forecast and CAGR, by Automation, 2014–2024
Table 157: Turkey Industrial Burner Market Revenue (US$ Mn) Forecast and CAGR, by Burner Type, 2014–2024
Table 158: Turkey Industrial Burner Market Volume (Thousand Units) Forecast and CAGR, by Burner Type, 2014–2024
Table 159: Turkey Industrial Burner Market Revenue (US$ Mn) Forecast and CAGR, by Radiant Burner, 2014–2024
Table 160: Turkey Industrial Burner Market Volume (Thousand Units) Forecast and CAGR, by Radiant Burner, 2014–2024
Table 161: Turkey Industrial Burner Market Revenue (US$ Mn) Forecast and CAGR, by Operating Temperature, 2014–2024
Table 162: Turkey Industrial Burner Market Volume (Thousand Units) Forecast and CAGR, by Operating Temperature, 2014–2024
Table 163: Turkey Industrial Burner Market Revenue (US$ Mn) Forecast and CAGR, by Application, 2014–2024
Table 164: Turkey Industrial Burner Market Volume (Thousand Units) Forecast and CAGR, by Application, 2014–2024
Table 165: Turkey Industrial Burner Market Revenue (US$ Mn) Forecast and CAGR, by End-use, 2014–2024
Table 166: Turkey Industrial Burner Market Volume (Thousand Units) Forecast and CAGR, by End-use, 2014–2024
Table 167: The U.K. Industrial Burner Market Revenue (US$ Mn) Forecast and CAGR, by Fuel Type, 2014–2024
Table 168: The U.K. Industrial Burner Market Volume (Thousand Units) Forecast and CAGR, by Fuel Type, 2014–2024
Table 169: The U.K. Industrial Burner Market Revenue (US$ Mn) Forecast and CAGR, by Oil-based, 2014–2024
Table 170: The U.K. Industrial Burner Market Volume (Thousand Units) Forecast and CAGR, by Oil-based, 2014–2024
Table 171: The U.K. Industrial Burner Market Revenue (US$ Mn) Forecast and CAGR, by Automation, 2014–2024
Table 172: The U.K. Industrial Burner Market Volume (Thousand Units) Forecast and CAGR, by Automation, 2014–2024
Table 173: The U.K. Industrial Burner Market Revenue (US$ Mn) Forecast and CAGR, by Burner Type, 2014–2024
Table 174: The U.K. Industrial Burner Market Volume (Thousand Units) Forecast and CAGR, by Burner Type, 2014–2024
Table 175: The U.K. Industrial Burner Market Revenue (US$ Mn) Forecast and CAGR, by Radiant Burner, 2014–2024
Table 176: The U.K. Industrial Burner Market Volume (Thousand Units) Forecast and CAGR, by Radiant Burner, 2014–2024
Table 177: The U.K. Industrial Burner Market Revenue (US$ Mn) Forecast and CAGR, by Operating Temperature, 2014–2024
Table 178: The U.K. Industrial Burner Market Volume (Thousand Units) Forecast and CAGR, by Operating Temperature, 2014–2024
Table 179: The U.K. Industrial Burner Market Revenue (US$ Mn) Forecast and CAGR, by Application, 2014–2024
Table 180: The U.K. Industrial Burner Market Volume (Thousand Units) Forecast and CAGR, by Application, 2014–2024
Table 181: The U.K. Industrial Burner Market Revenue (US$ Mn) Forecast and CAGR, by End-use, 2014–2024
Table 182: The U.K. Industrial Burner Market Volume (Thousand Units) Forecast and CAGR, by End-use, 2014–2024
Table 183: Asia Pacific Industrial Burner Market Revenue (US$ Mn) Forecast and CAGR, by Fuel Type, 2014–2024
Table 184: Asia Pacific Industrial Burner Market Volume (Thousand Units) Forecast and CAGR, by Fuel Type, 2014–2024
Table 185: Asia Pacific Industrial Burner Market Revenue (US$ Mn) Forecast and CAGR, by Oil-based, 2014–2024
Table 186: Asia Pacific Industrial Burner Market Volume (Thousand Units) Forecast and CAGR, by Oil-based, 2014–2024
Table 187: Asia Pacific Industrial Burner Market Revenue (US$ Mn) Forecast and CAGR, by Automation, 2014–2024
Table 188: Asia Pacific Industrial Burner Market Volume (Thousand Units) Forecast and CAGR, by Automation, 2014–2024
Table 189: Asia Pacific Industrial Burner Market Revenue (US$ Mn) Forecast and CAGR, by Burner Type, 2014–2024
Table 190: Asia Pacific Industrial Burner Market Volume (Thousand Units) Forecast and CAGR, by Burner Type, 2014–2024
Table 191: Asia Pacific Industrial Burner Market Revenue (US$ Mn) Forecast and CAGR, by Radiant Burner, 2014–2024
Table 192: Asia Pacific Industrial Burner Market Volume (Thousand Units) Forecast and CAGR, by Radiant Burner, 2014–2024
Table 193: Asia Pacific Industrial Burner Market Revenue (US$ Mn) Forecast and CAGR, by Operating Temperature, 2014–2024
Table 194: Asia Pacific Industrial Burner Market Volume (Thousand Units) Forecast and CAGR, by Operating Temperature, 2014–2024
Table 195: Asia Pacific Industrial Burner Market Revenue (US$ Mn) Forecast and CAGR, by Application, 2014–2024
Table 196: Asia Pacific Industrial Burner Market Volume (Thousand Units) Forecast and CAGR, by Application, 2014–2024
Table 197: Asia Pacific Industrial Burner Market Revenue (US$ Mn) Forecast and CAGR, by End-use, 2014–2024
Table 198: Asia Pacific Industrial Burner Market Volume (Thousand Units) Forecast and CAGR, by End-use, 2014–2024
Table 199: Asia Pacific Industrial Burner Market Revenue (US$ Mn) Forecast and CAGR, by Country, 2014–2024
Table 200: Asia Pacific Industrial Burner Market Volume (Thousand Units) Forecast and CAGR, by Country, 2014–2024
Table 201: China Industrial Burner Market Revenue (US$ Mn) Forecast and CAGR, by Fuel Type, 2014–2024
Table 202: China Industrial Burner Market Volume (Thousand Units) Forecast and CAGR, by Fuel Type, 2014–2024
Table 203: China Industrial Burner Market Revenue (US$ Mn) Forecast and CAGR, by Oil-based, 2014–2024
Table 204: China Industrial Burner Market Volume (Thousand Units) Forecast and CAGR, by Oil-based, 2014–2024
Table 205: China Industrial Burner Market Revenue (US$ Mn) Forecast and CAGR, by Automation, 2014–2024
Table 206: China Industrial Burner Market Volume (Thousand Units) Forecast and CAGR, by Automation, 2014–2024
Table 207: China Industrial Burner Market Revenue (US$ Mn) Forecast and CAGR, by Burner Type, 2014–2024
Table 208: China Industrial Burner Market Volume (Thousand Units) Forecast and CAGR, by Burner Type, 2014–2024
Table 209: China Industrial Burner Market Revenue (US$ Mn) Forecast and CAGR, by Radiant Burner, 2014–2024
Table 210: China Industrial Burner Market Volume (Thousand Units) Forecast and CAGR, by Radiant Burner, 2014–2024
Table 211: China Industrial Burner Market Revenue (US$ Mn) Forecast and CAGR, by Operating Temperature, 2014–2024
Table 212: China Industrial Burner Market Volume (Thousand Units) Forecast and CAGR, by Operating Temperature, 2014–2024
Table 213: China Industrial Burner Market Revenue (US$ Mn) Forecast and CAGR, by Application, 2014–2024
Table 214: China Industrial Burner Market Volume (Thousand Units) Forecast and CAGR, by Application, 2014–2024
Table 215: China Industrial Burner Market Revenue (US$ Mn) Forecast and CAGR, by End-use, 2014–2024
Table 216: China Industrial Burner Market Volume (Thousand Units) Forecast and CAGR, by End-use, 2014–2024
Table 217: India Industrial Burner Market Revenue (US$ Mn) Forecast and CAGR, by Fuel Type, 2014–2024
Table 218: India Industrial Burner Market Volume (Thousand Units) Forecast and CAGR, by Fuel Type, 2014–2024
Table 219: India Industrial Burner Market Revenue (US$ Mn) Forecast and CAGR, by Oil-based, 2014–2024
Table 220: India Industrial Burner Market Volume (Thousand Units) Forecast and CAGR, by Oil-based, 2014–2024
Table 221: India Industrial Burner Market Revenue (US$ Mn) Forecast and CAGR, by Automation, 2014–2024
Table 222: India Industrial Burner Market Volume (Thousand Units) Forecast and CAGR, by Automation, 2014–2024
Table 223: India Industrial Burner Market Revenue (US$ Mn) Forecast and CAGR, by Burner Type, 2014–2024
Table 223: India Industrial Burner Market Volume (Thousand Units) Forecast and CAGR, by Burner Type, 2014–2024
Table 224: India Industrial Burner Market Revenue (US$ Mn) Forecast and CAGR, by Radiant Burner, 2014–2024
Table 225: India Industrial Burner Market Volume (Thousand Units) Forecast and CAGR, by Radiant Burner, 2014–2024
Table 226: India Industrial Burner Market Revenue (US$ Mn) Forecast and CAGR, by Operating Temperature, 2014–2024
Table 227: India Industrial Burner Market Volume (Thousand Units) Forecast and CAGR, by Operating Temperature, 2014–2024
Table 228: India Industrial Burner Market Revenue (US$ Mn) Forecast and CAGR, by Application, 2014–2024
Table 229: India Industrial Burner Market Volume (Thousand Units) Forecast and CAGR, by Application, 2014–2024
Table 230: India Industrial Burner Market Revenue (US$ Mn) Forecast and CAGR, by End-use, 2014–2024
Table 231: India Industrial Burner Market Volume (Thousand Units) Forecast and CAGR, by End-use, 2014–2024
Table 232: Japan Industrial Burner Market Revenue (US$ Mn) Forecast and CAGR, by Fuel Type, 2014–2024
Table 233: Japan Industrial Burner Market Volume (Thousand Units) Forecast and CAGR, by Fuel Type, 2014–2024
Table 234: Japan Industrial Burner Market Revenue (US$ Mn) Forecast and CAGR, by Oil-based, 2014–2024
Table 235: Japan Industrial Burner Market Volume (Thousand Units) Forecast and CAGR, by Oil-based, 2014–2024
Table 236: Japan Industrial Burner Market Revenue (US$ Mn) Forecast and CAGR, by Automation, 2014–2024
Table 237: Japan Industrial Burner Market Volume (Thousand Units) Forecast and CAGR, by Automation, 2014–2024
Table 238: Japan Industrial Burner Market Revenue (US$ Mn) Forecast and CAGR, by Burner Type, 2014–2024
Table 239: Japan Industrial Burner Market Volume (Thousand Units) Forecast and CAGR, by Burner Type, 2014–2024
Table 240: Japan Industrial Burner Market Revenue (US$ Mn) Forecast and CAGR, by Radiant Burner, 2014–2024
Table 241: Japan Industrial Burner Market Volume (Thousand Units) Forecast and CAGR, by Radiant Burner, 2014–2024
Table 242: Japan Industrial Burner Market Revenue (US$ Mn) Forecast and CAGR, by Operating Temperature, 2014–2024
Table 243: Japan Industrial Burner Market Volume (Thousand Units) Forecast and CAGR, by Operating Temperature, 2014–2024
Table 244: Japan Industrial Burner Market Revenue (US$ Mn) Forecast and CAGR, by Application, 2014–2024
Table 245: Japan Industrial Burner Market Volume (Thousand Units) Forecast and CAGR, by Application, 2014–2024
Table 246: Japan Industrial Burner Market Revenue (US$ Mn) Forecast and CAGR, by End-use, 2014–2024
Table 247: Japan Industrial Burner Market Volume (Thousand Units) Forecast and CAGR, by End-use, 2014–2024
Table 248: Middle East and Africa Industrial Burner Market Revenue (US$ Mn) Forecast and CAGR, by Fuel Type, 2014–2024
Table 249: Middle East and Africa Industrial Burner Market Volume (Thousand Units) Forecast and CAGR, by Fuel Type, 2014–2024
Table 250: Middle East and Africa Industrial Burner Market Revenue (US$ Mn) Forecast and CAGR, by Oil-based, 2014–2024
Table 251: Middle East and Africa Industrial Burner Market Volume (Thousand Units) Forecast and CAGR, by Oil-based, 2014–2024
Table 252: Middle East and Africa Industrial Burner Market Revenue (US$ Mn) Forecast and CAGR, by Automation, 2014–2024
Table 253: Middle East and Africa Industrial Burner Market Volume (Thousand Units) Forecast and CAGR, by Automation, 2014–2024
Table 254: Middle East and Africa Industrial Burner Market Revenue (US$ Mn) Forecast and CAGR, by Burner Type, 2014–2024
Table 255: Middle East and Africa Industrial Burner Market Volume (Thousand Units) Forecast and CAGR, by Burner Type, 2014–2024
Table 256: Middle East and Africa Industrial Burner Market Revenue (US$ Mn) Forecast and CAGR, by Radiant Burner, 2014–2024
Table 257: Middle East and Africa Industrial Burner Market Volume (Thousand Units) Forecast and CAGR, by Radiant Burner, 2014–2024
Table 258: Middle East and Africa Industrial Burner Market Revenue (US$ Mn) Forecast and CAGR, by Operating Temperature, 2014–2024
Table 259: Middle East and Africa Industrial Burner Market Volume (Thousand Units) Forecast and CAGR, by Operating Temperature, 2014–2024
Table 260: Middle East and Africa Industrial Burner Market Revenue (US$ Mn) Forecast and CAGR, by Application, 2014–2024
Table 261: Middle East and Africa Industrial Burner Market Volume (Thousand Units) Forecast and CAGR, by Application, 2014–2024
Table 262: Middle East and Africa Industrial Burner Market Revenue (US$ Mn) Forecast and CAGR, by End-use, 2014–2024
Table 263: Middle East and Africa Industrial Burner Market Volume (Thousand Units) Forecast and CAGR, by End-use, 2014–2024
Table 264: Middle East and Africa Industrial Burner Market Revenue (US$ Mn) Forecast and CAGR, by Country, 2014–2024
Table 265: Middle East and Africa Industrial Burner Market Volume (Thousand Units) Forecast and CAGR, by Country, 2014–2024
Table 266: UAE Industrial Burner Market Revenue (US$ Mn) Forecast and CAGR, by Fuel Type, 2014–2024
Table 267: UAE Industrial Burner Market Volume (Thousand Units) Forecast and CAGR, by Fuel Type, 2014–2024
Table 268: UAE Industrial Burner Market Revenue (US$ Mn) Forecast and CAGR, by Oil-based, 2014–2024
Table 269: UAE Industrial Burner Market Volume (Thousand Units) Forecast and CAGR, by Oil-based, 2014–2024
Table 270: UAE Industrial Burner Market Revenue (US$ Mn) Forecast and CAGR, by Automation, 2014–2024
Table 271: UAE Industrial Burner Market Volume (Thousand Units) Forecast and CAGR, by Automation, 2014–2024
Table 272: UAE Industrial Burner Market Revenue (US$ Mn) Forecast and CAGR, by Burner Type, 2014–2024
Table 273: UAE Industrial Burner Market Volume (Thousand Units) Forecast and CAGR, by Burner Type, 2014–2024
Table 274: UAE Industrial Burner Market Revenue (US$ Mn) Forecast and CAGR, by Radiant Burner, 2014–2024
Table 275: UAE Industrial Burner Market Volume (Thousand Units) Forecast and CAGR, by Radiant Burner, 2014–2024
Table 276: UAE Industrial Burner Market Revenue (US$ Mn) Forecast and CAGR, by Operating Temperature, 2014–2024
Table 277: UAE Industrial Burner Market Volume (Thousand Units) Forecast and CAGR, by Operating Temperature, 2014–2024
Table 278: UAE Industrial Burner Market Revenue (US$ Mn) Forecast and CAGR, by Application, 2014–2024
Table 279: UAE Industrial Burner Market Volume (Thousand Units) Forecast and CAGR, by Application, 2014–2024
Table 280: UAE Industrial Burner Market Revenue (US$ Mn) Forecast and CAGR, by End-use, 2014–2024
Table 281: UAE Industrial Burner Market Volume (Thousand Units) Forecast and CAGR, by End-use, 2014–2024
Table 282: South Africa Industrial Burner Market Revenue (US$ Mn) Forecast and CAGR, by Fuel Type, 2014–2024
Table 283: South Africa Industrial Burner Market Volume (Thousand Units) Forecast and CAGR, by Fuel Type, 2014–2024
Table 284: South Africa Industrial Burner Market Revenue (US$ Mn) Forecast and CAGR, by Oil-based, 2014–2024
Table 285: South Africa Industrial Burner Market Volume (Thousand Units) Forecast and CAGR, by Oil-based, 2014–2024
Table 286: South Africa Industrial Burner Market Revenue (US$ Mn) Forecast and CAGR, by Automation, 2014–2024
Table 287: South Africa Industrial Burner Market Volume (Thousand Units) Forecast and CAGR, by Automation, 2014–2024
Table 288: South Africa Industrial Burner Market Revenue (US$ Mn) Forecast and CAGR, by Burner Type, 2014–2024
Table 289: South Africa Industrial Burner Market Volume (Thousand Units) Forecast and CAGR, by Burner Type, 2014–2024
Table 290: South Africa Industrial Burner Market Revenue (US$ Mn) Forecast and CAGR, by Radiant Burner, 2014–2024
Table 291: South Africa Industrial Burner Market Volume (Thousand Units) Forecast and CAGR, by Radiant Burner, 2014–2024
Table 292: South Africa Industrial Burner Market Revenue (US$ Mn) Forecast and CAGR, by Operating Temperature, 2014–2024
Table 293: South Africa Industrial Burner Market Volume (Thousand Units) Forecast and CAGR, by Operating Temperature, 2014–2024
Table 294: South Africa Industrial Burner Market Revenue (US$ Mn) Forecast and CAGR, by Application, 2014–2024
Table 295: South Africa Industrial Burner Market Volume (Thousand Units) Forecast and CAGR, by Application, 2014–2024
Table 296: South Africa Industrial Burner Market Revenue (US$ Mn) Forecast and CAGR, by End-use, 2014–2024
Table 297: South Africa Industrial Burner Market Volume (Thousand Units) Forecast and CAGR, by End-use, 2014–2024
Table 298: South America Industrial Burner Market Revenue (US$ Mn) Forecast and CAGR, by Fuel Type, 2014–2024
Table 299: South America Industrial Burner Market Volume (Thousand Units) Forecast and CAGR, by Fuel Type, 2014–2024
Table 300: South America Industrial Burner Market Revenue (US$ Mn) Forecast and CAGR, by Oil-based, 2014–2024
Table 301: South America Industrial Burner Market Volume (Thousand Units) Forecast and CAGR, by Oil-based, 2014–2024
Table 302: South America Industrial Burner Market Revenue (US$ Mn) Forecast and CAGR, by Automation, 2014–2024
Table 303: South America Industrial Burner Market Volume (Thousand Units) Forecast and CAGR, by Automation, 2014–2024
Table 304: South America Industrial Burner Market Revenue (US$ Mn) Forecast and CAGR, by Burner Type, 2014–2024
Table 305: South America Industrial Burner Market Volume (Thousand Units) Forecast and CAGR, by Burner Type, 2014–2024
Table 306: South America Industrial Burner Market Revenue (US$ Mn) Forecast and CAGR, by Radiant Burner, 2014–2024
Table 307: South America Industrial Burner Market Volume (Thousand Units) Forecast and CAGR, by Radiant Burner, 2014–2024
Table 308: South America Industrial Burner Market Revenue (US$ Mn) Forecast and CAGR, by Operating Temperature, 2014–2024
Table 309: South America Industrial Burner Market Volume (Thousand Units) Forecast and CAGR, by Operating Temperature, 2014–2024
Table 310: South America Industrial Burner Market Revenue (US$ Mn) Forecast and CAGR, by Application, 2014–2024
Table 311: South America Industrial Burner Market Volume (Thousand Units) Forecast and CAGR, by Application, 2014–2024
Table 312: South America Industrial Burner Market Revenue (US$ Mn) Forecast and CAGR, by End-use, 2014–2024
Table 313: South America Industrial Burner Market Volume (Thousand Units) Forecast and CAGR, by End-use, 2014–2024
Table 314: South America Industrial Burner Market Revenue (US$ Mn) Forecast and CAGR, by Country, 2014–2024
Table 315: South America Industrial Burner Market Volume (Thousand Units) Forecast and CAGR, by Country, 2014–2024
Table 316: Brazil Industrial Burner Market Revenue (US$ Mn) Forecast and CAGR, by Fuel Type, 2014–2024
Table 317: Brazil Industrial Burner Market Volume (Thousand Units) Forecast and CAGR, by Fuel Type, 2014–2024
Table 318: Brazil Industrial Burner Market Revenue (US$ Mn) Forecast and CAGR, by Oil-based, 2014–2024
Table 319: Brazil Industrial Burner Market Volume (Thousand Units) Forecast and CAGR, by Oil-based, 2014–2024
Table 320: Brazil Industrial Burner Market Revenue (US$ Mn) Forecast and CAGR, by Automation, 2014–2024
Table 321: Brazil Industrial Burner Market Volume (Thousand Units) Forecast and CAGR, by Automation, 2014–2024
Table 322: Brazil Industrial Burner Market Revenue (US$ Mn) Forecast and CAGR, by Burner Type, 2014–2024
Table 323: Brazil Industrial Burner Market Volume (Thousand Units) Forecast and CAGR, by Burner Type, 2014–2024
Table 324: Brazil Industrial Burner Market Revenue (US$ Mn) Forecast and CAGR, by Radiant Burner, 2014–2024
Table 325: Brazil Industrial Burner Market Volume (Thousand Units) Forecast and CAGR, by Radiant Burner, 2014–2024
Table 326: Brazil Industrial Burner Market Revenue (US$ Mn) Forecast and CAGR, by Operating Temperature, 2014–2024
Table 327: Brazil Industrial Burner Market Volume (Thousand Units) Forecast and CAGR, by Operating Temperature, 2014–2024
Table 328: Brazil Industrial Burner Market Revenue (US$ Mn) Forecast and CAGR, by Application, 2014–2024
Table 329: Brazil Industrial Burner Market Volume (Thousand Units) Forecast and CAGR, by Application, 2014–2024
Table 330: Brazil Industrial Burner Market Revenue (US$ Mn) Forecast and CAGR, by End-use, 2014–2024
Table 331: Brazil Industrial Burner Market Volume (Thousand Units) Forecast and CAGR, by End-use, 2014–2024
Table 332: Argentina Industrial Burner Market Revenue (US$ Mn) Forecast and CAGR, by Fuel Type, 2014–2024
Table 333: Argentina Industrial Burner Market Volume (Thousand Units) Forecast and CAGR, by Fuel Type, 2014–2024
Table 334: Argentina Industrial Burner Market Revenue (US$ Mn) Forecast and CAGR, by Oil-based, 2014–2024
Table 335: Argentina Industrial Burner Market Volume (Thousand Units) Forecast and CAGR, by Oil-based, 2014–2024
Table 336: Argentina Industrial Burner Market Revenue (US$ Mn) Forecast and CAGR, by Automation, 2014–2024
Table 337: Argentina Industrial Burner Market Volume (Thousand Units) Forecast and CAGR, by Automation, 2014–2024
Table 338: Argentina Industrial Burner Market Revenue (US$ Mn) Forecast and CAGR, by Burner Type, 2014–2024
Table 339: Argentina Industrial Burner Market Volume (Thousand Units) Forecast and CAGR, by Burner Type, 2014–2024
Table 340: Argentina Industrial Burner Market Revenue (US$ Mn) Forecast and CAGR, by Radiant Burner, 2014–2024
Table 341: Argentina Industrial Burner Market Volume (Thousand Units) Forecast and CAGR, by Radiant Burner, 2014–2024
Table 342: Argentina Industrial Burner Market Revenue (US$ Mn) Forecast and CAGR, by Operating Temperature, 2014–2024
Table 343: Argentina Industrial Burner Market Volume (Thousand Units) Forecast and CAGR, by Operating Temperature, 2014–2024
Table 344: Argentina Industrial Burner Market Revenue (US$ Mn) Forecast and CAGR, by Application, 2014–2024
Table 345: Argentina Industrial Burner Market Volume (Thousand Units) Forecast and CAGR, by Application, 2014–2024
Table 346: Argentina Industrial Burner Market Revenue (US$ Mn) Forecast and CAGR, by End-use, 2014–2024
Table 347: Argentina Industrial Burner Market Volume (Thousand Units) Forecast and CAGR, by End-use, 2014–2024
List of Figures
Figure 1: Global Industrial Burner Market Revenue Projection (US$ Mn), 2014 – 2024
Figure 2: Global Industrial Burner Market Volume Projection (Thousand Units), 2014 – 2024
Figure 3: Global Industrial Burner Market Y-o-Y Growth (Value and Volume %) Forecast, 2015 - 2024
Figure 4: Global Industrial Burner Market Attractiveness Analysis, By Burner Type (2016)
Figure 5: Global Industrial Burner Market Attractiveness Analysis, By Automation (2016)
Figure 6: Global Industrial Burner Market Attractiveness Analysis, By Application (2016)
Figure 7: Global Industrial Burner Market Attractiveness Analysis, By Fuel Type (2016)
Figure 8: Global Industrial Burner Market Attractiveness Analysis, By Operating Temperature (2016)
Figure 9: Global Industrial Burner Market Attractiveness Analysis, By Region (2016)
Figure 10: Global Industrial Burner Market Attractiveness Analysis, By End-Use (2016)
Figure 11: Global Industrial Burner Market Size and Y-o-Y Growth, by Region – North America, 2014 – 2024, (US$ Mn & Value %)
Figure 12: Global Industrial Burner Market Size and Y-o-Y Growth, by Region – Europe, 2014 – 2024, (US$ Mn & Value %)
Figure 13: Global Industrial Burner Market Size and Y-o-Y Growth, by Region – Asia Pacific, 2014 – 2024, (US$ Mn & Value %)
Figure 14: Global Industrial Burner Market Size and Y-o-Y Growth, by Region – MEA, 2014 – 2024, (US$ Mn & Value %)
Figure 15: Global Industrial Burner Market Size and Y-o-Y Growth, by Region – SA, 2014 – 2024, (US$ Mn & Value %)
Figure 17: North America Industrial Burner Market Size and Y-o-Y Growth, by Country – The U.S., 2014 – 2024, (US$ Mn & Value %)
Figure 18: North America Industrial Burner Market Size and Y-o-Y Growth, by Country –Canada, 2014 – 2024, (US$ Mn & Value %)
Figure 19: North America Industrial Burner Market Size and Y-o-Y Growth, by Country – Mexico, 2014 – 2024, (US$ Mn & Value %)
Figure 20: North America Industrial Burner Market Attractiveness Analysis, By Burner Type (2016)
Figure 21: North America Industrial Burner Market Attractiveness Analysis, By Application (2016)
Figure 22: North America Industrial Burner Market Attractiveness Analysis, By Automation (2016)
Figure 23: North America Industrial Burner Market Attractiveness Analysis, By Country (2016)
Figure 24: North America Industrial Burner Market Attractiveness Analysis, By Fuel Type (2016)
Figure 25: North America Industrial Burner Market Attractiveness Analysis, By Operating Temperature (2016)
Figure 26: North America Industrial Burner Market Attractiveness Analysis, By End-Use (2016)
Figure 27: Europe Industrial Burner Market Size and Y-o-Y Growth, by Country – The U.K., 2014 – 2024, (US$ Mn & Value %)
Figure 28: Europe Industrial Burner Market Size and Y-o-Y Growth, by Country – Germany, 2014 – 2024, (US$ Mn & Value %)
Figure 29: Europe Industrial Burner Market Size and Y-o-Y Growth, by Country – France, 2014 – 2024, (US$ Mn & Value %)
Figure 30: Europe Industrial Burner Market Size and Y-o-Y Growth, by Country –Russia, 2014 – 2024, (US$ Mn, & Value %)
Figure 31: Europe Industrial Burner Market Size and Y-o-Y Growth, by Country – Turkey, 2014 – 2024, (US$ Mn & Value %)
Figure 32: Europe Industrial Burner Market Attractiveness Analysis, By Burner Type (2016)
Figure 33: Europe Industrial Burner Market Attractiveness Analysis, By Application (2016)
Figure 34: Europe Industrial Burner Market Attractiveness Analysis, By Automation (2016)
Figure 35: Europe Industrial Burner Market Attractiveness Analysis, By Country (2016)
Figure 36: Europe Industrial Burner Market Attractiveness Analysis, By Fuel Type (2016)
Figure 37: Europe Industrial Burner Market Attractiveness Analysis, By Operating Temperature (2016)
Figure 38: Europe Industrial Burner Market Attractiveness Analysis, By End-Use (2016)
Figure 39: Asia Pacific Industrial Burner Market Size and Y-o-Y Growth, by Country – China, 2014 – 2024, (US$ Mn & Value %)
Figure 40: Asia Pacific Industrial Burner Market Size and Y-o-Y Growth, by Country –India, 2014 – 2024, (US$ Mn & Value %)
Figure 41: Asia Pacific Industrial Burner Market Size and Y-o-Y Growth, by Country – Japan, 2014 – 2024, (US$ Mn & Value %)
Figure 42: Asia Pacific Industrial Burner Market Attractiveness Analysis, By Burner Type (2016)
Figure 43: Asia Pacific Industrial Burner Market Attractiveness Analysis, By Application (2016)
Figure 44: Asia Pacific Industrial Burner Market Attractiveness Analysis, By Automation (2016)
Figure 45: Asia Pacific Industrial Burner Market Attractiveness Analysis, By Country (2016)
Figure 46: Asia Pacific Industrial Burner Market Attractiveness Analysis, By Fuel Type (2016)
Figure 47: Asia Pacific Industrial Burner Market Attractiveness Analysis, By Operating Temperature (2016)
Figure 48: Asia Pacific Industrial Burner Market Attractiveness Analysis, By End-Use (2016)
Figure 49: Middle East and Africa Industrial Burner Market Size and Y-o-Y Growth, by Country – UAE, 2014 – 2024, (US$ Mn & Value %)
Figure 50: Middle East and Africa Industrial Burner Market Size and Y-o-Y Growth, by Country –South Africa, 2014 – 2024, (US$ Mn & Value %)
Figure 51: MEA Industrial Burner Market Attractiveness Analysis, By Burner Type (2016)
Figure 52: MEA Industrial Burner Market Attractiveness Analysis, By Application (2016)
Figure 53: MEA Industrial Burner Market Attractiveness Analysis, By Automation (2016)
Figure 54: MEA Industrial Burner Market Attractiveness Analysis, By Country (2016)
Figure 55: MEA Industrial Burner Market Attractiveness Analysis, By Fuel Type (2016)
Figure 56: MEA Industrial Burner Market Attractiveness Analysis, By Operating Temperature (2016)
Figure 57: MEA Industrial Burner Market Attractiveness Analysis, By End-Use (2016)
Figure 58: South America Industrial Burner Market Size and Y-o-Y Growth, by Country – Brazil, 2014 – 2024, (US$ Mn & Value %)
Figure 59: South America Industrial Burner Market Size and Y-o-Y Growth, by Country –Argentina, 2014 – 2024, (US$ Mn & Value %)
Figure 60: South America Industrial Burner Market Attractiveness Analysis, By Burner Type (2016)
Figure 61: South America Industrial Burner Market Attractiveness Analysis, By Application (2016)
Figure 62: South America Industrial Burner Market Attractiveness Analysis, By Automation (2016)
Figure 63: South America Industrial Burner Market Attractiveness Analysis, By Country (2016)
Figure 64: South America Industrial Burner Market Attractiveness Analysis, By Fuel Type (2016)
Figure 65: South America Industrial Burner Market Attractiveness Analysis, By Operating Temperature (2016)
Copyright © Transparency Market Research, Inc. All Rights reserved
Trust Online

Industrial burner Market Analysis