
Reports
Reports
Agricultural adjuvants are secondary products used to increase the efficiency and ease of using agrochemicals such as insecticides, herbicides, and fungicides. The primary factors driving the global agricultural adjuvants market include increasing food demand, limited arable land, and rising need for agrochemicals. Moreover, the agricultural adjuvants market is expected to witness massive growth due to the rising adoption of precision farming practices and the need to limit pesticide waste.
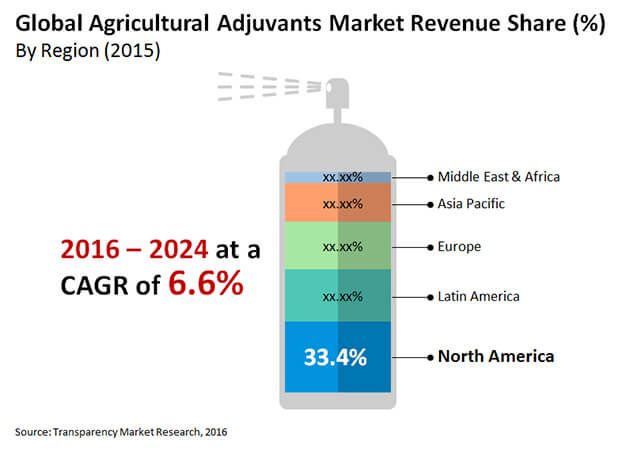
The global agricultural adjuvants market is projected to garner revenues worth US$4.16 billion, expanding at CAGR of 6.6% during the forecast period of 2016–2024.
In recent years, companies have been creating environmentally friendly bio-based adjuvants such as modified vegetable oils, methylated seed oil (MSO), and organo-modified siloxanes. Due to high degree of safety and biodegradability, these biologically produced adjuvants are considered environmentally beneficial. During the COVID-19 crisis, the global population has been showing a shift toward increased demand for organically produced foods. People have become more concerned about their health in the wake of the virus outbreak. Thus, there is a surge in demand for clean, healthful, and nutritious food in the markets. As a result, the increasing adoption of green and organic adjuvants in the agriculture sector is expected to bolster the agricultural adjuvants market.
The world population is growing at an exponential rate. According to the U.S. Population Division, the world population has roughly quadrupled in the last century and is expected to reach 9.2 billion by 2050. Food supply has become a global problem as the population continues to expand. Farm land per capita is anticipated to fall to 1800m² in 2030, down from 2,200m² in 2005. Making matters worse, crop pests account for 10-16% of worldwide crop losses each year. As a result, crop protection is the primary approach used by farmers to fulfill the rising world’s food demand. The use of adjuvants alongside pesticides on crops is a tried-and-true method for enhancing global food production, which is boosting the agricultural adjuvants market. The worldwide area under cultivation for cereals decreased from 729.2 million metric tons in 2017 to 724.4 metric tons in 2019. As a result, farmers globally are being assisted by their various governments for the prudent use of adjuvants, thereby propelling the agricultural adjuvants market.
The COVID-19 pandemic has wreaked havoc on a variety of industrial production sectors . The agriculture industry has also been hit hard. The scarcity of semi-skilled and unskilled workers in farm production has had long-term consequences. The agricultural adjuvants market has seen a rebound trend in recent years, as economies have begun to normalize. Furthermore, the introduction of new mechanized production technologies will assist agriculturists in overcoming the disadvantages of a workforce shortage. The emerging trend of automation in the production industry is boosting the momentum, thereby increasing demand for agriculture adjuvants. Furthermore, manufacturers and agrochemical firms are eager to broaden their product portfolios and widen their range of new adjuvants.
North America is expected to account for the lion's share of the global agricultural adjuvants market. Demand in North America is being driven by an increased understanding of modern farming technologies, the emergence of large-scale agriculture, and the growing demand for food products. North America is a major market for innovative crop protection technologies. In 2018, crop protection chemicals were used at a rate of up to 2.38 kg per hectare in the United States. Adjuvant use is higher on big acreages of crops such as corn and soybean, which use enormous amounts of crop protection chemicals. At the farmer level, with an increased understanding of scientific crop protection measures, the use of adjuvants has risen remarkably.
Key players active in the global agricultural adjuvants market are Momentive Performance Materials Inc., Croda International Plc., Clariant, Solvay S.A., Akzo Nobel N.V, Brandt Consolidated, Inc., Dow Corning Corporation, and Loveland Products, Inc.
Agricultural Adjuvants Market is expected to Reach US$ 4.16 Bn By 2024
Agricultural Adjuvants Market is estimated to rise at a CAGR of 6.6 % during forecast period
Increased demand for green adjuvant is expected to drive the Agricultural Adjuvants Market
North America is more attractive for vendors in the Agricultural Adjuvants Market
Key players of Agricultural Adjuvants Market are Momentive Performance Materials Inc., Croda International Plc., Clariant, Solvay S.A., Akzo Nobel N.V, Brandt Consolidated, Inc., Dow Corning Corporation, and Loveland Products, Inc
1. Preface
1.1. Report Scope and Market Segmentation
1.2. Research Highlights
2. Assumptions and Research Methodology
2.1. Assumptions and Acronyms Used
2.2. Research Methodology
3. Executive Summary
3.1. Market Size, Global Agricultural adjuvants Market (US$ Mn)
3.2. Key Trends
3.3. Regional Overview, 2015 & Top 3 Product Share, 2015- 2024
4. Market Overview
4.1. Product Overview
4.2. Agrochemicals Market Overview
4.3. Market Indicators
4.4. Key Industry Developments
5. Market Dynamics
5.1 Market Dynamics
5.1.1. Drivers
5.1.2. Restraints
5.1.3. Key Opportunities
5.2. Agricultural Adjuvants Market - Global Supply Demand Scenario
5.3. Porter’s Analysis Porter’s Analysis
5.3.1. Threat of Substitutes
5.3.2. Bargaining Power of Buyers
5.3.3. Bargaining Power of Suppliers
5.3.4. Threat of New Entrants
5.3.5. Degree of Competition
5.4. Value Chain Analysis
5.5. Global Agricultural Adjuvants Market Analysis and Forecast, 2015–2024
5.6. Market Outlook
6. Global Agricultural adjuvants Market Analysis By Type, 2015- 2024
6.1. Key Trends
6.2. Introduction
6.3. Key Findings
6.4. Type Comparison
6.5. Global Agricultural Adjuvants Market Value Share Analysis, by Type, 2015- 2024
6.6. Agricultural Adjuvants Market Forecast, by Type, 2015- 2024
6.7. Agricultural Adjuvants Market Analysis, by Type, 2015- 2024
6.8. Agricultural Adjuvants Market Attractiveness Analysis, by Type, 2015- 2024
7. Global Agricultural adjuvants Market Analysis By Application, 2015- 2024
7.1. Key Trends
7.2. Introduction
7.3. Key Findings
7.4. Type Comparison
7.5. Global Agricultural Adjuvants Market Value Share Analysis, by Application, 2015- 2024
7.6. Agricultural Adjuvants Market Forecast, by Application, 2015- 2024
7.7. Agricultural Adjuvants Market Analysis, by Application, 2015- 2024
7.8. Agricultural Adjuvants Market Attractiveness Analysis, by Application, 2015- 2024
8. Global Agricultural Adjuvants Market Analysis and Forecasts, By Region, 2015-2024
8.1. Global Agricultural Adjuvants Market Scenario, by Region, 2015- 2024
8.2. Global Agricultural Adjuvants Market Value Share Analysis, by Region, 2015- 2024
8.3. Agricultural Adjuvants Market Forecast, by Region, 2015- 2024
8.4. Agricultural Adjuvants Market Attractiveness Analysis, by Region, 2015- 2024
9. North America Agricultural Adjuvants Market Analysis
9.1. Key Findings
9.2. Market Trends- Policies & Regulations
9.3. North America Agricultural Adjuvants Market Overview
9.4. North America Market Value Share Analysis, by Type, 2015 – 2024
9.5. North America Market Forecast, by Type, 2015- 2024
9.6. North America Market Forecast, by Type (Activators)
9.7. North America Market Forecast, by Type (Surfactants)
9.8. North America Market Forecast, by Type (Oil Adjuvants)
9.9. North America Market Forecast, by Type (Utility)
9.10. North America Market Value Share Analysis, by Application, 2015- 2024
9.11. North America Market Forecast, by Application, 2015- 2024
9.12. North America Market Value Share Analysis, by Country, 2015- 2024
9.13. North America Market Forecast, by Country, 2015- 2024
9.14. Market Attractiveness Analysis
9.14.1. By Country
9.14.2. By Type
9.14.3. By Application
9.15. Market Trends
10. Europe Agricultural adjuvants Market Analysis
10.1. Key Findings
10.2. Market Trends- Policies & Regulations
10.3. Europe Agricultural Adjuvants Market Overview
10.4. Europe Market Value Share Analysis, by Type, 2015 – 2024
10.5. Europe Market Forecast, by Type, 2015- 2024
10.6. Europe Market Forecast, by Type (Activators)
10.7. Europe Market Forecast, by Type (Surfactants)
10.8. Europe Market Forecast, by Type (Oil Adjuvants)
10.9. Europe Market Forecast, by Type (Utility)
10.10. Europe Market Value Share Analysis, by Application, 2015- 2024
10.11. Europe Market Forecast, by Application, 2015- 2024
10.12. Europe Market Value Share Analysis, by Country, 2015- 2024
10.13. Europe Market Forecast, by Country, 2015- 2024
10.14. Market Attractiveness Analysis
10.14.1. By Country
10.14.2. By Type
10.14.3. By Application
10.15. Market Trends
11. Asia Pacific Agricultural adjuvants Market Analysis
11.1. Key Findings
11.2. Market Trends- Policies & Regulations
11.3. Asia Pacific Agricultural Adjuvants Market Overview
11.4. Asia Pacific Market Value Share Analysis, by Type, 2015 – 2024
11.5. Asia Pacific Market Forecast, by Type, 2015- 2024
11.6. Asia Pacific Market Forecast, by Type (Activators)
11.7. Asia Pacific Market Forecast, by Type (Surfactants)
11.8. Asia Pacific Market Forecast, by Type (Oil Adjuvants)
11.9. Asia Pacific Market Forecast, by Type (Utility)
11.10. Asia Pacific Market Value Share Analysis, by Application, 2015- 2024
11.11. Asia Pacific Market Forecast, by Application, 2015- 2024
11.12. Asia Pacific Market Value Share Analysis, by Country, 2015- 2024
11.13. Asia Pacific Market Forecast, by Country, 2015- 2024
11.14. Market Attractiveness Analysis
11.14.1. By Country
11.14.2. By Type
11.14.3. By Application
11.15. Market Trends
12. Latin America Agricultural adjuvants Market Analysis
12.1. Key Findings
12.2. Market Trends- Policies & Regulations
12.3. Latin America Agricultural Adjuvants Market Overview
12.4. Latin America Market Value Share Analysis, by Type, 2015 – 2024
12.5. Latin America Market Forecast, by Type, 2015- 2024
12.6. Latin America Market Forecast, by Type (Activators)
12.7. Latin America Market Forecast, by Type (Surfactants)
12.8. Latin America Market Forecast, by Type (Oil Adjuvants)
12.9. Latin America Market Forecast, by Type (Utility)
12.10. Latin America Market Value Share Analysis, by Application, 2015- 2024
12.11. Latin America Market Forecast, by Application, 2015- 2024
12.12. Latin America Market Value Share Analysis, by Country, 2015- 2024
12.13. Latin America Market Forecast, by Country, 2015- 2024
12.14. Market Attractiveness Analysis
12.14.1. By Country
12.14.2. By Type
12.14.3. By Application
12.15. Market Trends
13. Middle East & Africa (MEA) Agricultural adjuvants Market Analysis
13.1. Key Findings
13.2. Market Trends- Policies & Regulations
13.3. Middle East & Africa (MEA) Agricultural Adjuvants Market Overview
13.4. Middle East & Africa (MEA) Market Value Share Analysis, by Type, 2015 – 2024
13.5. Middle East & Africa (MEA) Market Forecast, by Type, 2015- 2024
13.6. Middle East & Africa (MEA) Market Forecast, by Type (Activators)
13.7. Middle East & Africa (MEA) Market Forecast, by Type (Surfactants)
13.8. Middle East & Africa (MEA) Market Forecast, by Type (Oil Adjuvants)
13.9. Middle East & Africa (MEA) Market Forecast, by Type (Utility)
13.10. Middle East & Africa (MEA) Market Value Share Analysis, by Application, 2015- 2024
13.11. Middle East & Africa (MEA) Market Forecast, by Application, 2015- 2024
13.12. Middle East & Africa (MEA) Market Value Share Analysis, by Country, 2015- 2024
13.13. Middle East & Africa (MEA) Market Forecast, by Country, 2015- 2024
13.14. Market Attractiveness Analysis
12.14.1. By Country
12.14.2. By Type
12.14.3. By Application
13.15. Market Trends
14. Competition Landscape
14.1. Competition Matrix
14.2. Agricultural adjuvants Market Share Analysis, by Company (2015)
14.3. Company Profiles
14.3.1. Akzo Nobel N.V.
14.3.1.1. Company Description
14.3.1.2. Business Overview
14.3.1.3. Financial Details
14.3.1.4. SWOT
14.3.1.5. Strategic Overview
14.3.2. Solvay
14.3.2.1. Company Description
14.3.2.2. Business Overview
14.3.2.3. Financial Details
14.3.2.4. SWOT
14.3.2.5. Strategic Overview
14.3.3. Croda International Plc
14.3.3.1. Company Description
14.3.3.2. Business Overview
14.3.3.3. Financial Details
14.3.3.4. SWOT
14.3.3.5. Strategic Overview
14.3.4. Momentive Performance Materials Inc.
14.3.4.1. Company Description
14.3.4.2. Business Overview
14.3.4.3. Financial Details
14.3.4.4. SWOT
14.3.4.5. Strategic Overview
14.3.5. Clariant
14.3.5.1. Company Description
14.3.5.2. Business Overview
14.3.5.3. Financial Details
14.3.5.4. SWOT
14.3.5.5. Strategic Overview
14.3.6. Dow Corning Corporation
14.3.6.1. Company Description
14.3.6.2. Business Overview
14.3.6.3. Financial Details
14.3.6.4. SWOT
14.3.6.5. Strategic Overview
14.3.7. Brandt Consolidated, Inc.
14.3.7.1. Company Description
14.3.7.2. Business Overview
14.3.7.3. Financial Details
14.3.7.4. SWOT
14.3.7.5. Strategic Overview
14.3.8. Lamberti S.p.A.
14.3.8.1. Company Description
14.3.8.2. Business Overview
14.3.8.3. Financial Details
14.3.8.4. SWOT
14.3.8.5. Strategic Overview
14.3.9. Monument Chemical
14.3.9.1. Company Description
14.3.9.2. Business Overview
14.3.9.3. Financial Details
14.3.9.4. SWOT
14.3.9.5. Strategic Overview
14.3.10. Loveland Products, Inc.
14.3.10.1. Company Description
14.3.10.2. Business Overview
14.3.10.3. Financial Details
14.3.10.4. SWOT
14.3.10.5. Strategic Overview
14.3.11. Helena Chemical Company
14.3.11.1. Company Description
14.3.11.2. Business Overview
14.3.11.3. Financial Details
14.3.11.4. SWOT
14.3.11.5. Strategic Overview
15. Key Takeaways
List of Tables
Table 1: Global Agricultural Adjuvants Market Size (US$ Mn) and Volume (Kilo Tons) Forecast, by Type, 2015–2024
Table 2: Global Agricultural Adjuvants Market Size (US$ Mn) and Volume (Kilo Tons) Forecast, by Type (Activator), 2015–2024
Table 3: Global Agricultural Adjuvants Market Size (US$ Mn) and Volume (Kilo Tons) Forecast, by Type (Surfactants),
Table 4: Global Agricultural Adjuvants Market Size (US$ Mn) and Volume (Kilo Tons) Forecast, by Type (Oil Adjuvants), 2015–2024
Table 5: Global Agricultural Adjuvants Market Size (US$ Mn) and Volume (Kilo Tons) Forecast, by Type (Utility), 2015–2024
Table 6: Global Agricultural Adjuvants Market Size (US$ Mn) and Volume (Kilo Tons) Forecast, by Application, 2015–2024
Table 7: Global Agricultural Adjuvants Market Size (US$ Mn) and Volume (Kilo Tons) Forecast, by Region, 2015–2024
Table 8: North America Agricultural Adjuvants Market Size (US$ Mn) and Volume (Kilo Tons) Forecast, by Type, 2015–2024
Table 9: North America Agricultural Adjuvants Market Size (US$ Mn) and Volume (Kilo Tons) Forecast, for Activators, by Type, 2015–2024
Table 10: North America Agricultural Adjuvants Market Size (US$ Mn) and Volume (Kilo Tons) Forecast, for Surfactants, by Type, 2015–2024
Table 11: North America Agricultural Adjuvants Market Size (US$ Mn) and Volume (Kilo Tons) Forecast, for Oil Adjuvants, by Type, 2015–2024
Table 12: North America Agricultural Adjuvants Market Size (US$ Mn) and Volume (Kilo Tons) Forecast, for Utility, by Type, 2015–2024
Table 13: North America Agricultural Adjuvants Market Size (US$ Mn) and Volume (Kilo Tons) Forecast, by Applications, 2015–2024
Table 14: North America Agricultural Adjuvants Market Size (US$ Mn) and Volume (Kilo Tons) Forecast, by Country, 2015–2024
Table 15: Europe Agricultural Adjuvants Market Size (US$ Mn) and Volume (Kilo Tons) Forecast, by Type, 2015–2024
Table 16: Europe Agricultural Adjuvants Market Size (US$ Mn) and Volume (Kilo Tons) Forecast, for Activators, by Type, 2015–2024
Table 17: Europe Agricultural Adjuvants Market Size (US$ Mn) and Volume (Kilo Tons) Forecast, for Surfactants, by Type, 2015–2024
Table 18: Europe Agricultural Adjuvants Market Size (US$ Mn) and Volume (Kilo Tons) Forecast, for Oil Adjuvants, by Type, 2015–2024
Table 19: Europe Agricultural Adjuvants Market Size (US$ Mn) and Volume (Kilo Tons) Forecast, for Utility, by Type, 2015–2024
Table 20: Europe Agricultural Adjuvants Market Size (US$ Mn) and Volume (Kilo Tons) Forecast, by Application, 2015–2024
Table 21: Europe Agricultural Adjuvants Market Size (US$ Mn) and Volume (Kilo Tons) Forecast, by Country, 2015–2024
Table 22: Asia Pacific Agricultural Adjuvants Market Size (US$ Mn) and Volume (Kilo Tons) Forecast, by Type, 2015–2024
Table 23: Asia Pacific Agricultural Adjuvants Market Size (US$ Mn) and Volume (Kilo Tons) Forecast, for Activators, by Type, 2015–2024
Table 24: Asia Pacific Agricultural Adjuvants Market Size (US$ Mn) and Volume (Kilo Tons) Forecast, for Surfactants by Type, 2015–2024
Table 25: Asia Pacific Agricultural Adjuvants Market Size (US$ Mn) and Volume (Kilo Tons) Forecast, for Oil Adjuvants, by Type, 2015–2024
Table 26: Global Agricultural Adjuvants Market Size (US$ Mn) and Volume (Kilo Tons) Forecast, for Utility, by Type, 2015–2024
Table 27: Asia Pacific Agricultural Adjuvants Market Size (US$ Mn) and Volume (Kilo Tons) Forecast, by Application Type, 2015–2024
Table 28: APAC Agricultural Adjuvants Market Size (US$ Mn) and Volume (Kilo Tons) Forecast, by Country, 2015–2024
Table 29: Latin America Agricultural Adjuvants Market Size (US$ Mn) and Volume (Kilo Tons) Forecast, by Type, 2015–2024
Table 30: Latin America Agricultural Adjuvants Market Size (US$ Mn) and Volume (Kilo Tons) Forecast, for Activators by Type, 2015–2024
Table 31: Latin America Agricultural Adjuvants Market Size (US$ Mn) and Volume (Kilo Tons) Forecast, for Surfactants by Type, 2015–2024
Table 32: Latin America Agricultural Adjuvants Market Size (US$ Mn) and Volume (Kilo Tons) Forecast, for Oil Adjuvants by Type, 2015–2024
Table 33: Latin America Agricultural Adjuvants Market Size (US$ Mn) and Volume (Kilo Tons) Forecast, for Utility by Type, 2015–2024
Table 34: Latin America Agricultural Adjuvants Market Size (US$ Mn) and Volume (Kilo Tons) Forecast, by Application, 2015–2024
Table 35: Latin America Agricultural Adjuvants Market Size (US$ Mn) and Volume (Kilo Tons) Forecast, by Country, 2015–2024
Table 36: Middle East & Africa Agricultural Adjuvants Market Size (US$ Mn) and Volume (Kilo Tons) Forecast, by Type, 2015–2024
Table 37: Global Agricultural Adjuvants Market Size (US$ Mn) and Volume (Kilo Tons) Forecast, for Activators, by Type, 2015–2024
Table 38: Global Agricultural Adjuvants Market Size (US$ Mn) and Volume (Kilo Tons) Forecast, for Surfactants, by Type, 2015–2024
Table 39: Global Agricultural Adjuvants Market Size (US$ Mn) and Volume (Kilo Tons) Forecast, for Oil Adjuvants, by Type, 2015–2024
Table 40: Global Agricultural Adjuvants Market Size (US$ Mn) and Volume (Kilo Tons) Forecast, for Utility, by Type, 2015–2024
Table 41: Middle East & Africa Agricultural Adjuvants Market Size (US$ Mn) and Volume (Kilo Tons) Forecast, by Application, 2015–2024
Table 42: MEA Agricultural Adjuvants Market Size (US$ Mn) and Volume (Kilo Tons) Forecast, by Country, 2015–2024
List of Figures
Figure 1: Global Agricultural Adjuvants Market Size, by Market Value (US$ Mn) and Market Value Share
Figure 2: Regional Overview, 2015
Figure 3: Top 3 Application Share, 2015–2024
Figure 4: Segment-wise Market Share of Agrochemicals (2015)
Figure 5: Global Agricultural Adjuvants Market Size (US$ Mn) and Volume (Kilo Tons) Forecast, 2015–2024
Figure 6: Global Agricultural Adjuvants Prices (US$ Mn/Kilo Ton)
Figure 7: Global Agricultural Adjuvants Market Value Share Analysis, by Type, 2015 and 2024
Figure 8: Global Agricultural Adjuvants Market Size Value (US$ Mn) and Volume (Kilo Tons) Analysis, by Activator, 2015–2024
Figure 9: Global Agricultural Adjuvants Market Size Value (US$ Mn) and Volume (Kilo Tons) Analysis, by Utility, 2015–2024
Figure 10: Global Agricultural Adjuvants Market Attractiveness Analysis, by Type (2015)
Figure 11: Global Agricultural Adjuvants Market Value Share Analysis, by Application, 2015 and 2024
Figure 12: Global Agricultural Adjuvants Market Size Value (US$ Mn) and Volume (Kilo Tons) Analysis, by Herbicides, 2015–2024
Figure 13: Global Agricultural Adjuvants Market Size Value (US$ Mn) and Volume (Kilo Tons) Analysis, by Insecticides, 2015–2024
Figure 14: Global Agricultural Adjuvants Market Size Value (US$ Mn) and Volume (Kilo Tons) Analysis, by Fungicides, 2015–2024
Figure 15: Global Agricultural Adjuvants Market Size Value (US$ Mn) and Volume (Kilo Tons) Analysis, by Others, 2015–2024
Figure 16: Global Agricultural Adjuvants Market Attractiveness Analysis, by Application (2015)
Figure 17: Global Agricultural Adjuvants Market Value Share Analysis, by Region, 2015 and 2024
Figure 18: Agricultural Adjuvants Market Attractiveness Analysis, by Region, 2015
Figure 19: North America Agricultural Adjuvants Market Size (US$ Mn) and Volume (Kilo Tons) Forecast, 2015–2024
Figure 20: North America Agricultural Adjuvants Market Size and Volume Y-o-Y Growth Projection, 2015–2024
Figure 21: North America Market Attractiveness Analysis, by Country
Figure 22: North America Market Value Share Analysis, by Type, 2015 and 2024
Figure 23: North America Market Value Share Analysis, by Applications, 2015 and 2024
Figure 24: North America Market Value Share Analysis, by Country, 2015 and 2024
Figure 26: North America Market Attractiveness Analysis, By Application
Figure 25: North America Market Attractiveness Analysis, By Type
Figure 27: Europe Agricultural Adjuvants Market Size (US$ Mn) and Volume (Kilo Tons) Forecast, 2015–2024
Figure 28: Europe Agricultural Adjuvants Market Size and Volume Y-o-Y Growth Projection, 2015–2024
Figure 29: Europe Agricultural Adjuvants Market Attractiveness Analysis, by Country
Figure 30: Europe Market Value Share Analysis, by Type, 2015 and 2024
Figure 31: Europe Market Value Share Analysis, by Application, 2015 and 2024
Figure 32: Europe Agricultural Adjuvants Market Value Share Analysis, by Country, 2015 and 2024
Figure 34: Europe Agricultural Adjuvants Market Attractiveness Analysis, By Application
Figure 33: Europe Agricultural Adjuvants Market Attractiveness Analysis, By Product Type
Figure 35: Asia Pacific Agricultural Adjuvants Market Size (US$ Mn) and Volume (Kilo Tons) Forecast, 2015–2024
Figure 36: Asia Pacific Agricultural Adjuvants Market Size and Volume Y-o-Y Growth Projection, 2015–2024
Figure 37: Asia Pacific Market Attractiveness Analysis, by Country (2015)
Figure 38: Asia Pacific Market Value Share Analysis, by Type, 2015 and 2024
Figure 39: Asia Pacific Market Value Share Analysis, by Application Type, 2015 and 2024
Figure 40: Asia Pacific Market Value Share Analysis, by Country, 2016 and 2024
Figure 42: Asia Pacific Market Attractiveness Analysis, by Application, 2015
Figure 41: Asia Pacific Market Attractiveness Analysis, by Type, 2015
Figure 43: Latin America Agricultural Adjuvants Market Size (US$ Mn) and Volume (Kilo Tons) Forecast, 2015–2024
Figure 44: Latin America Agricultural Adjuvants Market Size and Volume Y-o-Y Growth Projection, 2015–2024
Figure 45: Latin America Agricultural Adjuvants Market Attractiveness Analysis, by Country
Figure 46: Latin America Market Value Share Analysis, by Type, 2015 and 2024
Figure 47: Latin America Market Value Share Analysis, by Application, 2015 and 2024
Figure 48: Latin America Market Value Share Analysis, by Country, 2015 and 2024
Figure 50: Latin America Market Attractiveness Analysis, By Application
Figure 49: Latin America Market Attractiveness Analysis, By Type
Figure 51: Middle East & Africa Agricultural Adjuvants Market Size (US$ Mn) and Volume (Kilo Tons) Forecast, 2015–2024
Figure 52: Middle East & Africa Agricultural Adjuvants Market Size and Volume Y-o-Y Growth Projections, 2015–2024
Figure 53: Middle East & Africa Market Attractiveness Analysis, by Country (2015)
Figure 54: Middle East & Africa Market Value Share Analysis, by Type, 2015 and 2024
Figure 55: Middle East & Africa Market Value Share Analysis, by Application, 2015 and 2024
Figure 56: Middle East & Africa Market Value Share Analysis, by Country, 2015 and 2024
Figure 58: Middle East & Africa Market Attractiveness Analysis, by Application, 2015
Figure 57: Middle East & Africa Market Attractiveness Analysis, by Type, 2015
Figure 59: Global Agricultural Adjuvants Market Share Analysis, by Company (2015)
Copyright © Transparency Market Research, Inc. All Rights reserved
Trust Online

Agricultural Adjuvants Market Outlook, 2016-2024