
To know the scope of our report Get a Sample on Osteoporosis Drugs Market?
Get a glimpse of the in-depth analysis through our Report Brochure
Expanding operations in future? To get the perfect launch ask for a custom report
Key players in the global osteoporosis drugs market are engaged in regulatory approvals, launch of new products, and acquisition & collaborative agreements with other companies. These strategies are likely to fuel the growth of the global osteoporosis drugs market. A few expansion strategies adopted by players operating in the global Osteoporosis Drugs market are:
The report on the global Osteoporosis Drugs market discussed individual strategies, followed by company profiles of manufacturers of Osteoporosis Drugs. The competitive landscape section has been included in the report to provide readers with a dashboard view and a company market share analysis of key players operating in the global Osteoporosis Drugs market.
Global Osteoporosis Drugs Market – Segmentation
|
Drug Class |
Bisphosphonates Calcitonin RANK Ligand Inhibitor Parathyroid Hormone Therapy (PTH) Selective Estrogen Receptor Modulators (SERMs) Sclerostin Inhibitor Others |
|
Region |
North America Europe Asia Pacific Latin America Middle East & Africa |
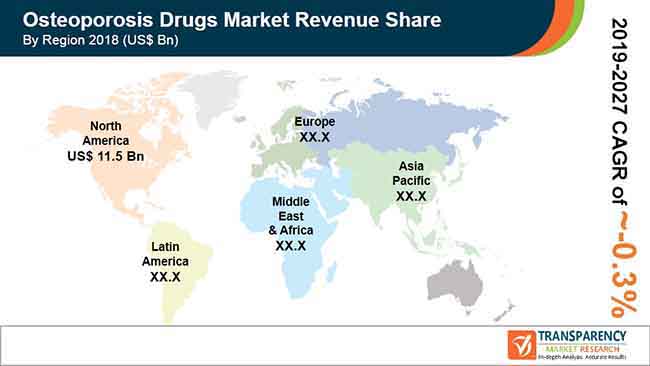
Osteoporosis drugs market is expected to reach US$ 11.7 bn by 2027
Osteoporosis drugs market is anticipated to contract at a CAGR of 0.3% from 2019 to 2027
Osteoporosis drugs market is driven by growing prevalence of osteoporosis across globe
North America accounted for a major share of the global osteoporosis drugs market owing to the presence of large number of osteoporosis patients
Key players operating in the global Osteoporosis Drugs market include Eli Lilly and Company, Pfizer, Inc., Amgen, Inc., Merck & Co., Inc., Radius Health, Inc.
1. Preface
1.1. Market Definition and Scope
1.2. Market Segmentation
1.3. Key Research Objectives
1.4. Research Highlights
2. Assumptions and Research Methodology
3. Executive Summary : Global Osteoporosis Drugs Market
4. Market Overview
4.1. Introduction
4.1.1. Drug ClassDefinition
4.1.2. Industry Evolution / Developments
4.2. Overview
4.3. Market Dynamics
4.3.1. Drivers
4.3.2. Restraints
4.3.3. Opportunities
4.4. Global Osteoporosis Drugs Market Analysis and Forecasts, 2017–2027
4.4.1. Market Revenue Projections (US$ Mn)
5. Market Outlook
5.1. Pipeline Analysis
5.2. Value Chain Analysis
5.3. Key Mergers, Acquisition, and Strategic Partnerships
5.4. Osteoporosis Prevalence Globally with Key regions and Countries
6. Global Osteoporosis Drugs Market Analysis and Forecasts, By Drug Class
6.1. Introduction & Definition
6.2. Key Findings / Developments
6.3. Market Value Forecast By Drug Type, 2017–2027
6.3.1. Bisphosphonates
6.3.2. Calcitonin
6.3.3. RANK Ligand Inhibitors
6.3.4. Selective Estrogen Receptor Modulators (SERMs)
6.3.5. Parathyroid Hormone Therapy (PTH) Drugs
6.3.6. Sclerostin Inhibitors
6.3.7. Others
6.4. Market Attractiveness By Drug Class
7. Global Osteoporosis Drugs Market Analysis and Forecasts, By Region
7.1. Key Findings
7.2. Market Value Forecast By Region
7.2.1. North America
7.2.2. Europe
7.2.3. Asia Pacific
7.2.4. Latin America
7.2.5. Middle East & Africa
7.3. Market Attractiveness By Country/Region
8. North America Osteoporosis Drugs Market Analysis and Forecast
8.1. Introduction
8.1.1. Key Findings
8.2. Market Value Forecast By Drug Type, 2017–2027
8.2.1. Bisphosphonates
8.2.2. Calcitonin
8.2.3. RANK Ligand Inhibitors
8.2.4. Selective Estrogen Receptor Modulators (SERMs)
8.2.5. Parathyroid Hormone Therapy (PTH) Drugs
8.2.6. Sclerostin Inhibitors
8.2.7. Others
8.3. Market Value Forecast By Country, 2017–2027
8.3.1. U.S.
8.3.2. Canada
8.4. Market Attractiveness Analysis
8.4.1. By Drug Class
8.4.2. By Country
9. Europe Osteoporosis Drugs Market Analysis and Forecast
9.1. Introduction
9.1.1. Key Findings
9.2. Market Value Forecast By Drug Type, 2017–2027
9.2.1. Bisphosphonates
9.2.2. Calcitonin
9.2.3. RANK Ligand Inhibitors
9.2.4. Selective Estrogen Receptor Modulators (SERMs)
9.2.5. Parathyroid Hormone Therapy (PTH) Drugs
9.2.6. Sclerostin Inhibitors
9.2.7. Others
9.3. Market Value Forecast By Country, 2017–2027
9.3.1. Germany
9.3.2. U.K.
9.3.2. France
9.3.2. Italy
9.3.2. Spain
9.3.2. Rest of Europe
9.4. Market Attractiveness Analysis
9.4.1. By Drug Class
9.4.2. By Country
10. Asia Pacific Osteoporosis Drugs Market Analysis and Forecast
10.1. Introduction
10.1.1. Key Findings
10.2. Market Value Forecast By Drug Type, 2017–2027
10.2.1. Bisphosphonates
10.2.2. Calcitonin
10.2.3. RANK Ligand Inhibitors
10.2.4. Selective Estrogen Receptor Modulators (SERMs)
10.2.5. Parathyroid Hormone Therapy (PTH) Drugs
10.2.6. Sclerostin Inhibitors
10.2.7. Others
10.3. Market Value Forecast By Country, 2017–2027
10.3.1. China
10.3.2. Japan
10.3.2. India
10.3.2. Australia & New Zealand
10.3.2. Rest of Asia Pacific
10.4. Market Attractiveness Analysis
10.4.1. By Drug Class
10.4.2. By Country
11. Latin America Osteoporosis Drugs Market Analysis and Forecast
11.1. Introduction
11.1.1. Key Findings
11.2. Market Value Forecast By Drug Type, 2017–2027
11.2.1. Bisphosphonates
11.2.2. Calcitonin
11.2.3. RANK Ligand Inhibitors
11.2.4. Selective Estrogen Receptor Modulators (SERMs)
11.2.5. Parathyroid Hormone Therapy (PTH) Drugs
11.2.6. Sclerostin Inhibitors
11.2.7. Others
11.3. Market Value Forecast By Country, 2017–2027
11.3.1. Brazil
11.3.2. Mexico
11.3.2. Rest of Latin America
11.4. Market Attractiveness Analysis
11.4.1. By Drug Class
11.4.2. By Country
12. Middle East & Africa Osteoporosis Drugs Market Analysis and Forecast
12.1. Introduction
12.1.1. Key Findings
12.2. Market Value Forecast By Drug Type, 2017–2027
12.2.1. Bisphosphonates
12.2.2. Calcitonin
12.2.3. RANK Ligand Inhibitors
12.2.4. Selective Estrogen Receptor Modulators (SERMs)
12.2.5. Parathyroid Hormone Therapy (PTH) Drugs
12.2.6. Sclerostin Inhibitors
12.2.7. Others
12.3. Market Value Forecast By Country, 2017–2027
12.3.1. GCC Countries
12.3.2. South Africa
12.3.2. Rest of Middle East & Africa
12.4. Market Attractiveness Analysis
12.4.1. By Drug Class
12.4.2. By Country
13. Competition Landscape
13.1. Market Player – Competition Matrix (By Tier and Size of companies)
13.2. Market Share/Poisition Analysis By Company (2018)
13.3. Company Profiles
13.3.1. Eli Lilly and Company
13.3.1.1. Company Overview (HQ, Business Segments, Employee Strength)
13.3.1.2. Company Financials
13.3.1.3. Growth Strategies
13.3.1.4. SWOT Analysis
13.3.2. Amgen, Inc.
13.3.2.1. Company Overview (HQ, Business Segments, Employee Strength)
13.3.2.2. Company Financials
13.3.2.3. Growth Strategies
13.3.2.4. SWOT Analysis
13.3.3. F.Hoffmann-La Roche Ltd.
13.3.3.1. Company Overview (HQ, Business Segments, Employee Strength)
13.3.3.2. Company Financials
13.3.3.3. Growth Strategies
13.3.3.4. SWOT Analysis
13.3.4. Merck & Co., Inc.
13.3.4.1. Company Overview (HQ, Business Segments, Employee Strength)
13.3.4.2. Company Financials
13.3.4.3. Growth Strategies
13.3.4.4. SWOT Analysis
13.3.5. Novartis AG
13.3.5.1. Company Overview (HQ, Business Segments, Employee Strength)
13.3.5.2. Company Financials
13.3.5.3. Growth Strategies
13.3.5.4. SWOT Analysis
13.3.6. Novo Nordisk A/S
13.3.6.1. Company Overview (HQ, Business Segments, Employee Strength)
13.3.6.2. Company Financials
13.3.6.3. Growth Strategies
13.3.6.4. SWOT Analysis
13.3.7. Teva Pharmaceutical Industries Ltd.
13.3.7.1. Company Overview (HQ, Business Segments, Employee Strength)
13.3.7.2. Company Financials
13.3.7.3. Growth Strategies
13.3.7.4. SWOT Analysis
13.3.8. Pfizer, Inc.
13.3.8.1. Company Overview (HQ, Business Segments, Employee Strength)
13.3.8.2. Company Financials
13.3.8.3. Growth Strategies
13.3.8.4. SWOT Analysis
13.3.9. Radius Health, Inc.
13.3.9.1. Company Overview (HQ, Business Segments, Employee Strength)
13.3.9.2. Company Financials
13.3.9.3. Growth Strategies
13.3.9.4. SWOT Analysis
13.3.10. Apotex Inc.
13.3.10.1. Company Overview (HQ, Business Segments, Employee Strength)
13.3.10.2. Company Financials
13.3.10.3. Growth Strategies
13.3.10.4. SWOT Analysis
List of Table
Table 01: Pipeline Analysis
Table 02: Key Mergers, Acquisition, and Strategic Partnerships
Table 03: Global Osteoporosis Drugs Market Value (US$ Mn) Forecast, by Drug Class, 2017–2027
Table 04: Global Osteoporosis Drugs Market Value (US$ Mn) Forecast, by Region, 2017–2027
Table 05: North America Osteoporosis Drugs Market Value (US$ Mn) Forecast, by Country, 2017–2027
Table 06: North America Osteoporosis Drugs Market Value (US$ Mn) Forecast, by Drug Class, 2017–2027
Table 07: Europe Osteoporosis Drugs Market Value (US$ Mn) Forecast, by Country/Sub-region, 2017–2027
Table 08: Europe Osteoporosis Drugs Market Value (US$ Mn) Forecast, by Drug Class, 2017–2027
Table 09: Asia Pacific Osteoporosis Drugs Market Value (US$ Mn) Forecast, by Country/Sub-region, 2017–2027
Table 10: Asia Pacific Osteoporosis Drugs Market Value (US$ Mn) Forecast, by Drug Class, 2017–2027
Table 11: Latin America Osteoporosis Drugs Market Value (US$ Mn) Forecast, by Country/Sub-region, 2017–2027
Table 12: Latin America Osteoporosis Drugs Market Value (US$ Mn) Forecast, by Drug Class, 2017–2027
Table 13: Middle East & Africa Osteoporosis Drugs Market Value (US$ Mn) Forecast, by Country/Sub-region, 2017–2027
Table 14: Middle East & Africa Osteoporosis Drugs Market Value (US$ Mn) Forecast, by Drug Class, 2017–2027
List of Figure
Figure 01: Global Osteoporosis Drugs Market Size (US$ Mn) and Distribution, by Region, 2018 and 2027
Figure 02: Global Osteoporosis Drugs Market Value (US$ Mn), by Drug Class, 2018 (A)
Figure 03: Global Osteoporosis Drugs Market, Top 3 Trends, 2018
Figure 04: Market Overview
Figure 05: Global Osteoporosis Drugs Market Value (US$ Mn) Forecast, 2017–2027
Figure 06: Global Osteoporosis Drugs Market Value Share, by Drug Class (2018)
Figure 07: Global Osteoporosis Drugs Market Value Share, by Region(2018)
Figure 08: Global Osteoporosis Drugs Market Value Share Analysis, by Drug Class, 2018 and 2027
Figure 09: Market Opportunity Map, by Drug Class
Figure 10: Snapshot, Value Chain Analysis
Figure 11: Snapshot, Osteoporosis Prevalence Globally
Figure 12: Global Osteoporosis Drugs Market Revenue (US$ Mn) and Y-o-Y Growth (%), by Bisphosphonates, 2017-2027
Figure 13: Global Osteoporosis Drugs Market Revenue (US$ Mn) and Y-o-Y Growth (%), by Calcitonin , 2017-2027
Figure 14: Global Osteoporosis Drugs Market Revenue (US$ Mn) and Y-o-Y Growth (%), by RANK Ligand Inhibitor , 2017-2027
Figure 15: Global Osteoporosis Drugs Market Revenue (US$ Mn) and Y-o-Y Growth (%), by Selective Estrogen Receptor Modulators (SERMs) , 2017-2027
Figure 16: Global Osteoporosis Drugs Market Revenue (US$ Mn) and Y-o-Y Growth (%), by Parathyroid Hormone Therapy (PTH) Drugs , 2017-2027
Figure 17: Global Osteoporosis Drugs Market Revenue (US$ Mn) and Y-o-Y Growth (%), by Sclerostin Inhibitors , 2017-2027
Figure 18: Global Osteoporosis Drugs Market Revenue (US$ Mn) and Y-o-Y Growth (%), by Others , 2017-2027
Figure 19: Global Osteoporosis Drugs Market Attractiveness Analysis, by Drug Class 2019-2027
Figure 20: Global Osteoporosis Drugs Market Attractiveness Analysis, by Region, 2019–2027
Figure 21: North America Osteoporosis Drugs Market Value (US$ Mn) Forecast and Y-o-Y Growth Projection (%), 2017–2027
Figure 22: North America Osteoporosis Drugs Market Value Share, by Country, 2018 and 2027
Figure 23: North America Osteoporosis Drugs Market Attractiveness, by Country, 2019–2027
Figure 24: North America Osteoporosis Drugs Market Value Share, by Drug Class, 2018 and 2027
Figure 25: North America Osteoporosis Drugs Market Attractiveness, by Drug Class, 2019–2027
Figure 26: Europe Osteoporosis Drugs Market Value (US$ Mn) Forecast and Y-o-Y Growth Projection (%), 2017–2027
Figure 27: Europe Osteoporosis Drugs Market Value Share, by Country, 2018 and 2027
Figure 28: Europe Osteoporosis Drugs Market Attractiveness, by Country, 2019–2027
Figure 29: Europe Osteoporosis Drugs Market Value Share, by Drug Class, 2018 and 2027
Figure 30: Europe Osteoporosis Drugs Market Attractiveness, by Drug Class, 2019–2027
Figure 31: Asia Pacific Osteoporosis Drugs Market Value (US$ Mn) Forecast and Y-o-Y Growth Projection (%), 2017–2027
Figure 32: Asia Pacific Osteoporosis Drugs Market Value Share, by Country, 2018 and 2027
Figure 33: Asia Pacific Osteoporosis Drugs Market Attractiveness, by Country, 2019–2027
Figure 34: Asia Pacific Osteoporosis Drugs Market Value Share, by Drug Class, 2018 and 2027
Figure 35: Asia Pacific Osteoporosis Drugs Market Attractiveness, by Drug Class, 2019–2027
Figure 36: Latin America Osteoporosis Drugs Market Value (US$ Mn) Forecast and Y-o-Y Growth Projection (%), 2017–2027
Figure 37: Latin America Osteoporosis Drugs Market Value Share, by Country, 2018 and 2027
Figure 38: Latin America Osteoporosis Drugs Market Attractiveness, by Country, 2019–2027
Figure 39: Latin America Osteoporosis Drugs Market Value Share, by Drug Class, 2018 and 2027
Figure 40: Latin America Osteoporosis Drugs Market Attractiveness, by Drug Class, 2019–2027
Figure 41: Middle East & Africa Osteoporosis Drugs Market Value (US$ Mn) Forecast and Y-o-Y Growth Projection (%), 2017–2027
Figure 42: Middle East & Africa Osteoporosis Drugs Market Value Share, by Country, 2018 and 2027
Figure 43: Middle East & Africa Osteoporosis Drugs Market Attractiveness, by Country, 2019–2027
Figure 44: Middle East & Africa Osteoporosis Drugs Market Value Share, by Drug Class, 2018 and 2027
Figure 45: Middle East & Africa Osteoporosis Drugs Market Attractiveness, by Drug Class, 2019–2027
Figure 46: Market Position/Ranking Analysis, 2018, by Tier and Size of the Company
Figure 47: Eli Lilly and Company, Revenue (US$ Mn) and Y-o-Y Growth (%), 2015–2018
Figure 48: Eli Lilly and Company, R&D Expenses (US$ Mn) and Y-o-Y Growth (%), 2015–2018
Figure 49: Eli Lilly and Company, Breakdown of Net Sales, by Region, 2018
Figure 50: Eli Lilly and Company, Breakdown of Net Sales, by Business Segment, 2018
Figure 51: Amgen, Inc., Revenue (US$ Mn) and Y-o-Y Growth (%), 2015–2018
Figure 52: Amgen, Inc., R&D Expenses (US$ Mn) and Y-o-Y Growth (%), 2015–2018
Figure 53: Amgen, Inc., Breakdown of Net Sales, by Region, 2018
Figure 54: Amgen, Inc., Breakdown of Net Sales, by Business Segment, 2018
Figure 55: F.Hoffmann-La Roche Ltd., Revenue (US$ Mn) and Y-o-Y Growth (%), 2015–2018
Figure 56: F.Hoffmann-La Roche Ltd., R&D Expenses (US$ Mn) and Y-o-Y Growth (%), 2015–2018
Figure 57: F.Hoffmann-La Roche Ltd., Breakdown of Net Sales, by Region, 2018
Figure 58: F.Hoffmann-La Roche Ltd., Breakdown of Net Sales, by Business Segment, 2018
Figure 59: Merck & Co., Inc., Revenue (US$ Mn) and Y-o-Y Growth (%), 2015–2018
Figure 60: Merck & Co., Inc., R&D Expenses (US$ Mn) and Y-o-Y Growth (%), 2015–2018
Figure 61: Merck & Co., Inc., Breakdown of Net Sales, by Region, 2018
Figure 62: Merck & Co., Inc., Breakdown of Net Sales, by Business Segment, 2018
Figure 63: Novartis AG, Revenue (US$ Mn) and Y-o-Y Growth (%), 2015–2018
Figure 64: Novartis AG, R&D Expenses (US$ Mn) and Y-o-Y Growth (%), 2015–2018
Figure 65: Novartis AG, Breakdown of Net Sales, by Region, 2018
Figure 66: Novartis AG, Breakdown of Net Sales, by Business Segment, 2018
Figure 67: Novo Nordisk A/S, Revenue (US$ Mn) and Y-o-Y Growth (%), 2015–2018
Figure 68: Novo Nordisk A/S, R&D Expenses (US$ Mn) and Y-o-Y Growth (%), 2015–2018
Figure 69: Novo Nordisk A/S, Breakdown of Net Sales, by Region, 2018
Figure 70: Novo Nordisk A/S, Breakdown of Net Sales, by Business Segment, 2018
Figure 71: Teva Pharmaceutical Industries Ltd., Revenue (US$ Mn) and Y-o-Y Growth (%), 2015–2018
Figure 72: Teva Pharmaceutical Industries Ltd., R&D Expenses (US$ Mn) and Y-o-Y Growth (%), 2015–2018
Figure 73: Teva Pharmaceutical Industries Ltd., Breakdown of Net Sales, by Region, 2018
Figure 74: Teva Pharmaceutical Industries Ltd., Breakdown of Net Sales, by Business Segment, 2018
Figure 75: Pfizer, Inc., Revenue (US$ Mn) and Y-o-Y Growth (%), 2015–2018
Figure 76: Pfizer, Inc., R&D Expenses (US$ Mn) and Y-o-Y Growth (%), 2015–2018
Figure 77: Pfizer, Inc., Breakdown of Net Sales, by Region, 2018
Figure 78: Pfizer, Inc., Breakdown of Net Sales, by Business Segment, 2018
Figure 79: Radius Health, Inc., Revenue (US$ Mn) and Y-o-Y Growth (%), 2015–2018
Figure 80: Radius Health, Inc., R&D Expenses (US$ Mn) and Y-o-Y Growth (%), 2015–2018
Figure 81: Radius Health, Inc., Breakdown of Net Sales, by Region, 2018
Figure 82: Radius Health, Inc., Breakdown of Net Sales, by Business Segment, 2018
Figure 83: Apotex Inc., Revenue (US$ Mn) and Y-o-Y Growth (%), 2015–2018
Figure 84: Apotex Inc., R&D Expenses (US$ Mn) and Y-o-Y Growth (%), 2015–2018
Figure 85: Apotex Inc., Breakdown of Net Sales, by Region, 2018
Figure 86: Apotex Inc., Breakdown of Net Sales, by Business Segment, 2018
Copyright © Transparency Market Research, Inc. All Rights reserved
Trust Online


Osteoporosis Drugs Market