
Reports
Reports
Multiple sclerosis is classified as a chronic, autoimmune, and inflammatory disease of the central nervous system, which affects the communication between different parts of the body and the brain.
According to the National Multiple Sclerosis Society, over 1 million individuals have multiple sclerosis in the U.S. alone, and around 2.3 million people worldwide. These numbers continue to grow each year, which in turn makes it imperative to discover multiple sclerosis drugs with improved effectiveness and minimum side effects.
Government and non-government entities in developed and developing regions are stepping up their efforts toward spreading awareness related to multiple sclerosis and are allocating substantial funds for research and development of new drugs.
Progress in life sciences and healthcare in the past decade, number of promising pipeline drug development projects, surge in the number of incidences of multiple sclerosis, and unmet needs pertaining to multiple sclerosis are some of the leading factors that are expected to accelerate the growth of the market during the forecast period (2019-2027). Thus, the global multiple sclerosis drugs market, which was valued at US$ 20 Bn in 2019, is expected to reach US$ 31.5 Bn by 2027.

Although prevalence of multiple sclerosis dates back to more than a hundred years, the first wave of drugs that exhibited moderate efficacy levels to treat multiple sclerosis gained approval 25 years ago. Since then, despite significant research, stakeholders were yet to find a treatment or a drug to cure multiple sclerosis.
In 2017, the Food and Drug Administration (FDA) gave the approval for Ocrevus ™ (ocrelizumab), a newly developed medication that has shown promising results in slowing down the progression of multiple sclerosis, and is also one of the first drugs to receive the approval for the treatment of primary-progressive multiple sclerosis.
Clinical trials revealed that patients who were given doses of ocrelizumab exhibited fewer brain lesions and a significantly lower relapse rate. Furthermore, this drug showed greater efficacy in minimizing the annual relapse rate and a number of lesions that could be seen on MRI scans than interferon beta 1a (one of the most extensively used drugs to treat multiple sclerosis).
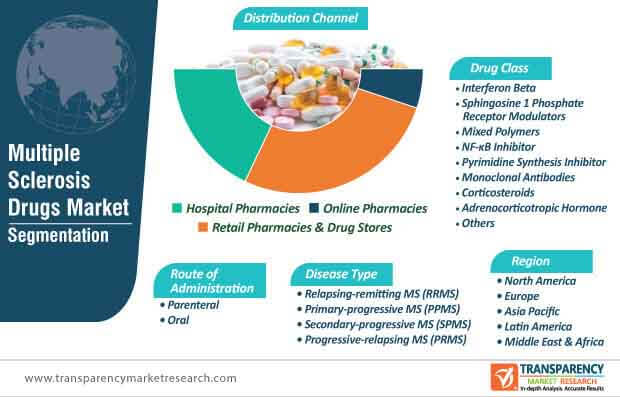
At present, monoclonal antibodies and Interferon-β are some of the most popular drugs used in the treatment of multiple sclerosis. Monoclonal antibodies drug class segment are likely to retain the lead the multiple sclerosis drugs market during the forecast period and account for a market share of 40% by the end of 2027. ;
Although there is no known cure for multiple sclerosis, the adoption of new medications to slow down the progression of multiple sclerosis and manage symptoms is on the rise. In the current scenario, research and development is playing a key role in the development of new treatments.
Traditionally, disease-modifying therapies (DMTs) are the main type of medication used to treat multiple sclerosis. Players operating in the multiple sclerosis drugs industry are focusing their efforts on gaining approval from the FDA for their newly developed drugs.
In recent times, the FDA has approved a range of disease-modifying therapies to treat different types of multiple sclerosis. Most recently, the FDA approved Fingolimod (Gilenya) to treat pediatric multiple sclerosis and glatiramer acetate injections (Glatopa). While new treatments and medications are receiving FDA approval, several other multiple sclerosis drugs are in the research pipeline and expected to enter the market during the forecast period.
For instance, a relatively recent phase III clinical trial revealed that siponimod, a potential multiple sclerosis drug, could reduce the relapse rate among individuals suffering from secondary progressive multiple sclerosis. Similarly, the findings from a recent phase II clinical trial suggested that ibudilast could potentially hamper the progression of disability in patients with multiple sclerosis.
Despite the onset of new oral medications, injectable multiple sclerosis drugs are expected to have a higher demand during the forecast period. Thus, in terms of route of administration, the parenteral segment of the multiple sclerosis drugs market is expected to reach a market value of US$ 12.7 Bn in 2020 and hold a market share of 63% in the same year.
Analysts’ Viewpoint
The global multiple sclerosis drugs market is expected to grow at a CAGR of 5.9% during the forecast period. The growth of the market can be primarily attributed to the significant rise in the number of research projects focusing on the discovery of new multiple sclerosis drugs with improved efficacy.
Stakeholders should focus on gaining approval from the FDA for their newly developed multiple sclerosis drugs and simultaneously turn toward mergers and acquisitions to enhance their footprint in the current market of multiple sclerosis drugs.
Stakeholders should also focus on streamlining their distribution channels and explore opportunities within the e-Commerce sector.
It is expected to reach US$ 31.5 Bn by 2027
It is projected to expand at a CAGR of 5.9% during 2017 - 2027
Multiple sclerosis drugs market is driven by rise in prevalence and incidence of multiple sclerosis across the globe
North America accounted for a major share of the global market
Bayer AG, Teva Pharmaceutical Industries Ltd., Novartis AG, Sanofi, F. Hoffmann-La Roche Ltd.
1. Preface
1.1. Market Definition and Scope
1.2. Market Segmentation
1.3. Key Research Objectives
1.4. Research Highlights
2. Assumptions and Research Methodology
3. Executive Summary: Global Multiple Sclerosis Drugs Market
4. Market Overview
4.1. Introduction
4.1.1. Multiple Sclerosis Drugs Market Introduction
4.1.2. Industry Evolution / Developments
4.2. Overview
4.3. Market Dynamics
4.3.1. Drivers
4.3.2. Restraints
4.3.3. Opportunities
4.4. Global Multiple Sclerosis Drugs Market Analysis and Forecast, 2017-2027
4.4.1. Market Revenue Projections (US$ Mn)
5. Key Insights
5.1. Pipeline Analysis
5.2. Regulatory Scenario
5.3. Disease Epidemiology
5.4. Market Access Overview
5.5. Key Mergers & Acquisitions
6. Global Multiple Sclerosis Drugs Market Analysis and Forecast, by Drug Class
6.1. Introduction & Definition
6.2. Key Findings / Developments
6.3. Market Value Forecast, by Drug Class, 2017-2027
6.3.1. Interferon Beta
6.3.2. Sphingosine 1 Phosphate Receptor Modulators
6.3.3. Mixed Polymers
6.3.4. NF-κB Inhibitor
6.3.5. Pyrimidine Synthesis Inhibitor
6.3.6. Monoclonal Antibodies
6.3.7. Corticosteroids
6.3.8. Adrenocorticotropic Hormone
6.3.9. Others
6.4. Market Attractiveness, by Drug Class
7. Global Multiple Sclerosis Drugs Market Analysis and Forecast, by Disease Type
7.1. Introduction & Definition
7.2. Key Findings / Developments
7.3. Market Value Forecast, by Disease Type, 2017-2027
7.3.1. Relapsing-remitting MS (RRMS)
7.3.2. Primary-progressive MS (PPMS)
7.3.3. Secondary-progressive MS (SPMS)
7.3.4. Progressive-relapsing MS (PRMS)
7.4. Market Attractiveness, by Disease Type
8. Global Multiple Sclerosis Drugs Market Analysis and Forecast, by Route of Administration
8.1. Introduction & Definition
8.2. Key Findings / Developments
8.3. Market Value Forecast, by Route of Administration, 2017-2027
8.3.1. Parenteral
8.3.2. Oral
8.4. Market Attractiveness by Route of Administration
9. Global Multiple Sclerosis Drugs Market Analysis and Forecast, by Distribution Channel
9.1. Introduction & Definition
9.2. Key Findings / Developments
9.3. Market Value Forecast, by Distribution Channel, 2017-2027
9.3.1. Hospital Pharmacies
9.3.2. Retail Pharmacies & Drug Stores
9.3.3. Online Pharmacies
9.4. Market Attractiveness, by Distribution Channel
10. Global Multiple Sclerosis Drugs Market Analysis and Forecast, by Region
10.1. Key Findings
10.2. Market Value Forecast, by Region
10.2.1. North America
10.2.2. Europe
10.2.3. Asia Pacific
10.2.4. Latin America
10.2.5. Middle East & Africa
10.3. Market Attractiveness, by Country/Region
11. North America Multiple Sclerosis Drugs Market Analysis and Forecast
11.1. Introduction
11.1.1. Key Findings
11.2. Market Value Forecast, by Drug Class, 2017-2027
11.2.1. Interferon Beta
11.2.2. Sphingosine 1 Phosphate Receptor Modulators
11.2.3. Mixed Polymers
11.2.4. NF-κB Inhibitor
11.2.5. Pyrimidine Synthesis Inhibitor
11.2.6. Monoclonal Antibodies
11.2.7. Corticosteroids
11.2.8. Adrenocorticotropic Hormone
11.2.9. Others
11.3. Market Value Forecast, by Disease Type, 2017-2027
11.3.1. Relapsing-remitting MS (RRMS)
11.3.2. Primary-progressive MS (PPMS)
11.3.3. Secondary-progressive MS (SPMS)
11.3.4. Progressive-relapsing MS (PRMS)
11.4. Market Value Forecast, by Route of Administration, 2017-2027
11.4.1. Parenteral
11.4.2. Oral
11.5. Market Value Forecast, by Distribution Channel, 2017-2027
11.5.1. Hospital Pharmacies
11.5.2. Retail Pharmacies & Drug Stores
11.5.3. Online Pharmacies
11.6. Market Value Forecast, by Country, 2017-2027
11.6.1. U.S.
11.6.2. Canada
11.7. Market Attractiveness Analysis
11.7.1. By Drug Class
11.7.2. By Disease Type
11.7.3. By Route of Administration
11.7.4. By Distribution Channel
11.7.5. By Country
12. Europe Multiple Sclerosis Drugs Market Analysis and Forecast
12.1. Introduction
12.1.1. Key Findings
12.2. Market Value Forecast, by Drug Class, 2017-2027
12.2.1. Interferon Beta
12.2.2. Sphingosine 1 Phosphate Receptor Modulators
12.2.3. Mixed Polymers
12.2.4. NF-κB Inhibitor
12.2.5. Pyrimidine Synthesis Inhibitor
12.2.6. Monoclonal Antibodies
12.2.7. Corticosteroids
12.2.8. Adrenocorticotropic Hormone
12.2.9. Others
12.3. Market Value Forecast, by Disease Type, 2017-2027
12.3.1. Relapsing-remitting MS (RRMS)
12.3.2. Primary-progressive MS (PPMS)
12.3.3. Secondary-progressive MS (SPMS)
12.3.4. Progressive-relapsing MS (PRMS)
12.4. Market Value Forecast, by Route of Administration, 2017-2027
12.4.1. Parenteral
12.4.2. Oral
12.5. Market Value Forecast, by Distribution Channel, 2017-2027
12.5.1. Hospital Pharmacies
12.5.2. Retail Pharmacies & Drug Stores
12.5.3. Online Pharmacies
12.6. Market Value Forecast, by Country/Sub-region, 2017-2027
12.6.1. Germany
12.6.2. U.K.
12.6.3. France
12.6.4. Italy
12.6.5. Spain
12.6.6. Rest of Europe
12.7. Market Attractiveness Analysis
12.7.1. By Drug Class
12.7.2. By Disease Type
12.7.3. By Route of Administration
12.7.4. By Distribution Channel
12.7.5. By Country/Sub-region
13. Asia Pacific Multiple Sclerosis Drugs Market Analysis and Forecast
13.1. Introduction
13.1.1. Key Findings
13.2. Market Value Forecast, by Drug Class, 2017-2027
13.2.1. Interferon Beta
13.2.2. Sphingosine 1 Phosphate Receptor Modulators
13.2.3. Mixed Polymers
13.2.4. NF-κB Inhibitor
13.2.5. Pyrimidine Synthesis Inhibitor
13.2.6. Monoclonal Antibodies
13.2.7. Corticosteroids
13.2.8. Adrenocorticotropic Hormone
13.2.9. Others
13.3. Market Value Forecast, by Disease Type, 2017-2027
13.3.1. Relapsing-remitting MS (RRMS)
13.3.2. Primary-progressive MS (PPMS)
13.3.3. Secondary-progressive MS (SPMS)
13.3.4. Progressive-relapsing MS (PRMS)
13.4. Market Value Forecast, by Route of Administration, 2017-2027
13.4.1. Parenteral
13.4.2. Oral
13.5. Market Value Forecast, by Distribution Channel, 2017-2027
13.5.1. Hospital Pharmacies
13.5.2. Retail Pharmacies & Drug Stores
13.5.3. Online Pharmacies
13.6. Market Value Forecast, by Country/Sub-region, 2017-2027
13.6.1. China
13.6.2. India
13.6.3. Japan
13.6.4. Australia & New Zealand
13.6.5. Rest of Asia Pacific
13.7. Market Attractiveness Analysis
13.7.1. By Drug Class
13.7.2. By Disease Type
13.7.3. By Route of Administration
13.7.4. By Distribution Channel
13.7.5. By Country/Sub-region
14. Latin America Multiple Sclerosis Drugs Market Analysis and Forecast
14.1. Introduction
14.1.1. Key Findings
14.2. Market Value Forecast, by Drug Class, 2017-2027
14.2.1. Interferon Beta
14.2.2. Sphingosine 1 Phosphate Receptor Modulators
14.2.3. Mixed Polymers
14.2.4. NF-κB Inhibitor
14.2.5. Pyrimidine Synthesis Inhibitor
14.2.6. Monoclonal Antibodies
14.2.7. Corticosteroids
14.2.8. Adrenocorticotropic Hormone
14.2.9. Others
14.3. Market Value Forecast, by Disease Type, 2017-2027
14.3.1. Relapsing-remitting MS (RRMS)
14.3.2. Primary-progressive MS (PPMS)
14.3.3. Secondary-progressive MS (SPMS)
14.3.4. Progressive-relapsing MS (PRMS)
14.4. Market Value Forecast, by Route of Administration, 2017-2027
14.4.1. Parenteral
14.4.2. Oral
14.5. Market Value Forecast, by Distribution Channel, 2017-2027
14.5.1. Hospital Pharmacies
14.5.2. Retail Pharmacies & Drug Stores
14.5.3. Online Pharmacies
14.6. Market Value Forecast, by Country/Sub-region, 2017-2027
14.6.1. Brazil
14.6.2. Mexico
14.6.3. Rest of Latin America
14.7. Market Attractiveness Analysis
14.7.1. By Drug Class
14.7.2. By Disease Type
14.7.3. By Route of Administration
14.7.4. By Distribution Channel
14.7.5. By Country/Sub-region
15. Middle East & Africa Multiple Sclerosis Drugs Market Analysis and Forecast
15.1. Introduction
15.1.1. Key Findings
15.2. Market Value Forecast, by Drug Class, 2017-2027
15.2.1. Interferon Beta
15.2.2. Sphingosine 1 Phosphate Receptor Modulators
15.2.3. Mixed Polymers
15.2.4. NF-κB Inhibitor
15.2.5. Pyrimidine Synthesis Inhibitor
15.2.6. Monoclonal Antibodies
15.2.7. Corticosteroids
15.2.8. Adrenocorticotropic Hormone
15.2.9. Others
15.3. Market Value Forecast, by Disease Type, 2017-2027
15.3.1. Relapsing-remitting MS (RRMS)
15.3.2. Primary-progressive MS (PPMS)
15.3.3. Secondary-progressive MS (SPMS)
15.3.4. Progressive-relapsing MS (PRMS)
15.4. Market Value Forecast, by Route of Administration, 2017-2027
15.4.1. Parenteral
15.4.2. Oral
15.5. Market Value Forecast, by Distribution Channel, 2017-2027
15.5.1. Hospital Pharmacies
15.5.2. Retail Pharmacies & Drug Stores
15.5.3. Online Pharmacies
15.6. Market Value Forecast, by Country/Sub-region, 2017-2027
15.6.1. GCC Countries
15.6.2. South Africa
15.6.3. Rest of Middle East & Africa
15.7. Market Attractiveness Analysis
15.7.1. By Drug Class
15.7.2. By Disease Type
15.7.3. By Route of Administration
15.7.4. By Distribution Channel
15.7.5. By Country/Sub-region
16. Competition Landscape
16.1. Market Share Analysis, by Company, 2018
16.2. Company Profiles
16.2.1. Bayer AG
16.2.1.1. Company Overview (HQ, Business Segments, Employee Strength)
16.2.1.2. Financial Overview
16.2.1.3. Product Portfolio
16.2.1.4. SWOT Analysis
16.2.1.5. Strategic
16.2.2. Teva Pharmaceutical Industries Ltd.
16.2.2.1. Company Overview (HQ, Business Segments, Employee Strength)
16.2.2.2. Financial Overview
16.2.2.3. Product Portfolio
16.2.2.4. SWOT Analysis
16.2.2.5. Strategic
16.2.3. Novartis AG
16.2.3.1. Company Overview (HQ, Business Segments, Employee Strength)
16.2.3.2. Financial Overview
16.2.3.3. Product Portfolio
16.2.3.4. SWOT Analysis
16.2.3.5. Strategic
16.2.4. Sanofi
16.2.4.1. Company Overview (HQ, Business Segments, Employee Strength)
16.2.4.2. Financial Overview
16.2.4.3. Product Portfolio
16.2.4.4. SWOT Analysis
16.2.4.5. Strategic
16.2.5. F. Hoffmann-La Roche Ltd.
16.2.5.1. Company Overview (HQ, Business Segments, Employee Strength)
16.2.5.2. Financial Overview
16.2.5.3. Product Portfolio
16.2.5.4. SWOT Analysis
16.2.5.5. Strategic
16.2.6. Celgene Corporation
16.2.6.1. Company Overview (HQ, Business Segments, Employee Strength)
16.2.6.2. Financial Overview
16.2.6.3. Product Portfolio
16.2.6.4. SWOT Analysis
16.2.6.5. Strategic
16.2.7. Acorda Therapeutics, Inc.
16.2.7.1. Company Overview (HQ, Business Segments, Employee Strength)
16.2.7.2. Financial Overview
16.2.7.3. Product Portfolio
16.2.7.4. SWOT Analysis
16.2.7.5. Strategic
16.2.8. Biogen, Inc.
16.2.8.1. Company Overview (HQ, Business Segments, Employee Strength)
16.2.8.2. Financial Overview
16.2.8.3. Product Portfolio
16.2.8.4. SWOT Analysis
16.2.8.5. Strategic
16.2.9. Actelion Pharmaceuticals (Johnson & Johnson)
16.2.9.1. Company Overview (HQ, Business Segments, Employee Strength)
16.2.9.2. Financial Overview
16.2.9.3. Product Portfolio
16.2.9.4. SWOT Analysis
16.2.9.5. Strategic
16.2.10. EMD Serono (Merck KGaA)
16.2.10.1. Company Overview (HQ, Business Segments, Employee Strength)
16.2.10.2. Financial Overview
16.2.10.3. Product Portfolio
16.2.10.4. SWOT Analysis
16.2.10.5. Strategic
16.2.11. AbbVie, Inc.
16.2.11.1. Company Overview (HQ, Business Segments, Employee Strength)
16.2.11.2. Financial Overview
16.2.11.3. Product Portfolio
16.2.11.4. SWOT Analysis
16.2.11.5. Strategic
List of Tables
Table 01: Global Multiple Sclerosis Drugs Market Value (US$ Mn) Forecast, by Drug Class, 2017-2027
Table 02: Global Multiple Sclerosis Drugs Market Value (US$ Mn) Forecast, by Disease Type, 2017-2027
Table 03: Global Multiple Sclerosis Drugs Market Value (US$ Mn) Forecast, by Route of Administration, 2017-2027
Table 04: Global Multiple Sclerosis Drugs Market Value (US$ Mn) Forecast, by Distribution Channel, 2017-2027
Table 05: Global Multiple Sclerosis Drugs Market Value (US$ Mn) Forecast, by Region, 2017-2027
Table 06: North America Multiple Sclerosis Drugs Market Value (US$ Mn) Forecast, by Country, 2017-2027
Table 07: North America Multiple Sclerosis Drugs Market Value (US$ Mn) Forecast, by Drug Class, 2017-2027
Table 08: North America Multiple Sclerosis Drugs Market Value (US$ Mn) Forecast, by Disease Type, 2017-2027
Table 09: North America Multiple Sclerosis Drugs Market Value (US$ Mn) Forecast, by Route of Administration, 2017-2027
Table 10: North America Multiple Sclerosis Drugs Market Value (US$ Mn) Forecast, by Distribution Channel, 2017-2027
Table 11: Europe Multiple Sclerosis Drugs Market Value (US$ Mn) Forecast, by Country/Sub-region, 2017-2027
Table 12: Europe Multiple Sclerosis Drugs Market Value (US$ Mn) Forecast, by Drug Class, 2017-2027
Table 13: Europe Multiple Sclerosis Drugs Market Value (US$ Mn) Forecast, by Disease Type, 2017-2027
Table 14: Europe Multiple Sclerosis Drugs Market Value (US$ Mn) Forecast, by Route of Administration, 2017-2027
Table 15: Europe Multiple Sclerosis Drugs Market Value (US$ Mn) Forecast, by Distribution Channel, 2017-2027
Table 16: Asia Pacific Multiple Sclerosis Drugs Market Value (US$ Mn) Forecast, by Country/Sub-region, 2017-2027
Table 17: Asia Pacific Multiple Sclerosis Drugs Market Value (US$ Mn) Forecast, by Drug Class, 2017-2027
Table 18: Asia Pacific Multiple Sclerosis Drugs Market Value (US$ Mn) Forecast, by Disease Type, 2017-2027
Table 19: Asia Pacific Multiple Sclerosis Drugs Market Value (US$ Mn) Forecast, by Route of Administration, 2017-2027
Table 20: Asia Pacific Multiple Sclerosis Drugs Market Value (US$ Mn) Forecast, by Distribution Channel, 2017-2027
Table 21: Latin America Multiple Sclerosis Drugs Market Value (US$ Mn) Forecast, by Country/Sub-region, 2017-2027
Table 22: Latin America Multiple Sclerosis Drugs Market Value (US$ Mn) Forecast, by Drug Class, 2017-2027
Table 23: Latin America Multiple Sclerosis Drugs Market Value (US$ Mn) Forecast, by Disease Type, 2017-2027
Table 24: Latin America Multiple Sclerosis Drugs Market Value (US$ Mn) Forecast, by Route of Administration, 2017-2027
Table 25: Latin America Multiple Sclerosis Drugs Market Value (US$ Mn) Forecast, by Distribution Channel, 2017-2027
Table 26: Middle East & Africa Multiple Sclerosis Drugs Market Value (US$ Mn) Forecast, by Country/Sub-region, 2017-2027
Table 27: Middle East & Africa Multiple Sclerosis Drugs Market Value (US$ Mn) Forecast, by Drug Class, 2017-2027
Table 28: Middle East & Africa Multiple Sclerosis Drugs Market Value (US$ Mn) Forecast, by Disease Type, 2017-2027
Table 29: Middle East & Africa Multiple Sclerosis Drugs Market Value (US$ Mn) Forecast, by Route of Administration, 2017-2027
Table 30: Middle East & Africa Multiple Sclerosis Drugs Market Value (US$ Mn) Forecast, by Distribution Channel, 2017-2027
List of Figures
Figure 01: Global Multiple Sclerosis Drugs Market Snapshot
Figure 02: Global Multiple Sclerosis Drugs Market Value (US$ Mn) Forecast, 2017-2027
Figure 03: Global Multiple Sclerosis Drugs Market Value Share, by Drug Class, 2018
Figure 04: Global Multiple Sclerosis Drugs Market Value Share, by Disease Type, 2018
Figure 05: Global Multiple Sclerosis Drugs Market Value Share, by Route of Administration, 2018
Figure 06: Global Multiple Sclerosis Drugs Market Value Share, by Distribution Channel, 2018
Figure 07: Global Multiple Sclerosis Drugs Market Value Share, by Region, 2018
Figure 08: Regulatory Approval Process - U.S.
Figure 09: Regulatory Approval Process - Europe
Figure 10: Regulatory Approval Process - Japan
Figure 11: Regulatory Approval Process - China
Figure 12: Global Multiple Sclerosis Drugs Market Value Share Analysis, by Drug Class, 2018 and 2027
Figure 13: Global Multiple Sclerosis Drugs Market Attractiveness Analysis, by Drug Class, 2019-2027
Figure 14: Global Multiple Sclerosis Drugs Market Value (US$ Mn) Forecast and Y-o-Y Growth (%), by Interferon Beta, 2017-2027
Figure 15: Global Multiple Sclerosis Drugs Market Value (US$ Mn) Forecast and Y-o-Y Growth (%), by Sphingosine 1 Phosphate Receptor Modulators, 2017-2027
Figure 16: Global Multiple Sclerosis Drugs Market Value (US$ Mn) Forecast and Y-o-Y Growth (%), by Mixed Polymers, 2017-2027
Figure 17: Global Multiple Sclerosis Drugs Market Value (US$ Mn) Forecast and Y-o-Y Growth (%), by NF-κB Inhibitors, 2017-2027
Figure 18: Global Multiple Sclerosis Drugs Market Value (US$ Mn) Forecast and Y-o-Y Growth (%), by Pyrimidine Synthesis Inhibitors, 2017-2027
Figure 19: Global Multiple Sclerosis Drugs Market Value (US$ Mn) Forecast and Y-o-Y Growth (%), by Monoclonal Antibodies, 2017-2027
Figure 20: Global Multiple Sclerosis Drugs Market Value (US$ Mn) Forecast and Y-o-Y Growth (%), by Corticosteroids, 2017-2027
Figure 21: Global Multiple Sclerosis Drugs Market Value (US$ Mn) Forecast and Y-o-Y Growth (%), by Adrenocorticotropic Hormone, 2017-2027
Figure 22: Global Multiple Sclerosis Drugs Market Value (US$ Mn) Forecast and Y-o-Y Growth (%), by Others, 2017-2027
Figure 23: Global Multiple Sclerosis Drugs Market Value Share Analysis, by Disease Type, 2018 and 2027
Figure 24: Global Multiple Sclerosis Drugs Market Attractiveness Analysis, by Disease Type, 2019-2027
Figure 25: Global Multiple Sclerosis Drugs Market Value (US$ Mn) Forecast and Y-o-Y Growth (%), by Relapsing-remitting MS (RRMS), 2017-2027
Figure 26: Global Multiple Sclerosis Drugs Market Value (US$ Mn) Forecast and Y-o-Y Growth (%), by Primary-progressive MS (PPMS), 2017-2027
Figure 27: Global Multiple Sclerosis Drugs Market Value (US$ Mn) Forecast and Y-o-Y Growth (%), by Secondary-progressive MS (SPMS), 2017-2027
Figure 28: Global Multiple Sclerosis Drugs Market Value (US$ Mn) Forecast and Y-o-Y Growth (%), by Progressive-relapsing MS (PRMS), 2017-2027
Figure 29: Global Multiple Sclerosis Drugs Market Value Share Analysis, by Route of Administration, 2018 and 2027
Figure 30: Global Multiple Sclerosis Drugs Market Attractiveness Analysis, by Route of Administration, 2019-2027
Figure 31: Global Multiple Sclerosis Drugs Market Value (US$ Mn) Forecast and Y-o-Y Growth (%), by Parenteral, 2017-2027
Figure 32: Global Multiple Sclerosis Drugs Market Value (US$ Mn) Forecast and Y-o-Y Growth (%), by Oral, 2017-2027
Figure 33: Global Multiple Sclerosis Drugs Market Value Share Analysis, by Distribution Channel, 2018 and 2027
Figure 34: Global Multiple Sclerosis Drugs Market Attractiveness Analysis, by Distribution Channel, 2019-2027
Figure 35: Global Multiple Sclerosis Drugs Market Revenue (US$ Mn) Forecast and Y-o-Y Growth (%), by Hospital Pharmacies, 2017-2027
Figure 36: Global Multiple Sclerosis Drugs Market Revenue (US$ Mn) Forecast and Y-o-Y Growth (%), by Retail Pharmacies & Drug Stores, 2017-2027
Figure 37: Global Multiple Sclerosis Drugs Market Value (US$ Mn) Forecast and Y-o-Y Growth (%), by Online Pharmacies, 2017-2027
Figure 38: Global Multiple Sclerosis Drugs Market Value Share, by Region, 2018 and 2027
Figure 39: Global Multiple Sclerosis Drugs Market Attractiveness, by Region, 2019-2027
Figure 40: North America Multiple Sclerosis Drugs Market Value (US$ Mn) Forecast and Y-o-Y Growth (%) Projection, 2017-2027
Figure 41: North America Multiple Sclerosis Drugs Market Value Share (%) Analysis, by Country, 2018 & 2027
Figure 42: North America Multiple Sclerosis Drugs Market Attractiveness Analysis, by Country, 2019-2027
Figure 43: North America Multiple Sclerosis Drugs Market Value Share (%) Analysis, by Drug Class, 2018 & 2027
Figure 44: North America Multiple Sclerosis Drugs Market Attractiveness, by Drug Class, 2019-2027
Figure 45: North America Multiple Sclerosis Drugs Market Value Share (%) Analysis, by Disease Type, 2018 & 2027
Figure 46: North America Multiple Sclerosis Drugs Market Attractiveness, by Disease Type, 2019-2027
Figure 47: North America Multiple Sclerosis Drugs Market Value Share (%) Analysis, by Route of Administration, 2018 & 2027
Figure 48: North America Multiple Sclerosis Drugs Market Value Share (%) Analysis, by Distribution Channel, 2018 & 2027
Figure 49: North America Multiple Sclerosis Drugs Market Attractiveness, by Route of Administration, 2019-2027
Figure 50: North America Multiple Sclerosis Drugs Market Attractiveness, by Distribution Channel, 2019-2027
Figure 51: Europe Multiple Sclerosis Drugs Market Value (US$ Mn) and Y-o-Y Growth (%) Forecast, 2017-2027
Figure 52: Europe Multiple Sclerosis Drugs Market Value Share Analysis, by Country/Sub-region, 2018 and 2027
Figure 53: Europe Multiple Sclerosis Drugs Market Attractiveness Analysis, by Country/Sub-region, 2019-2027
Figure 54: Europe Multiple Sclerosis Drugs Market Value Share Analysis, by Drug Class, 2018 and 2027
Figure 55: Europe Multiple Sclerosis Drugs Market Attractiveness Analysis, by Drug Class, 2019-2027
Figure 56: Europe Multiple Sclerosis Drugs Market Value Share (%) Analysis, by Disease Type, 2018 & 2027
Figure 57: Europe Multiple Sclerosis Drugs Market Attractiveness, by Disease Type, 2019-2027
Figure 58: Europe Multiple Sclerosis Drugs Market Value Share Analysis, by Route of Administration, 2018 and 2027
Figure 59: Europe Multiple Sclerosis Drugs Market Value Share Analysis, by Distribution Channel, 2018 and 2027
Figure 60: Europe Multiple Sclerosis Drugs Market Attractiveness Analysis, by Route of Administration, 2019-2027
Figure 61: Europe Multiple Sclerosis Drugs Market Attractiveness Analysis, by Distribution Channel, 2019-2027
Figure 62: Asia Pacific Multiple Sclerosis Drugs Market Value (US$ Mn) and Y-o-Y Growth (%) Forecast, 2017-2027
Figure 63: Asia Pacific Multiple Sclerosis Drugs Market Value Share Analysis, by Country/Sub-region, 2018 and 2027
Figure 64: Asia Pacific Multiple Sclerosis Drugs Market Attractiveness Analysis, by Country/Sub-region, 2019-2027
Figure 65: Asia Pacific Multiple Sclerosis Drugs Market Value Share Analysis, by Drug Class, 2018 and 2027
Figure 66: Asia Pacific Multiple Sclerosis Drugs Market Attractiveness Analysis, by Drug Class, 2019-2027
Figure 67: Asia Pacific Multiple Sclerosis Drugs Market Value Share (%) Analysis, by Disease Type, 2018 & 2027
Figure 68: Asia Pacific Multiple Sclerosis Drugs Market Attractiveness, by Disease Type, 2019-2027
Figure 69: Asia Pacific Multiple Sclerosis Drugs Market Value Share Analysis, by Route of Administration, 2018 and 2027
Figure 70: Asia Pacific Multiple Sclerosis Drugs Market Attractiveness Analysis, by Route of Administration, 2019-2027
Figure 71: Asia Pacific Multiple Sclerosis Drugs Market Value Share Analysis, by Distribution Channel, 2018 and 2027
Figure 72: Asia Pacific Multiple Sclerosis Drugs Market Attractiveness Analysis, by Distribution Channel, 2019-2027
Figure 73: Latin America Multiple Sclerosis Drugs Market Value (US$ Mn) and Y-o-Y Growth (%) Forecast, 2017-2027
Figure 74: Latin America Multiple Sclerosis Drugs Market Value Share Analysis, by Country/Sub-region, 2018 and 2027
Figure 75: Latin America Multiple Sclerosis Drugs Market Attractiveness Analysis, by Country/Sub-region, 2019-2027
Figure 76: Latin America Multiple Sclerosis Drugs Market Value Share Analysis, by Drug Class, 2018 and 2027
Figure 77: Latin America Multiple Sclerosis Drugs Market Attractiveness Analysis, by Drug Class, 2019-2027
Figure 78: Latin America Multiple Sclerosis Drugs Market Value Share (%) Analysis, by Disease Type, 2018 and 2027
Figure 79: Latin America Multiple Sclerosis Drugs Market Attractiveness, by Disease Type, 2019-2027
Figure 80: Latin America Multiple Sclerosis Drugs Market Value Share Analysis, by Route of Administration, 2018 and 2027
Figure 81: Latin America Multiple Sclerosis Drugs Market Attractiveness Analysis, by Route of Administration, 2019-2027
Figure 82: Latin America Multiple Sclerosis Drugs Market Value Share Analysis, by Distribution Channel, 2018 and 2027
Figure 83: Latin America Multiple Sclerosis Drugs Market Attractiveness Analysis, by Distribution Channel, 2019-2027
Figure 84: Middle East & Africa Multiple Sclerosis Drugs Market Value (US$ Mn) and Y-o-Y Growth (%) Forecast, 2017-2027
Figure 85: Middle East & Africa Multiple Sclerosis Drugs Market Value Share Analysis, by Country/Sub-region, 2018 and 2027
Figure 86: Middle East & Africa Multiple Sclerosis Drugs Market Attractiveness Analysis, by Country/Sub-region, 2019-2027
Figure 87: Middle East & Africa Multiple Sclerosis Drugs Market Value Share Analysis, by Drug Class, 2018 and 2027
Figure 88: Middle East & Africa Multiple Sclerosis Drugs Market Attractiveness Analysis, by Drug Class, 2019-2027
Figure 89: Middle East & Africa Multiple Sclerosis Drugs Market Value Share (%) Analysis, by Disease Type, 2018 & 2027
Figure 90: Middle East & Africa Multiple Sclerosis Drugs Market Attractiveness, by Disease Type, 2019-2027
Figure 91: Middle East & Africa Multiple Sclerosis Drugs Market Value Share Analysis, by Route of Administration, 2018 and 2027
Figure 92: Middle East & Africa Multiple Sclerosis Drugs Market Attractiveness Analysis, by Route of Administration, 2019-2027
Figure 93: Middle East & Africa Multiple Sclerosis Drugs Market Value Share Analysis, by Distribution Channel, 2018 and 2027
Figure 94: Middle East & Africa Multiple Sclerosis Drugs Market Attractiveness Analysis, by Distribution Channel, 2019-2027
Copyright © Transparency Market Research, Inc. All Rights reserved
Trust Online

Multiple Sclerosis Drugs Market