
To know the scope of our report Get a Sample on Clinical Trial Management System Market
Get a glimpse of the in-depth analysis through our Report Brochure
Expanding operations in future? To get the perfect launch ask for a custom report
Key players in the global clinical trials management system market are engaged in technologically advanced processes, launch of new services, and acquisition & collaborative agreements with other companies. These strategies are likely to fuel the growth of the global clinical trials management system market. A few expansion strategies adopted by players operating in the global clinical trials management system market are:
The report on the global clinical trials management system market discussed individual strategies, followed by company profiles of manufacturers of clinical trials management system. The competitive landscape section has been included in the report to provide readers with a dashboard view and a company market share analysis of key players operating in the global clinical trials management system market.
Global Clinical trials management system Market – Segmentation
|
Mode of Delivery |
Cloud-based On-premise Web-based |
|
Component |
Hardware Services Software |
|
Type |
Enterprise-based Site-based |
|
End-user |
Pharmaceutical Industries Contract Research Organizations (CRO) Health Care Providers |
|
Region |
North America Europe Asia Pacific Rest of the World (RoW) |
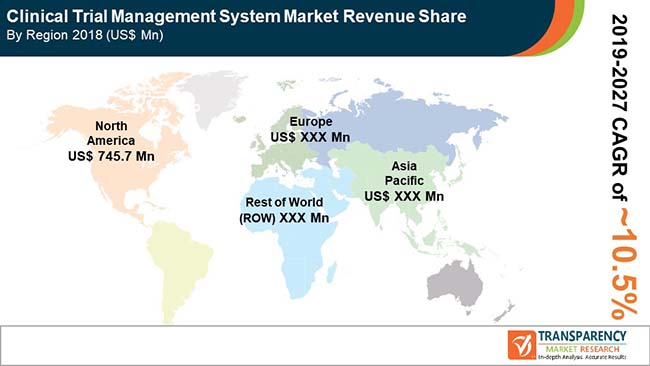
Clinical trial management system market is anticipated to grow at a CAGR of 10.5% during the forecast period
North America accounted for a major share of the global clinical trial management system market
The end-use segments in the clinical trial management system market are Pharmaceutical Industries, Contract Research Organizations, Health Care Providers
Rising demand for new therapies and increasing research and developmental activities to drive the global clinical trials management system market during the forecast period
Key players in the global clinical trial management system market include DataTRAK International Inc., Parexel International Corporation, Bio-Optronics, Inc., Dassault Systèmes SE, MedNet GmbH, and International Business Machines Corporation
1. Preface
1.1. Report Scope and Market Segmentation
1.2. Research Highlights
1.3. Assumptions and Acronyms Used
2. Research Methodology
3. Executive Summary : Global Clinical Trial Management System Market
4. Market Overview
4.1. Introduction
4.1.1. Clinical Trial Management System Definition
4.1.2. Key Industry Evolutions/ Developments
4.2. Overview: Global Clinical Trial Management System (CTSM) Market
4.3. Market Dynamics
4.3.1. Drivers
4.3.2. Restraints
4.3.3. Opportunities
4.4. Porter’s Five Force Analysis
4.5. Product Pipeline
4.6. Standards for data management in clinical trial study
5. Global Clinical Trial Management System (CTMS) Market Analysis, by Mode of Delivery
5.1. Introduction & Definition
5.2. Key Findings
5.3. Market Value Forecast By Mode of Delivery , 2017–2027
5.3.1. On-premise
5.3.2. Web-based
5.3.3. Cloud-based
5.4. Market Attractiveness By Mode of Delivery
6. Global Clinical Trial Management System (CTMS) Market Analysis, by Component
6.1. Introduction & Definition
6.2. Key Findings
6.3. Market Value Forecast By Component, 2017–2027
6.3.1. Software
6.3.2. Hardware
6.3.3. Services
6.4. Market Attractiveness By Components
7. Global Clinical Trial Management System (CTMS) Market Analysis, by Type
7.1. Introduction & Definition
7.2. Key Findings
7.3. Market Value Forecast By Type, 2017–2027
7.3.1. Enterprise-based
7.3.2. Site-based
7.4. Market Attractiveness By Type
8. Global Clinical Trial Management System (CTMS) Market Analysis, by End-user
8.1. Introduction & Definition
8.2. Key Findings
8.3. Market Value Forecast By End-user, 2017–2027
8.3.1. Pharmaceutical Industries
8.3.2. Contract Research Organizations
8.3.3. Healthcare Providers
8.3.4. Market Attractiveness By End-user
9. Global Clinical Trial Management System (CTMS) Market Analysis, by Region
9.1. Key Findings
9.2. Market Value Forecast By Region
9.2.1. North America
9.2.2. Europe
9.2.3. Asia
9.2.4. Rest of the World
9.3. Market Attractiveness by Region
10. North America Clinical Trial Management System Analysis and Forecast
10.1. Key Findings
10.2. North America Clinical Trial Management System (CTMS) Market Overview
10.3. Market Value Share By Country/Sub-regions
10.3.1. U.S.
10.3.2. Canada
10.4. Market Value Share By Mode of Delivery
10.4.1. Cloud-based
10.4.2. Web-based
10.4.3. On-premise
10.5. Market Value Share By Component
10.5.1. Software
10.5.2. Hardware
10.5.3. Services
10.6. Market Value Share By Type
10.6.1. Enterprise-based
10.6.2. Site-based
10.7. Market Value Share By End-user
10.7.1. Pharmaceutical Industries
10.7.2. Contract Research Organizations
10.7.3. Healthcare Providers
10.8. Market Attractiveness Analysis
10.8.1. By Country/Sub-region
10.8.2. By Mode of Delivery
10.8.3. By Component
10.8.4. By Type
10.8.5. By End-user
11. Europe Clinical Trial Management System Analysis and Forecast
11.1. Key Findings
11.2. Europe Clinical Trial Management System (CTMS) Market Overview
11.3. Market Value Share By Country/Sub-regions
11.3.1. U.K.
11.3.2. France
11.3.3. Germany
11.3.4. Russia
11.3.5. Poland
11.3.6. Rest of Europe
11.4. Market Value Share By Mode of Delivery
11.4.1. Cloud-based
11.4.2. Web-based
11.4.3. On-premise
11.5. Market Value Share By Component
11.5.1. Software
11.5.2. Hardware
11.5.3. Services
11.6. Market Value Share By Type
11.6.1. Enterprise-based
11.6.2. Site-based
11.7. Market Value Share By End-user
11.7.1. Pharmaceutical Industries
11.7.2. Contract Research Organizations
11.7.3. Healthcare Providers
11.8. Market Attractiveness Analysis
11.8.1. By Country/Sub-region
11.8.2. By Mode of Delivery
11.8.3. By Component
11.8.4. By Type
11.8.5. By End-user
12. Asia Clinical Trial Management System Analysis and Forecast
12.1. Key Findings
12.2. Asia Clinical Trial Management System (CTMS) Market Overview
12.3. Market Value Share By Country/Sub-regions
12.3.1. China
12.3.2. South Korea
12.3.3. Taiwan
12.3.4. India
12.3.5. Rest of Asia
12.4. Market Value Share By Mode of Delivery
12.4.1. Cloud-based
12.4.2. Web-based
12.4.3. On-premise
12.5. Market Value Share By Component
12.5.1. Software
12.5.2. Hardware
12.5.3. Services
12.6. Market Value Share By Type
12.6.1. Enterprise-based
12.6.2. Site-based
12.7. Market Value Share By End-user
12.7.1. Pharmaceutical Industries
12.7.2. Contract Research Organizations
12.7.3. Healthcare Providers
12.8. Market Attractiveness Analysis
12.8.1. By Country/Sub-region
12.8.2. By Mode of Delivery
12.8.3. By Component
12.8.4. By Type
12.8.5. By End-user
13. Rest of World (ROW) Clinical Trial Management System Market Analysis and Forecast
13.1. Key Findings
13.2. ROW Clinical Trial Management System (CTMS) Market Overview
13.3. Market Value Share By Mode of Delivery
13.3.1. Cloud-based
13.3.2. Web-based
13.3.3. On-premise
13.4. Market Value Share By Component
13.4.1. Software
13.4.2. Hardware
13.4.3. Services
13.5. Market Value Share By Type
13.5.1. Enterprise-based
13.5.2. Site-based
13.6. Market Value Share By End-user
13.6.1. Pharmaceutical Industries
13.6.2. Contract Research Organizations
13.6.3. Healthcare Providers
13.7. Market Attractiveness Analysis
13.7.1. By Mode of Delivery
13.7.2. By Component
13.7.3. By Type
13.7.4. By End-user
14. Competition Landscape
14.1. Market Player – Competition Matrix (By Tier and Size of companies)
14.2. .Market Share Analysis By Company (2018)
14.3. Company Profiles (Details – Overview, Financials, Recent Developments, Strategy)
14.3.1. Oracle
14.3.1.1. Company Overview (HQ, Business Segments, Employee Strength)
14.3.1.2. Financial Overview
14.3.1.3. Product Portfolio
14.3.1.4. SWOT Analysis
14.3.1.5. Strategic Overview
14.3.2. Dassault Système
14.3.2.1. Company Overview (HQ, Business Segments, Employee Strength)
14.3.2.2. Financial Overview
14.3.2.3. Product Portfolio
14.3.2.4. SWOT Analysis
14.3.2.5. Strategic Overview
14.3.3. PAREXEL International Corporation
14.3.3.1. Company Overview (HQ, Business Segments, Employee Strength)
14.3.3.2. Financial Overview
14.3.3.3. Product Portfolio
14.3.3.4. SWOT Analysis
14.3.3.5. Strategic Overview
14.3.4. IBM
14.3.4.1. Company Overview (HQ, Business Segments, Employee Strength)
14.3.4.2. Financial Overview
14.3.4.3. Product Portfolio
14.3.4.4. SWOT Analysis
14.3.4.5. Strategic Overview
14.3.5. Cinven
14.3.5.1. Company Overview (HQ, Business Segments, Employee Strength)
14.3.5.2. Financial Overview
14.3.5.3. Product Portfolio
14.3.5.4. SWOT Analysis
14.3.5.5. Strategic Overview
14.3.6. Mednet
14.3.6.1. Company Overview (HQ, Business Segments, Employee Strength)
14.3.6.2. Financial Overview
14.3.6.3. Product Portfolio
14.3.6.4. SWOT Analysis
14.3.6.5. Strategic Overview
14.3.7. Microsoft
14.3.7.1. Company Overview (HQ, Business Segments, Employee Strength)
14.3.7.2. Financial Overview
14.3.7.3. Product Portfolio
14.3.7.4. SWOT Analysis
14.3.7.5. Strategic Overview
14.3.8. Apple Inc.
14.3.8.1. Company Overview (HQ, Business Segments, Employee Strength)
14.3.8.2. Financial Overview
14.3.8.3. Product Portfolio
14.3.8.4. SWOT Analysis
14.3.8.5. Strategic Overview
14.3.9. Bio-Optronics, Inc.
14.3.9.1. Company Overview (HQ, Business Segments, Employee Strength)
14.3.9.2. Financial Overview
14.3.9.3. Product Portfolio
14.3.9.4. SWOT Analysis
14.3.9.5. Strategic Overview
14.3.10. Cognizant
14.3.10.1. Company Overview (HQ, Business Segments, Employee Strength)
14.3.10.2. . Financial Overview
14.3.10.3. Product Portfolio
14.3.10.4. SWOT Analysis
14.3.10.5. Strategic Overview
14.3.11. DSG, Inc.
14.3.11.1. Company Overview (HQ, Business Segments, Employee Strength)
14.3.11.2. Financial Overview
14.3.11.3. Product Portfolio
14.3.11.4. SWOT Analysis
14.3.11.5. Strategic Overview
14.3.12. Forte
14.3.12.1. Company Overview (HQ, Business Segments, Employee Strength)
14.3.12.2. Financial Overview
14.3.12.3. Product Portfolio
14.3.12.4. SWOT Analysis
14.3.12.5. Strategic Overview
14.3.13. Veeva Systems
14.3.13.1. Company Overview (HQ, Business Segments, Employee Strength)
14.3.13.2. Financial Overview
14.3.13.3. Product Portfolio
14.3.13.4. SWOT Analysis
14.3.13.5. Strategic Overview
14.3.14. DATATRAK Int
14.3.14.1. Company Overview (HQ, Business Segments, Employee Strength)
14.3.14.2. Financial Overview
14.3.14.3. Product Portfolio
14.3.14.4. SWOT Analysis
14.3.14.5. Strategic Overview
List of Tables
Table 01: Global CTMS Market Size (US$ Mn) Forecast, by Mode of Delivery, 2017–2027
Table 02: Global CTMS Market Size (US$ Mn) Forecast, by Component, 2017–2027
Table 03: Global CTMS Market Size (US$ Mn) Forecast, by Type, 2017–2027
Table 04: Global CTMS Market Size (US$ Mn) Forecast, by End-user, 2017–2027
Table 05: Global CTMS Market (US$ Mn) Forecast, by Region, 2017–2027
Table 06: North America Clinical Trial Management (CTMS) Market Size (US$ Mn) Forecast, by Country, 2017–2027
Table 07: North America Clinical Trial Management System (CTMS) Market Size (US$ Mn) Forecast, by Mode of Delivery, 2017–2027
Table 08: North America Clinical Trial Management System (CTMS) Market Size (US$ Mn) Forecast, by Component, 2017–2027
Table 09: North America Clinical Trial Management System (CTMS) Market Size (US$ Mn) Forecast, by Type, 2017–2027
Table 10: North America Clinical Trial Management System (CTMS) Market Size (US$ Mn) Forecast, by End-user, 2017–2027
Table 11: Europe Clinical Trial Management (CTMS) Market Size (US$ Mn) Forecast, by Country/Sub-region, 2017–2027
Table 12: Europe Clinical Trial Management System (CTMS) Market Size (US$ Mn) Forecast, by Mode of Delivery, 2017–2027
Table 13: Europe Clinical Trial Management System (CTMS) Market Size (US$ Mn) Forecast, by Component, 2017–2027
Table 14: Europe Clinical Trial Management System (CTMS) Market Size (US$ Mn) Forecast, by Type, 2017–2027
Table 15: Europe Clinical Trial Management System (CTMS) Market Size (US$ Mn) Forecast, by End-user, 2017–2027
Table 16: Asia Clinical Trial Management Systems (CTMS) Market Size (US$ Mn) Forecast, by Country/Sub-region, 2017–2027
Table 17: Asia Clinical Trial Management Systems (CTMS) Market Size (US$ Mn) Forecast, by Mode of Delivery, 2017–2027
Table 18: Asia Clinical Trial Management Systems (CTMS) Market Size (US$ Mn) Forecast, by Component, 2017–2027
Table 19: Asia Clinical Trial Management Systems (CTMS) Market Size (US$ Mn) Forecast, by Type, 2017–2027
Table 20: Asia Clinical Trial Management Systems (CTMS) Market Size (US$ Mn) Forecast, by End-user, 2017–2027
Table 21: Rest of the World (RoW) Clinical Trial Management System (CTMS) Market Size (US$ Mn) Forecast, by Mode of Delivery, 2017–2027
Table 22: Rest of the World (RoW) Clinical Trial Management System (CTMS) Market Size (US$ Mn) Forecast, by Component, 2017–2027
Table 23: Rest of the World (RoW) Clinical Trial Management System (CTMS) Market Size (US$ Mn) Forecast, by Type, 2017–2027
Table 24: Rest of the World (RoW) Clinical Trial Management System (CTMS) Market Size (US$ Mn) Forecast, by End-user, 2017–2027
Table 25: Market Footprint Analysis, by Region
List of Figure
Figure 1: Global Clinical Trial Management System Market Size ($ Million) and Distribution by Geography, 2018 and 2027
Figure 2: Global Clinical Trial Management System Market, by Component and Mode of Delivery
Figure 3: Global Clinical Trial Management System Market, by type and end-user
Figure 4: Market Share by Region, 2018
Figure 5: Global Clinical Trial Management System, Market Opportunity Map, by Mode of Delivery and Component
Figure 6: Global Clinical Trial Management System, Market Opportunity Map, by Type and End-user
Figure 7: Global Clinical Trial Management System (CTSM) Market Size (US$ Mn) Forecast and Y-o-Y Growth (%) Projection, 2017–2027
Figure 8: Global CTMS Market Value Share, by Mode of Delivery, 2018 and 2027
Figure 9: Global CTMS Market Attractiveness, by Mode of Delivery, 2019–2027
Figure 10: Cloud-based Clinical Trial Management System Market Size (US$ Mn) Forecast and Y-o-Y Growth (%) Projection, 2017–2027
Figure 11: Web-based Clinical Trial Management System Market Size (US$ Mn) Forecast and Y-o-Y Growth (%) Projection, 2017–2027
Figure 12: On-premise Clinical Trial Management System Market Size (US$ Mn) Forecast and Y-o-Y Growth (%) Projection, 2017–2027
Figure 13: Global CTMS Market Value Share, by Component, 2018 and 2027
Figure 14: Global CTMS Market Attractiveness, by Component, 2019–2027
Figure 15: Software Clinical Trial Management System Market Size (US$ Mn) Forecast and Y-o-Y Growth (%) Projection, 2017–2027
Figure 16: Hardware Clinical Trial Management System Market Size (US$ Mn) Forecast and Y-o-Y Growth (%) Projection, 2017–2027
Figure 17: Services Clinical Trial Management System Market Size (US$ Mn) Forecast and Y-o-Y Growth (%) Projection, 2017–2027
Figure 18: Global CTMS Market Value Share, by Type, 2018 and 2027
Figure 19: Global CTMS Market Attractiveness, by Type, 2019–2027
Figure 20: Enterprise based Clinical Trial Management System
Figure 21: Site based Clinical Trial Management System
Figure 22: Global CTMS Market Value Share, by End-user, 2018 and 2027
Figure 23: Global CTMS Market Attractiveness, by End-user, 2019–2027
Figure 24: Pharmaceutical Industries Clinical Trial Management System Market Size (US$ Mn) Forecast and Y-o-Y Growth (%) Projection, 2017–2027
Figure 25: Contract Research Organizations Clinical Trial Management System Market Size (US$ Mn) Forecast and Y-o-Y Growth (%) Projection, 2017–2027
Figure 26: Health Care Providers Clinical Trial Management System Market Size (US$ Mn) Forecast and Y-o-Y Growth (%) Projection, 2017–2027
Figure 27: Global CTMS Market Value Share, by Region, 2018 and 2027
Figure 28: Global CTMS Market Attractiveness, by Region, 2019–2027
Figure 29: North America Clinical Trial Management System (CTMS) Market Size (US$ Mn) Forecast and Y-o-Y Growth (%) Projection, 2017–2027
Figure 30: North America Clinical Trial Management System (CTMS) Market Value Share, by Country, 2018 and 2027
Figure 31: North America Clinical Trial Management System (CTMS) Market Attractiveness, by Mode of Delivery, 2019–2027
Figure 32: North America Clinical Trial Management System (CTMS) Market Value Share, by Component, 2018 and 2027
Figure 33: North America Clinical Trial Management System (CTMS) Attractiveness, by Component, 2019–2027
Figure 34: North America Clinical Trial Management System (CTMS) Market Value Share, by Type, 2018 and 2027
Figure 35: North America Clinical Trial Management System (CTMS) Attractiveness, by Type, 2019–2027
Figure 36: North America Clinical Trial Management System (CTMS) Value Share, by End-user, 2018 and 2027
Figure 37: North America Clinical Trial Management System (CTMS) Attractiveness, by End-user, 2019–2027
Figure 38: Europe Clinical Trial Management System (CTMS) Market Size (US$ Mn) Forecast and Y-o-Y Growth (%) Projection, 2019–2027
Figure 39: : Europe Clinical Trial Management System (CTMS) Market Value Share, by Country/Sub-region, 2018 and 2027
Figure 40: Europe Clinical Trial Management System (CTMS) Market Attractiveness, by Country/Sub-region, 2019–2027
Figure 41: Europe Clinical Trial Management System (CTMS) Market Value Share, by Mode of Delivery, 2018 and 2027
Figure 42: Europe Clinical Trial Management System (CTMS) Market Attractiveness, by Mode of Delivery, 2019–2027
Figure 43: Europe Clinical Trial Management System (CTMS) Market Value Share, by Component, 2018 and 2027
Figure 44: Europe Clinical Trial Management System (CTMS) Attractiveness, by Component, 2019–2027
Figure 45: Europe Clinical Trial Management System (CTMS) Market Value Share, by Type, 2018 and 2027
Figure 46: Europe Clinical Trial Management System (CTMS) Attractiveness, by Type, 2019–2027
Figure 47: Europe Clinical Trial Management System (CTMS) Value Share, by End-user, 2018 and 2027
Figure 48: Europe Clinical Trial Management System (CTMS) Attractiveness, by End-user, 2019–2027
Figure 49: Asia Clinical Trial Management Systems (CTMS) Market Size (US$ Mn) Forecast and Y-o-Y Growth (%) Projection, 2019–2027
Figure 50: : Asia Clinical Trial Management Systems (CTMS) Market Value Share, by Country/Sub-region, 2018 and 2027
Figure 51: Asia Clinical Trial Management Systems (CTMS) Market Attractiveness, by Country/Sub-region, 2019–2027
Figure 52: Asia Clinical Trial Management Systems (CTMS) Market Value Share, by Mode of Delivery, 2018 and 2027
Figure 53: Asia Clinical Trial Management Systems (CTMS) Market Attractiveness, by Mode of Delivery, 2019–2027
Figure 54: Asia Clinical Trial Management Systems (CTMS) Market Value Share, by Component, 2018 and 2027
Figure 55: Asia Clinical Trial Management Systems (CTMS) Market Attractiveness, by Component, 2019–2027
Figure 56: Asia Clinical Trial Management Systems (CTMS) Market Value Share, by Type, 2018 and 2027
Figure 57: Asia Clinical Trial Management Systems (CTMS) Market Attractiveness, by Type, 2019–2027
Figure 58: Asia Clinical Trial Management Systems (CTMS) Market Value Share, by End-user, 2018 and 2027
Figure 59: Asia Clinical Trial Management Systems (CTMS) Market Attractiveness, by End-user, 2019–2027
Figure 60: Rest of the World (RoW) Clinical Trial Management System (CTMS) Market Size (US$ Mn) Forecast and Y-o-Y Growth (%) Projection, 2017–2027
Figure 61: Rest of the World (RoW) Clinical Trial Management System (CTMS) Market Value Share, by Mode of Delivery, 2018 and 2027
Figure 62: Rest of the World (RoW) Clinical Trial Management System (CTMS) Market Attractiveness, by Mode of Delivery, 2019–2027
Figure 63: Rest of the World (RoW)Clinical Trial Management System (CTMS) Market Value Share, by Component, 2018 and 2027
Figure 64: Rest of the World (RoW)Clinical Trial Management System (CTMS) Attractiveness, by Component, 2019–2027
Figure 65: Rest of the World (RoW) Clinical Trial Management System (CTMS) Market Value Share, by Type, 2018 and 2027
Figure 66: Rest of the World (RoW) Clinical Trial Management System (CTMS) Attractiveness, by Type, 2019–2027
Figure 67: Rest of the World (RoW)Clinical Trial Management System (CTMS) Value Share, by End-user, 2018 and 2027
Figure 68: Rest of the World (RoW)Clinical Trial Management System (CTMS) Attractiveness, by End-user, 2019–2027
Figure 69: Global Clinical Trial Management System Market Share Analysis, by Key Players (2018)
Figure 70: Oracle’s Revenue (US$ Mn) & Y-o-Y Growth (%), 2015–2018
Figure 71: Breakdown of Oracle’s Revenue, by Region, 2018
Figure 72: Breakdown of Oracle’s Revenue, by Business Segment, 2018
Figure 73: Oracle’s Research & Development Expenditure (US$ Mn) and Intensity (%), 2018 and 2017
Figure 74: Dassault Système Revenue (US$ Mn) & Y-o-Y Growth (%), 2015–2018
Figure 75: Dassault Système Revenue(US$ Mn), by Subscription Business Segment, 2018
Figure 76: Dassault Système, Inc Revenue (US$ Mn), by Professional Services Business Segment, 2018
Figure 77: Dassault Système, Inc R&D Expenditure (US$ Mn), 2017–2018
Figure 78: PAREXEL International Corporation Revenue (US$ Mn) & Y-o-Y Growth (%), 2016–2018
Figure 79: PAREXEL International Corporation Revenue (US$ Mn), by Business Segment, 2018
Figure 80: PAREXEL International Corporation Revenue (US$ Mn), by Geography, 2018
Figure 81: PAREXEL International Corporation Selling, General and Administrative Expenditure (US$ Mn), 2017–2018
Figure 82: IBM Revenue (US$ Mn) & Y-o-Y Growth (%), 2015–2018
Figure 83: IBM Revenue (US$ Mn), by Subscription Business Segment, 2018
Figure 84: IBM S,G&A Expenditure (US$ Mn), 2018
Figure 85: IBM R&D Expenditure (US$ Mn), 2017–2018
Figure 86: Microsoft Revenue (US$ Bn) and Y-o-Y Growth (%), 2016–2018
Figure 87: Microsoft Gross Margin (Bn) and Y-o-Y Growth (%), 2016-2018
Figure 88: Microsoft Operating Income (US$ Bn) and Y-o-Y Growth (%), 2016–2018
Figure 89: Microsoft Assets (US$ Bn) and Y-o-Y Growth (%), 2016–2018
Figure 90: Apple Inc Revenue (US$ Bn) and Y-o-Y Growth (%), 2016–2018
Figure 91: Apple Inc Gross Margin (Bn) and Y-o-Y Growth (%), 2016-2018
Figure 92: Apple Inc Net Income (US$ Bn) and Y-o-Y Growth (%), 2016–2018
Figure 93: R&D Expense (US$ Bn) and Y-o-Y Growth (%), 2016–2018
Figure 94: Wipro Limited Revenue (US$ Bn) and Y-o-Y Growth (%), 2016–2018
Figure 95: Wipro Limited Gross Income (Bn) and Y-o-Y Growth (%), 2016-2018
Figure 96: Wipro Limited R&D Expenses (US$ Bn) and Y-o-Y Growth (%), 2017–2018
Figure 97: Cognizant Revenue (US$ Mn) and Y-o-Y Growth (%), 2016–2018
Figure 98: Cognizant Gross Income (US$ Mn) and Y-o-Y Growth (%), 2016–2018
Figure 99: Cognizant Revenue, by Business Segment, 2018
Figure 100: Cognizant Revenue, by Geography, 2018
Figure 101: Veeva Systems Revenue (US$ Mn) and Y-o-Y Growth (%), 2016–2018
Figure 102: Veeva Systems Gross Income (US$ Mn) and Y-o-Y Growth (%), 2016–2018
Figure 103: Veeva Systems SG&A Expenses (US$ Mn) and Y-o-Y Growth (%), 2017–2018
Figure 104: Veeva Systems R&D Expenses (US$ Mn) and Y-o-Y Growth (%), 2017–2018
Figure 105: DATATRAK Int Revenue (US$ Mn) & Y-o-Y Growth (%), 2016–2018
Figure 106: DATATRAK INT Gross Income (US$ Mn) & Y-o-Y Growth (%), 2016–2018
Figure 107: DATATRAK Int SG&A Expenditure (US$ Mn), 2018
Figure 108: DATATRAK Int Research & Development Expenditure (US$ Mn), 2018 and 2017
Copyright © Transparency Market Research, Inc. All Rights reserved
Trust Online


Clinical Trial Management System Market Outlook, 2019-2027