
Reports
Reports
Analysts’ Viewpoint on Winch Market Scenario
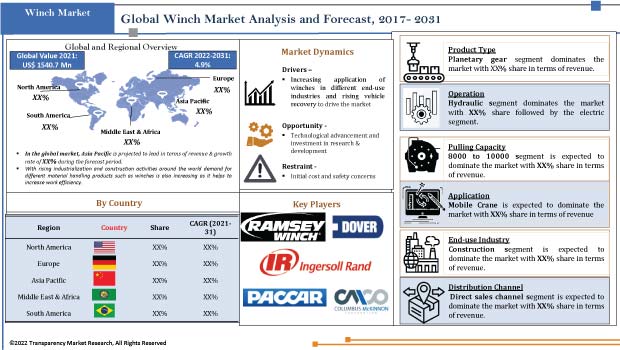
Leading companies operating in the winch market are focusing on new technologies such as automated and portable winches, which are likely to improve pulling capacities. Multiple cable options, such as synthetic rope, in products are helping reduce downtime. Such advantages are benefitting businesses and industries post the COVID-19 pandemic. Increase in adoption rate of automated products is likely to drive the market in the near future. The market is estimated to witness a decent growth rate (CAGR) of 4.9% during the forecast period, owing to the distinctive capability of winches to perform numerous operations in the application of pulling and lifting.
Winch is a mechanical device that is used to pull in or let out or adjust the tension of a rope or wire rope/cable wire. It is a device designed to pull or lift loads by means of a cable that is wound around a horizontal cylinder called a drum, or a chain that rotates around a drive nut. Winches can be manual, electric, pneumatic, and hydraulic; or have a combustion engine. Common examples of winches are portable winch, truck winch, electric boat winch, capstan winch, and hand winch.
Different classifications of winches are available in the market. These include hydraulic winch, capstan winch, and marine winches, which are used as lifting & traction equipment in industrial sectors such as metalworking & construction for lifting & moving heavy loads. Electric boat winch is commonly used in the maritime industry for lifting boats, and for fishing activities. In the automotive sector, a truck winch is used for towing vehicles on trailers.
Manufacturers are focusing on improving their product lines with automation, as demand for advanced integrated products with additional features such as digital display has been rising, due to their ease of use and convenience. This is expected to augment the demand for winches in the near future. Rise in demand for remote-controlled and GPS-integrated equipment in residential and commercial sectors is also anticipated to boost the demand for winches in the next few years.
The global winch market is likely to observe a rise in product diversity, as increasing number of international companies with R&D capabilities, factory automation, and internet platform resources, specifically for robotic winches, are planning to enter the arena of winch manufacturing.
Winches are extensively used across end-use industries such as mining, oil & gas exploration, infrastructure development, automobile recovery, industrial equipment manufacturing, and agriculture to effectively manage loads. Rise in demand for winches in the lifting process or moving loads in industries such as construction and infrastructure development is a key factor driving the winch market.
The global population is expected to reach 8 billion by 2023 according to the United Nations Census Bureau. This entails building cities with denser population, and connecting them with proper infrastructure. On the other hand, demand for construction is increasing due to vast economic growth in developing countries. Having bounced back from the worst of the pandemic fallout, the global construction market is set to grow by 2.3% per year in real terms, reaching US$ 16.6 Trn by 2030, according to a report by London-based Global Construction Perspectives.
Four of the 10 fastest-growing markets are in Asia, with only Myanmar and Japan facing declining outputs, while five are in Africa, and one is in the Middle East. GDP estimates total construction output to have risen in real terms by 4.1% to US$13.2 Trn in 2021 after dipping by 0.1% during the pandemic’s first year in 2020. Increase in private sector investments in the construction industry, technological development, and rise in disposable income are expected to boost the construction sector. Rise in infrastructure and housing spending by governments across the globe is also driving the market.
Construction is one of the fastest-growing markets for winches. Electric and hydraulic winches are the commonly used products in the construction industry, as they are capable of working with heavy loads efficiently. They are easy to install, have fast starting and shut down operations, and require less space. They also have multipurpose functionality and high capacity features.
Rise in demand for oil and gas is driving the global winch market. Oil & natural gas is a key industry of the energy market. It plays an influential role in the global economy as the primary fuel source. Processes and systems involved in producing and distributing oil & gas are highly complex, capital-intensive, and require state-of-the-art technology. Oil exploration includes the process of exploration, extraction, refining, and transportation of petroleum products. Fuel oil and gasoline (petrol) are the largest volume products of the industry.
The oil exploration industry is expected to grow significantly during the forecast period. 39% of crude oil is produced by OPEC (Organization of the Petroleum Exporting Countries), with its founding member Saudi Arabia being the largest producer, churning over 12.2 million barrels per day. Demand for oil exploration is set to rise and so is the demand for winches. Heavy-duty winches such as hydraulic winches are primarily used in exploration activities. Winches are mainly used in onshore and offshore oil & gas drilling, construction & transportation, launch & recovery systems, etc. Demand for winches such as diving/ROV (remotely operated vehicle) winches, truck winches, utility winches, hydraulic winches, and crane replacement winches is increasing in oil exploration applications.
In terms of product type, planetary gear winches account for the maximum revenue share across the globe. Planetary gear is a winch designed with a planetary gearbox. It easily transfers the largest torque in the most compact form. On the other hand, worm gear can transmit high tooth loads for ultimate power ratio; however, high sliding velocities across the teeth is a disadvantage. Hence, manufacturers are increasing the availability of planetary gear winches, since they deliver higher gear ratios, are popular for automatic transmissions, and have compact size. Simple maintenance and good resistance advantages are also driving the demand for planetary gear winches.
The planetary gear system is believed to have a power transfer efficiency of around 65%, while worm gear operates at a power transfer efficiency of up to 35% to 40%. Furthermore, planetary gear delivers high power, durability, high torque-to-weight ratio, and configuration flexibility. The global market is expected to generate maximum demand for winches made from planetary gear during the forecast period due to their higher efficiency and compact design. Hence, key players operating in the winch market are bullish on increasing their output capabilities throughout the assessment period.
In terms of operation, winches are divided into hydraulic, electric, pneumatic, and manual/hand. The choice of any of the winches depends on application, usage frequency, etc. The revenue share of electric winches is expected to grow at the highest CAGR during the forecast period. On the other hand, innovations for industrial and automotive winch products offer lucrative opportunities for winch manufacturers.
Demand for electric winches is expected to rise due to their advantages over other operation types, various design improvements, and new technologies in electric-operated winches. Furthermore, the price of the product is an important parameter for small and medium scale industries. The scaling up of operations in SMEs is expected to make it one of the fastest-growing markets for winches, which is also a leading factor for high adoption of electrical products. Furthermore, electric winch is one of the fastest winches on the market compared to other product types. This is driving the demand for electric winches.
Asia Pacific holds the dominant position in the global winch market. The market in the region is expected to grow at the fastest CAGR during the forecast period. Rise in industrialization in Asia Pacific is estimated to boost the demand for winches in various industries in the region. Winches are primarily employed in construction, oil & gas, mining, marine, and aerospace industries. Asia Pacific is estimated to hold a relatively large share of the global demand for winches, as the region is a prominent manufacturing hub. Growth of the construction industry in Asia Pacific, especially in countries such as China and India, is likely to drive the winch market in the region.
North America and Europe are developed regions consisting of numerous global manufacturers. Stakeholders operating in the winch market in these regions are striving for technology improvement and product enhancement. This is likely to fuel the winch market in these regions during the forecast period.
Prominent manufacturers are investing significantly in comprehensive research and development activities, primarily to develop technologically advanced and efficient products. Diversification of product portfolios and mergers & acquisitions are important strategies adopted by key players. Columbus McKinnon Corporation, COMEUP INDUSTRIES INC., Dover Corporation, EMCE WINCHES, Ingersoll Rand, Inc., Mile Marker Industries, LLC, PACCAR Inc., Ramsey Industries, Smittybilt Inc., and Warn Industries Inc. are some of the prominent entities operating in this market.
|
Attribute |
Detail |
|
Market Size Value in 2021 |
US$ 1540.7 Mn |
|
Market Forecast Value in 2031 |
US$ 2471.8 Mn |
|
Growth Rate (CAGR) |
4.9% |
|
Forecast Period |
2022–2031 |
|
Historical Data Available for |
2017–2020 |
|
Quantitative Units |
US$ Mn for Value & Thousand Units for Volume |
|
Market Analysis |
Includes cross segment analysis at global as well as regional level. Furthermore, qualitative analysis includes drivers, restraints, opportunities, key trends, Porter’s Five Forces analysis, value chain analysis, and key trend analysis. |
|
Competition Landscape |
|
|
Format |
Electronic (PDF) + Excel |
|
Market Segmentation |
|
|
Regions Covered |
|
|
Countries Covered |
|
|
Companies Profiled |
|
|
Customization Scope |
Available upon request |
|
Pricing |
Available upon request |
The winch market is expected to reach US$ 2471.8 Mn by 2031
The winch market is estimated to grow at a CAGR of 4.9% during the forecast period
Increasing demand for winch in end-use industries such as construction and oil & gas exploration is driving the market
Planetary gear winches segment contributes major share of the market
Asia Pacific is more attractive for vendors in the winch market
Columbus McKinnon Corporation, COMEUP INDUSTRIES INC., Dover Corporation, EMCE WINCHES, Ingersoll Rand, Inc., Mile Marker Industries, LLC, PACCAR Inc., Ramsey Industries, Smittybilt Inc., and Warn Industries Inc.
1. Preface
1.1. Market Definition and Scope
1.2. Market Segmentation
1.3. Key Research Objectives
1.4. Research Highlights
2. Assumptions
3. Research Methodology
4. Executive Summary
5. Market Overview
5.1. Market Dynamics
5.1.1. Drivers
5.1.2. Restraints
5.1.3. Opportunities
5.2. Key Market Indicators
5.2.1. Overall Material Handling Equipment Market Overview
5.3. Key Trend Analysis
5.3.1. Supplier Side
5.3.2. Demand Side
5.4. Industry SWOT Analysis
5.5. Porter’s Five Forces Analysis
5.6. Value Chain Analysis
5.7. Rules and Regulations
5.8. COVID-19 Impact Analysis
5.9. Global Winch Market Analysis, 2017- 2031
5.9.1. Market Value Projections (US$ Mn)
5.9.2. Market Volume Projections (Thousand Units)
6. Global Winch Market Analysis and Forecast, by Product Type
6.1. Global Winch Market Size (US$ Mn) (Thousand Units), by Product Type, 2017- 2031
6.1.1. Planetary Gear
6.1.2. Worm Gear
6.2. Incremental Opportunity, by Product Type
7. Global Winch Market Analysis and Forecast, by Operation
7.1. Global Winch Market Size (US$ Mn) (Thousand Units), by Operation, 2017- 2031
7.1.1. Hydraulic
7.1.2. Electric
7.1.3. Pneumatic
7.1.4. Manual
7.2. Incremental Opportunity, by Operation
8. Global Winch Market Analysis and Forecast, by Pulling Capacity (in lbs.)
8.1. Global Winch Market Size (US$ Mn) (Thousand Units), by Pulling Capacity (in lbs.), 2017- 2031
8.1.1. Below 2000
8.1.2. 2000 to 4000
8.1.3. 4000 to 8000
8.1.4. 8000 to 12000
8.1.5. 12000 to 16000
8.1.6. 16000 to 20000
8.1.7. 20000 to 40000
8.1.8. 40000 to 80000
8.1.9. Above 80000
8.2. Incremental Opportunity, by Pulling Capacity (in lbs.)
9. Global Winch Market Analysis and Forecast, by Application
9.1. Global Winch Market Size (US$ Mn) (Thousand Units), by Application, 2017- 2031
9.1.1. Commercial Recovery
9.1.2. Mobile Crane
9.1.3. Military
9.1.4. Workboats
9.1.5. Utility
9.1.6. Others
9.2. Incremental Opportunity, by Application
10. Global Winch Market Analysis and Forecast, by End-use Industry
10.1. Global Winch Market Size (US$ Mn) (Thousand Units), by End-use Industry, 2017- 2031
10.1.1. Oil & Gas
10.1.2. Marine Including Shipbuilding
10.1.3. Mining
10.1.4. Aerospace & Defense
10.1.5. Automotive
10.1.6. Construction
10.1.7. Metal Industry
10.1.8. Energy & Power
10.1.9. Transportation & Material Handling
10.1.10. Others
10.2. Incremental Opportunity, by End-use Industry
11. Global Winch Market Analysis and Forecast, by Distribution Channel
11.1. Global Winch Market Size (US$ Mn) (Thousand Units), by Distribution Channel, 2017- 2031
11.1.1. Direct Sales
11.1.2. Indirect Sales
11.2. Incremental Opportunity, by Distribution Channel
12. Global Winch Market Analysis and Forecast, by Region
12.1. Global Winch Market Size (US$ Mn) (Thousand Units), by Region, 2017- 2031
12.1.1. North America
12.1.2. Europe
12.1.3. Asia Pacific
12.1.4. Middle East & Africa
12.1.5. South America
12.2. Incremental Opportunity, by Region
13. North America Winch Market Analysis and Forecast
13.1. Regional Snapshot
13.2. Key Supplier Analysis
13.3. Key Trends Analysis
13.3.1. Supply side
13.3.2. Demand Side
13.4. Price Trend Analysis
13.4.1. Weighted Average Selling Price (US$)
13.5. Winch Market Size (US$ Mn) (Thousand Units), by Product Type, 2017- 2031
13.5.1. Planetary Gear
13.5.2. Worm Gear
13.6. Winch Market Size (US$ Mn) (Thousand Units), by Operation, 2017- 2031
13.6.1. Hydraulic
13.6.2. Electric
13.6.3. Pneumatic
13.6.4. Manual
13.7. Winch Market Size (US$ Mn) (Thousand Units), by Pulling Capacity (in lbs.), 2017- 2031
13.7.1. Below 2000
13.7.2. 2000 to 4000
13.7.3. 4000 to 8000
13.7.4. 8000 to 12000
13.7.5. 12000 to 16000
13.7.6. 16000 to 20000
13.7.7. 20000 to 40000
13.7.8. 40000 to 80000
13.7.9. Above 80000
13.8. Winch Market Size (US$ Mn) (Thousand Units), by Application, 2017- 2031
13.8.1. Commercial Recovery
13.8.2. Mobile Crane
13.8.3. Military
13.8.4. Workboats
13.8.5. Utility
13.8.6. Others
13.9. Winch Market Size (US$ Mn) (Thousand Units), by End-use Industry, 2017- 2031
13.9.1. Oil & Gas
13.9.2. Marine Including Shipbuilding
13.9.3. Mining
13.9.4. Aerospace & Defense
13.9.5. Automotive
13.9.6. Construction
13.9.7. Metal Industry
13.9.8. Energy & Power
13.9.9. Transportation & Material Handling
13.9.10. Others
13.10. Winch Market Size (US$ Mn) (Thousand Units), by Distribution Channel, 2017- 2031
13.10.1. Direct Sales
13.10.2. Indirect Sales
13.11. Winch Market Size (US$ Mn) (Thousand Units), by Country & Sub-region, 2017- 2031
13.11.1. U.S.
13.11.2. Canada
13.11.3. Rest of North America
13.12. Incremental Opportunity Analysis
14. Europe Winch Market Analysis and Forecast
14.1. Regional Snapshot
14.2. Key Supplier Analysis
14.3. Key Trends Analysis
14.3.1. Supply side
14.3.2. Demand Side
14.4. Price Trend Analysis
14.4.1. Weighted Average Selling Price (US$)
14.5. Winch Market Size (US$ Mn) (Thousand Units), by Product Type, 2017- 2031
14.5.1. Planetary Gear
14.5.2. Worm Gear
14.6. Winch Market Size (US$ Mn) (Thousand Units), by Operation, 2017- 2031
14.6.1. Hydraulic
14.6.2. Electric
14.6.3. Pneumatic
14.6.4. Manual
14.7. Winch Market Size (US$ Mn) (Thousand Units), by Pulling Capacity (in lbs.), 2017- 2031
14.7.1. Below 2000
14.7.2. 2000 to 4000
14.7.3. 4000 to 8000
14.7.4. 8000 to 12000
14.7.5. 12000 to 16000
14.7.6. 16000 to 20000
14.7.7. 20000 to 40000
14.7.8. 40000 to 80000
14.7.9. Above 80000
14.8. Winch Market Size (US$ Mn) (Thousand Units), by Application, 2017- 2031
14.8.1. Commercial Recovery
14.8.2. Mobile crane
14.8.3. Military
14.8.4. Workboats
14.8.5. Utility
14.8.6. Others
14.9. Winch Market Size (US$ Mn) (Thousand Units), by End-use Industry, 2017- 2031
14.9.1. Oil & Gas
14.9.2. Marine Including Shipbuilding
14.9.3. Mining
14.9.4. Aerospace & Defense
14.9.5. Automotive
14.9.6. Construction
14.9.7. Metal Industry
14.9.8. Energy & Power
14.9.9. Transportation & Material Handling
14.9.10. Others
14.10. Winch Market Size (US$ Mn) (Thousand Units), by Distribution Channel, 2017- 2031
14.10.1. Direct Sales
14.10.2. Indirect Sales
14.11. Winch Market Size (US$ Mn) (Thousand Units), by Country & Sub-region, 2017- 2031
14.11.1. U.K.
14.11.2. Germany
14.11.3. France
14.11.4. Rest of Europe
14.12. Incremental Opportunity Analysis
15. Asia Pacific Winch Market Analysis and Forecast
15.1. Regional Snapshot
15.2. Key Supplier Analysis
15.3. Key Trends Analysis
15.3.1. Supply side
15.3.2. Demand Side
15.4. Price Trend Analysis
15.4.1. Weighted Average Selling Price (US$)
15.5. Winch Market Size (US$ Mn) (Thousand Units), by Product Type, 2017- 2031
15.5.1. Planetary Gear
15.5.2. Worm Gear
15.6. Winch Market Size (US$ Mn) (Thousand Units), by Operation, 2017- 2031
15.6.1. Hydraulic
15.6.2. Electric
15.6.3. Pneumatic
15.6.4. Manual
15.7. Winch Market Size (US$ Mn) (Thousand Units), by Pulling Capacity (in lbs.), 2017- 2031
15.7.1. Below 2000
15.7.2. 2000 to 4000
15.7.3. 4000 to 8000
15.7.4. 8000 to 12000
15.7.5. 12000 to 16000
15.7.6. 16000 to 20000
15.7.7. 20000 to 40000
15.7.8. 40000 to 80000
15.7.9. Above 80000
15.8. Winch Market Size (US$ Mn) (Thousand Units), by Application, 2017- 2031
15.8.1. Commercial Recovery
15.8.2. Mobile crane
15.8.3. Military
15.8.4. Workboats
15.8.5. Utility
15.8.6. Others
15.9. Winch Market Size (US$ Mn) (Thousand Units), by End-use Industry, 2017- 2031
15.9.1. Oil & Gas
15.9.2. Marine Including Shipbuilding
15.9.3. Mining
15.9.4. Aerospace & Defense
15.9.5. Automotive
15.9.6. Construction
15.9.7. Metal Industry
15.9.8. Energy & Power
15.9.9. Transportation & Material Handling
15.9.10. Others
15.10. Winch Market Size (US$ Mn) (Thousand Units), by Distribution Channel, 2017- 2031
15.10.1. Direct Sales
15.10.2. Indirect Sales
15.11. Winch Market Size (US$ Mn) (Thousand Units), by Country & Sub-region, 2017- 2031
15.11.1. China
15.11.2. India
15.11.3. Japan
15.11.4. Rest of Asia Pacific
15.12. Incremental Opportunity Analysis
16. Middle East & Africa Winch Market Analysis and Forecast
16.1. Regional Snapshot
16.2. Key Supplier Analysis
16.3. Key Trends Analysis
16.3.1. Supply side
16.3.2. Demand Side
16.4. Price Trend Analysis
16.4.1. Weighted Average Selling Price (US$)
16.5. Winch Market Size (US$ Mn) (Thousand Units), by Product Type, 2017- 2031
16.5.1. Planetary Gear
16.5.2. Worm Gear
16.6. Winch Market Size (US$ Mn) (Thousand Units), by Operation, 2017- 2031
16.6.1. Hydraulic
16.6.2. Electric
16.6.3. Pneumatic
16.6.4. Manual
16.7. Winch Market Size (US$ Mn) (Thousand Units), by Pulling Capacity (in lbs.), 2017- 2031
16.7.1. Below 2000
16.7.2. 2000 to 4000
16.7.3. 4000 to 8000
16.7.4. 8000 to 12000
16.7.5. 12000 to 16000
16.7.6. 16000 to 20000
16.7.7. 20000 to 40000
16.7.8. 40000 to 80000
16.7.9. Above 80000
16.8. Winch Market Size (US$ Mn) (Thousand Units), by Application, 2017- 2031
16.8.1. Commercial Recovery
16.8.2. Mobile crane
16.8.3. Military
16.8.4. Workboats
16.8.5. Utility
16.8.6. Others
16.9. Winch Market Size (US$ Mn) (Thousand Units), by End-use Industry, 2017- 2031
16.9.1. Oil & Gas
16.9.2. Marine Including Shipbuilding
16.9.3. Mining
16.9.4. Aerospace & Defense
16.9.5. Automotive
16.9.6. Construction
16.9.7. Metal Industry
16.9.8. Energy & Power
16.9.9. Transportation & Material Handling
16.9.10. Others
16.10. Winch Market Size (US$ Mn) (Thousand Units), by Distribution Channel, 2017- 2031
16.10.1. Direct Sales
16.10.2. Indirect Sales
16.11. Winch Market Size (US$ Mn) (Thousand Units), by Country & Sub-region, 2017- 2031
16.11.1. GCC
16.11.2. South Africa
16.11.3. Rest of Middle East & Africa
16.12. Incremental Opportunity Analysis
17. South America Winch Market Analysis and Forecast
17.1. Regional Snapshot
17.2. Key Supplier Analysis
17.3. Key Trends Analysis
17.3.1. Supply side
17.3.2. Demand Side
17.4. Price Trend Analysis
17.4.1. Weighted Average Selling Price (US$)
17.5. Winch Market Size (US$ Mn) (Thousand Units), by Product Type, 2017- 2031
17.5.1. Planetary Gear
17.5.2. Worm Gear
17.6. Winch Market Size (US$ Mn) (Thousand Units), by Operation, 2017- 2031
17.6.1. Hydraulic
17.6.2. Electric
17.6.3. Pneumatic
17.6.4. Manual
17.7. Winch Market Size (US$ Mn) (Thousand Units), by Pulling Capacity (in lbs.), 2017- 2031
17.7.1. Below 2000
17.7.2. 2000 to 4000
17.7.3. 4000 to 8000
17.7.4. 8000 to 12000
17.7.5. 12000 to 16000
17.7.6. 16000 to 20000
17.7.7. 20000 to 40000
17.7.8. 40000 to 80000
17.7.9. Above 80000
17.8. Winch Market Size (US$ Mn) (Thousand Units), by Application, 2017- 2031
17.8.1. Commercial Recovery
17.8.2. Mobile crane
17.8.3. Military
17.8.4. Workboats
17.8.5. Utility
17.8.6. Others
17.9. Winch Market Size (US$ Mn) (Thousand Units), by End-use Industry, 2017- 2031
17.9.1. Oil & Gas
17.9.2. Marine Including Shipbuilding
17.9.3. Mining
17.9.4. Aerospace & Defense
17.9.5. Automotive
17.9.6. Construction
17.9.7. Metal Industry
17.9.8. Energy & Power
17.9.9. Transportation & Material Handling
17.9.10. Others
17.10. Winch Market Size (US$ Mn) (Thousand Units), by Distribution Channel, 2017- 2031
17.10.1. Direct Sales
17.10.2. Indirect Sales
17.11. Winch Market Size (US$ Mn) (Thousand Units), by Country & Sub-region, 2017- 2031
17.11.1. Brazil
17.11.2. Rest of South America
17.12. Incremental Opportunity Analysis
18. Competition Landscape
18.1. Competition Dashboard
18.2. Market Share Analysis % (2021)
18.3. Company Profiles [Company Overview, Product Portfolio, Financial Information (Subject to Data Availability), Distribution channel overview, Business Strategies / Recent Developments]
18.3.1. Columbus McKinnon Corporation
18.3.1.1. Company Overview
18.3.1.2. Product Portfolio
18.3.1.3. Financial Information (Subject to Data Availability)
18.3.1.4. Distribution channel overview
18.3.1.5. Business Strategies / Recent Developments
18.3.2. COMEUP INDUSTRIES INC.
18.3.2.1. Company Overview
18.3.2.2. Product Portfolio
18.3.2.3. Financial Information (Subject to Data Availability)
18.3.2.4. Distribution channel overview
18.3.2.5. Business Strategies / Recent Developments
18.3.3. Dover Corporation
18.3.3.1. Company Overview
18.3.3.2. Product Portfolio
18.3.3.3. Financial Information (Subject to Data Availability)
18.3.3.4. Distribution channel overview
18.3.3.5. Business Strategies / Recent Developments
18.3.4. EMCE WINCHES
18.3.4.1. Company Overview
18.3.4.2. Product Portfolio
18.3.4.3. Financial Information (Subject to Data Availability)
18.3.4.4. Distribution channel overview
18.3.4.5. Business Strategies / Recent Developments
18.3.5. Ingersoll Rand, Inc.
18.3.5.1. Company Overview
18.3.5.2. Product Portfolio
18.3.5.3. Financial Information (Subject to Data Availability)
18.3.5.4. Distribution channel overview
18.3.5.5. Business Strategies / Recent Developments
18.3.6. Mile Marker Industries, LLC
18.3.6.1. Company Overview
18.3.6.2. Product Portfolio
18.3.6.3. Financial Information (Subject to Data Availability)
18.3.6.4. Distribution channel overview
18.3.6.5. Business Strategies / Recent Developments
18.3.7. PACCAR Inc.
18.3.7.1. Company Overview
18.3.7.2. Product Portfolio
18.3.7.3. Financial Information (Subject to Data Availability)
18.3.7.4. Distribution channel overview
18.3.7.5. Business Strategies / Recent Developments
18.3.8. Ramsey Industries
18.3.8.1. Company Overview
18.3.8.2. Product Portfolio
18.3.8.3. Financial Information (Subject to Data Availability)
18.3.8.4. Distribution channel overview
18.3.8.5. Business Strategies / Recent Developments
18.3.9. Smittybilt Inc.
18.3.9.1. Company Overview
18.3.9.2. Product Portfolio
18.3.9.3. Financial Information (Subject to Data Availability)
18.3.9.4. Distribution channel overview
18.3.9.5. Business Strategies / Recent Developments
18.3.10. Warn Industries Inc.
18.3.10.1. Company Overview
18.3.10.2. Product Portfolio
18.3.10.3. Financial Information (Subject to Data Availability)
18.3.10.4. Distribution channel overview
18.3.10.5. Business Strategies / Recent Developments
19. Key Takeaways
19.1. Identification of Potential Market Spaces
19.1.1. Product Type
19.1.2. Operation
19.1.3. Pulling Capacity
19.1.4. Application
19.1.5. End-use Industry
19.1.6. Distribution Channel
19.1.7. Region
19.2. Understanding the Procurement Process of End-users
19.3. Preferred Sales & Marketing Strategy
List of Table
Table 1: Global Winch Market Value (US$ Mn) Forecast, 2017-2031, by Product Type
Table 2: Global Winch Market Volume (Thousand Units) Forecast, 2017-2031, by Product Type
Table 3: Global Winch Market Value (US$ Mn) Forecast, 2017-2031, By Operation
Table 4: Global Winch Market Volume (Thousand Units) Forecast, 2017-2031, By Operation
Table 5: Global Winch Market Value (US$ Mn) Forecast, 2017-2031, By Pulling Capacity
Table 6: Global Winch Market Volume (Thousand Units) Forecast, 2017-2031, By Pulling Capacity
Table 7: Global Winch Market Value (US$ Mn) Forecast, 2017-2031, By Application
Table 8: Global Winch Market Volume (Thousand Units) Forecast, 2017-2031, By Application
Table 9: Global Winch Market Value (US$ Mn) Forecast, 2017-2031, By End-Use Industry
Table 10: Global Winch Market Volume (Thousand Units) Forecast, 2017-2031, By End-Use Industry
Table 11: Global Winch Market Value (US$ Mn) Forecast, 2017-2031, By Distribution Channel
Table 12: Global Winch Market Volume (Thousand Units) Forecast, 2017-2031, By Distribution Channel
Table 13: Global Winch Market Value (US$ Mn) Forecast, 2017-2031, By Region
Table 14: Global Winch Market Volume (Thousand Units) Forecast, 2017-2031, By Region
Table 15: North America Winch Market Value (US$ Mn) Forecast, 2017-2031, by Product Type
Table 16: North America Winch Market Volume (Thousand Units) Forecast, 2017-2031, by Product Type
Table 17: North America Winch Market Value (US$ Mn) Forecast, 2017-2031, By Operation
Table 18: North America Winch Market Volume (Thousand Units) Forecast, 2017-2031, By Operation
Table 19: North America Winch Market Value (US$ Mn) Forecast, 2017-2031, By Pulling Capacity
Table 20: North America Winch Market Volume (Thousand Units) Forecast, 2017-2031, By Pulling Capacity
Table 21: North America Winch Market Value (US$ Mn) Forecast, 2017-2031, By Application
Table 22: North America Winch Market Volume (Thousand Units) Forecast, 2017-2031, By Application
Table 23: North America Winch Market Value (US$ Mn) Forecast, 2017-2031, By End-Use Industry
Table 24: North America Winch Market Volume (Thousand Units) Forecast, 2017-2031, By End-Use Industry
Table 25: North America Winch Market Value (US$ Mn) Forecast, 2017-2031, By Distribution Channel
Table 26: North America Winch Market Volume (Thousand Units) Forecast, 2017-2031, By Distribution Channel
Table 27: North America Winch Market Value (US$ Mn) Forecast, 2017-2031, By Region
Table 28: North America Winch Market Volume (Thousand Units) Forecast, 2017-2031, By Region
Table 29: Europe Winch Market Value (US$ Mn) Forecast, 2017-2031, by Product Type
Table 30: Europe Winch Market Volume (Thousand Units) Forecast, 2017-2031, by Product Type
Table 31: Europe Winch Market Value (US$ Mn) Forecast, 2017-2031, By Operation
Table 32: Europe Winch Market Volume (Thousand Units) Forecast, 2017-2031, By Operation
Table 33: Europe Winch Market Value (US$ Mn) Forecast, 2017-2031, By Pulling Capacity
Table 34: Europe Winch Market Volume (Thousand Units) Forecast, 2017-2031, By Pulling Capacity
Table 35: Europe Winch Market Value (US$ Mn) Forecast, 2017-2031, By Application
Table 36: Europe Winch Market Volume (Thousand Units) Forecast, 2017-2031, By Application
Table 37: Europe Winch Market Value (US$ Mn) Forecast, 2017-2031, By End-Use Industry
Table 38: Europe Winch Market Volume (Thousand Units) Forecast, 2017-2031, By End-Use Industry
Table 39: Europe Winch Market Value (US$ Mn) Forecast, 2017-2031, By Distribution Channel
Table 40: Europe Winch Market Volume (Thousand Units) Forecast, 2017-2031, By Distribution Channel
Table 41: Europe Winch Market Value (US$ Mn) Forecast, 2017-2031, By Region
Table 42: Europe Winch Market Volume (Thousand Units) Forecast, 2017-2031, By Region
Table 43: Asia Pacific Winch Market Value (US$ Mn) Forecast, 2017-2031, by Product Type
Table 44: Asia Pacific Winch Market Volume (Thousand Units) Forecast, 2017-2031, by Product Type
Table 45: Asia Pacific Winch Market Value (US$ Mn) Forecast, 2017-2031, By Operation
Table 46: Asia Pacific Winch Market Volume (Thousand Units) Forecast, 2017-2031, By Operation
Table 47: Asia Pacific Winch Market Value (US$ Mn) Forecast, 2017-2031, By Pulling Capacity
Table 48: Asia Pacific Winch Market Volume (Thousand Units) Forecast, 2017-2031, By Pulling Capacity
Table 49: Asia Pacific Winch Market Value (US$ Mn) Forecast, 2017-2031, By Application
Table 50: Asia Pacific Winch Market Volume (Thousand Units) Forecast, 2017-2031, By Application
Table 51: Asia Pacific Winch Market Value (US$ Mn) Forecast, 2017-2031, By End-Use Industry
Table 52: Asia Pacific Winch Market Volume (Thousand Units) Forecast, 2017-2031, By End-Use Industry
Table 53: Asia Pacific Winch Market Value (US$ Mn) Forecast, 2017-2031, By Distribution Channel
Table 54: Asia Pacific Winch Market Volume (Thousand Units) Forecast, 2017-2031, By Distribution Channel
Table 55: Asia Pacific Winch Market Value (US$ Mn) Forecast, 2017-2031, By Region
Table 56: Asia Pacific Winch Market Volume (Thousand Units) Forecast, 2017-2031, By Region
Table 57: Middle East & Africa Winch Market Value (US$ Mn) Forecast, 2017-2031, by Product Type
Table 58: Middle East & Africa Winch Market Volume (Thousand Units) Forecast, 2017-2031, by Product Type
Table 59: Middle East & Africa Winch Market Value (US$ Mn) Forecast, 2017-2031, By Operation
Table 60: Middle East & Africa Winch Market Volume (Thousand Units) Forecast, 2017-2031, By Operation
Table 61: Middle East & Africa Winch Market Value (US$ Mn) Forecast, 2017-2031, By Pulling Capacity
Table 62: Middle East & Africa Winch Market Volume (Thousand Units) Forecast, 2017-2031, By Pulling Capacity
Table 63: Middle East & Africa Winch Market Value (US$ Mn) Forecast, 2017-2031, By Application
Table 64: Middle East & Africa Winch Market Volume (Thousand Units) Forecast, 2017-2031, By Application
Table 65: Middle East & Africa Winch Market Value (US$ Mn) Forecast, 2017-2031, By End-Use Industry
Table 66: Middle East & Africa Winch Market Volume (Thousand Units) Forecast, 2017-2031, By End-Use Industry
Table 67: Middle East & Africa Winch Market Value (US$ Mn) Forecast, 2017-2031, By Distribution Channel
Table 68: Middle East & Africa Winch Market Volume (Thousand Units) Forecast, 2017-2031, By Distribution Channel
Table 69: Middle East & Africa Winch Market Value (US$ Mn) Forecast, 2017-2031, By Region
Table 70: Middle East & Africa Winch Market Volume (Thousand Units) Forecast, 2017-2031, By Region
Table 71: South America Winch Market Value (US$ Mn) Forecast, 2017-2031, by Product Type
Table 72: South America Winch Market Volume (Thousand Units) Forecast, 2017-2031, by Product Type
Table 73: South America Winch Market Value (US$ Mn) Forecast, 2017-2031, By Operation
Table 74: South America Winch Market Volume (Thousand Units) Forecast, 2017-2031, By Operation
Table 75: South America Winch Market Value (US$ Mn) Forecast, 2017-2031, By Pulling Capacity
Table 76: South America Winch Market Volume (Thousand Units) Forecast, 2017-2031, By Pulling Capacity
Table 77: South America Winch Market Value (US$ Mn) Forecast, 2017-2031, By Application
Table 78: South America Winch Market Volume (Thousand Units) Forecast, 2017-2031, By Application
Table 79: South America Winch Market Value (US$ Mn) Forecast, 2017-2031, By End-Use Industry
Table 80: South America Winch Market Volume (Thousand Units) Forecast, 2017-2031, By End-Use Industry
Table 81: South America Winch Market Value (US$ Mn) Forecast, 2017-2031, By Distribution Channel
Table 82: South America Winch Market Volume (Thousand Units) Forecast, 2017-2031, By Distribution Channel
Table 83: South America Winch Market Value (US$ Mn) Forecast, 2017-2031, By Region
Table 84: South America Winch Market Volume (Thousand Units) Forecast, 2017-2031, By Region
List of Figure
Figure 1: Global Winch Market Value (US$ Mn) Forecast, 2017-2031, by Product Type
Figure 2: Global Winch Market Volume (Thousand Units) Forecast, 2017-2031, by Product Type
Figure 3: Global Winch Market Incremental Opportunity (US$ Mn) Forecast, 2017-2031, by Product Type
Figure 4: Global Winch Market Value (US$ Mn) Forecast, 2017-2031, By Operation
Figure 5: Global Winch Market Volume (Thousand Units) Forecast, 2017-2031, By Operation
Figure 6: Global Winch Market Incremental Opportunity (US$ Mn) Forecast, 2017-2031, By Operation
Figure 7: Global Winch Market Value (US$ Mn) Forecast, 2017-2031, By Pulling Capacity
Figure 8: Global Winch Market Volume (Thousand Units) Forecast, 2017-2031, By Pulling Capacity
Figure 9: Global Winch Market Incremental Opportunity (US$ Mn) Forecast, 2017-2031, By Pulling Capacity
Figure 10: Global Winch Market Value (US$ Mn) Forecast, 2017-2031, By Application
Figure 11: Global Winch Market Volume (Thousand Units) Forecast, 2017-2031, By Application
Figure 12: Global Winch Market Incremental Opportunity (US$ Mn) Forecast, 2017-2031, By Application
Figure 13: Global Winch Market Value (US$ Mn) Forecast, 2017-2031, By End-Use Industry
Figure 14: Global Winch Market Volume (Thousand Units) Forecast, 2017-2031, By End-Use Industry
Figure 15: Global Winch Market Incremental Opportunity (US$ Mn) Forecast, 2017-2031, By End-Use Industry
Figure 16: Global Winch Market Value (US$ Mn) Forecast, 2017-2031, By Distribution Channel
Figure 17: Global Winch Market Volume (Thousand Units) Forecast, 2017-2031, By Distribution Channel
Figure 18: Global Winch Market Incremental Opportunity (US$ Mn) Forecast, 2017-2031, By Distribution Channel
Figure 19: Global Winch Market Value (US$ Mn) Forecast, 2017-2031, By Region
Figure 20: Global Winch Market Volume (Thousand Units) Forecast, 2017-2031, By Region
Figure 21: Global Winch Market Incremental Opportunity (US$ Mn) Forecast, 2017-2031, By Region
Figure 22: North America Winch Market Value (US$ Mn) Forecast, 2017-2031, by Product Type
Figure 23: North America Winch Market Volume (Thousand Units) Forecast, 2017-2031, by Product Type
Figure 24: North America Winch Market Incremental Opportunity (US$ Mn) Forecast, 2017-2031, by Product Type
Figure 25: North America Winch Market Value (US$ Mn) Forecast, 2017-2031, By Operation
Figure 26: North America Winch Market Volume (Thousand Units) Forecast, 2017-2031, By Operation
Figure 27: North America Winch Market Incremental Opportunity (US$ Mn) Forecast, 2017-2031, By Operation
Figure 28: North America Winch Market Value (US$ Mn) Forecast, 2017-2031, By Pulling Capacity
Figure 29: North America Winch Market Volume (Thousand Units) Forecast, 2017-2031, By Pulling Capacity
Figure 30: North America Winch Market Incremental Opportunity (US$ Mn) Forecast, 2017-2031, By Pulling Capacity
Figure 31: North America Winch Market Value (US$ Mn) Forecast, 2017-2031, By Application
Figure 32: North America Winch Market Volume (Thousand Units) Forecast, 2017-2031, By Application
Figure 33: North America Winch Market Incremental Opportunity (US$ Mn) Forecast, 2017-2031, By Application
Figure 34: North America Winch Market Value (US$ Mn) Forecast, 2017-2031, By End-Use Industry
Figure 35: North America Winch Market Volume (Thousand Units) Forecast, 2017-2031, By End-Use Industry
Figure 36: North America Winch Market Incremental Opportunity (US$ Mn) Forecast, 2017-2031, By End-Use Industry
Figure 37: North America Winch Market Value (US$ Mn) Forecast, 2017-2031, By Distribution Channel
Figure 38: North America Winch Market Volume (Thousand Units) Forecast, 2017-2031, By Distribution Channel
Figure 39: North America Winch Market Incremental Opportunity (US$ Mn) Forecast, 2017-2031, By Distribution Channel
Figure 40: North America Winch Market Value (US$ Mn) Forecast, 2017-2031, By Region
Figure 41: North America Winch Market Volume (Thousand Units) Forecast, 2017-2031, By Region
Figure 42: North America Winch Market Incremental Opportunity (US$ Mn) Forecast, 2017-2031, By Region
Figure 43: Europe Winch Market Value (US$ Mn) Forecast, 2017-2031, by Product Type
Figure 44: Europe Winch Market Volume (Thousand Units) Forecast, 2017-2031, by Product Type
Figure 45: Europe Winch Market Incremental Opportunity (US$ Mn) Forecast, 2017-2031, by Product Type
Figure 46: Europe Winch Market Value (US$ Mn) Forecast, 2017-2031, By Operation
Figure 47: Europe Winch Market Volume (Thousand Units) Forecast, 2017-2031, By Operation
Figure 48: Europe Winch Market Incremental Opportunity (US$ Mn) Forecast, 2017-2031, By Operation
Figure 49: Europe Winch Market Value (US$ Mn) Forecast, 2017-2031, By Pulling Capacity
Figure 50: Europe Winch Market Volume (Thousand Units) Forecast, 2017-2031, By Pulling Capacity
Figure 51: Europe Winch Market Incremental Opportunity (US$ Mn) Forecast, 2017-2031, By Pulling Capacity
Figure 52: Europe Winch Market Value (US$ Mn) Forecast, 2017-2031, By Application
Figure 53: Europe Winch Market Volume (Thousand Units) Forecast, 2017-2031, By Application
Figure 54: Europe Winch Market Incremental Opportunity (US$ Mn) Forecast, 2017-2031, By Application
Figure 55: Europe Winch Market Value (US$ Mn) Forecast, 2017-2031, By End-Use Industry
Figure 56: Europe Winch Market Volume (Thousand Units) Forecast, 2017-2031, By End-Use Industry
Figure 57: Europe Winch Market Incremental Opportunity (US$ Mn) Forecast, 2017-2031, By End-Use Industry
Figure 58: Europe Winch Market Value (US$ Mn) Forecast, 2017-2031, By Distribution Channel
Figure 59: Europe Winch Market Volume (Thousand Units) Forecast, 2017-2031, By Distribution Channel
Figure 60: Europe Winch Market Incremental Opportunity (US$ Mn) Forecast, 2017-2031, By Distribution Channel
Figure 61: Europe Winch Market Value (US$ Mn) Forecast, 2017-2031, By Region
Figure 62: Europe Winch Market Volume (Thousand Units) Forecast, 2017-2031, By Region
Figure 63: Europe Winch Market Incremental Opportunity (US$ Mn) Forecast, 2017-2031, By Region
Figure 64: Asia Pacific Winch Market Value (US$ Mn) Forecast, 2017-2031, by Product Type
Figure 65: Asia Pacific Winch Market Volume (Thousand Units) Forecast, 2017-2031, by Product Type
Figure 66: Asia Pacific Winch Market Incremental Opportunity (US$ Mn) Forecast, 2017-2031, by Product Type
Figure 67: Asia Pacific Winch Market Value (US$ Mn) Forecast, 2017-2031, By Operation
Figure 68: Asia Pacific Winch Market Volume (Thousand Units) Forecast, 2017-2031, By Operation
Figure 69: Asia Pacific Winch Market Incremental Opportunity (US$ Mn) Forecast, 2017-2031, By Operation
Figure 70: Asia Pacific Winch Market Value (US$ Mn) Forecast, 2017-2031, By Pulling Capacity
Figure 71: Asia Pacific Winch Market Volume (Thousand Units) Forecast, 2017-2031, By Pulling Capacity
Figure 72: Asia Pacific Winch Market Incremental Opportunity (US$ Mn) Forecast, 2017-2031, By Pulling Capacity
Figure 73: Asia Pacific Winch Market Value (US$ Mn) Forecast, 2017-2031, By Application
Figure 74: Asia Pacific Winch Market Volume (Thousand Units) Forecast, 2017-2031, By Application
Figure 75: Asia Pacific Winch Market Incremental Opportunity (US$ Mn) Forecast, 2017-2031, By Application
Figure 76: Asia Pacific Winch Market Value (US$ Mn) Forecast, 2017-2031, By End-Use Industry
Figure 77: Asia Pacific Winch Market Volume (Thousand Units) Forecast, 2017-2031, By End-Use Industry
Figure 78: Asia Pacific Winch Market Incremental Opportunity (US$ Mn) Forecast, 2017-2031, By End-Use Industry
Figure 79: Asia Pacific Winch Market Value (US$ Mn) Forecast, 2017-2031, By Distribution Channel
Figure 80: Asia Pacific Winch Market Volume (Thousand Units) Forecast, 2017-2031, By Distribution Channel
Figure 81: Asia Pacific Winch Market Incremental Opportunity (US$ Mn) Forecast, 2017-2031, By Distribution Channel
Figure 82: Asia Pacific Winch Market Value (US$ Mn) Forecast, 2017-2031, By Region
Figure 83: Asia Pacific Winch Market Volume (Thousand Units) Forecast, 2017-2031, By Region
Figure 84: Asia Pacific Winch Market Incremental Opportunity (US$ Mn) Forecast, 2017-2031, By Region
Figure 85: Middle East & Africa Winch Market Value (US$ Mn) Forecast, 2017-2031, by Product Type
Figure 86: Middle East & Africa Winch Market Volume (Thousand Units) Forecast, 2017-2031, by Product Type
Figure 87: Middle East & Africa Winch Market Incremental Opportunity (US$ Mn) Forecast, 2017-2031, by Product Type
Figure 88: Middle East & Africa Winch Market Value (US$ Mn) Forecast, 2017-2031, By Operation
Figure 89: Middle East & Africa Winch Market Volume (Thousand Units) Forecast, 2017-2031, By Operation
Figure 90: Middle East & Africa Winch Market Incremental Opportunity (US$ Mn) Forecast, 2017-2031, By Operation
Figure 91: Middle East & Africa Winch Market Value (US$ Mn) Forecast, 2017-2031, By Pulling Capacity
Figure 92: Middle East & Africa Winch Market Volume (Thousand Units) Forecast, 2017-2031, By Pulling Capacity
Figure 93: Middle East & Africa Winch Market Incremental Opportunity (US$ Mn) Forecast, 2017-2031, By Pulling Capacity
Figure 94: Middle East & Africa Winch Market Value (US$ Mn) Forecast, 2017-2031, By Application
Figure 95: Middle East & Africa Winch Market Volume (Thousand Units) Forecast, 2017-2031, By Application
Figure 96: Middle East & Africa Winch Market Incremental Opportunity (US$ Mn) Forecast, 2017-2031, By Application
Figure 97: Middle East & Africa Winch Market Value (US$ Mn) Forecast, 2017-2031, By End-Use Industry
Figure 98: Middle East & Africa Winch Market Volume (Thousand Units) Forecast, 2017-2031, By End-Use Industry
Figure 99: Middle East & Africa Winch Market Incremental Opportunity (US$ Mn) Forecast, 2017-2031, By End-Use Industry
Figure 100: Middle East & Africa Winch Market Value (US$ Mn) Forecast, 2017-2031, By Distribution Channel
Figure 101: Middle East & Africa Winch Market Volume (Thousand Units) Forecast, 2017-2031, By Distribution Channel
Figure 102: Middle East & Africa Winch Market Incremental Opportunity (US$ Mn) Forecast, 2017-2031, By Distribution Channel
Figure 103: Middle East & Africa Winch Market Value (US$ Mn) Forecast, 2017-2031, By Region
Figure 104: Middle East & Africa Winch Market Volume (Thousand Units) Forecast, 2017-2031, By Region
Figure 105: Middle East & Africa Winch Market Incremental Opportunity (US$ Mn) Forecast, 2017-2031, By Region
Figure 106: South America Winch Market Value (US$ Mn) Forecast, 2017-2031, by Product Type
Figure 107: South America Winch Market Volume (Thousand Units) Forecast, 2017-2031, by Product Type
Figure 108: South America Winch Market Incremental Opportunity (US$ Mn) Forecast, 2017-2031, by Product Type
Figure 109: South America Winch Market Value (US$ Mn) Forecast, 2017-2031, By Operation
Figure 110: South America Winch Market Volume (Thousand Units) Forecast, 2017-2031, By Operation
Figure 111: South America Winch Market Incremental Opportunity (US$ Mn) Forecast, 2017-2031, By Operation
Figure 112: South America Winch Market Value (US$ Mn) Forecast, 2017-2031, By Pulling Capacity
Figure 113: South America Winch Market Volume (Thousand Units) Forecast, 2017-2031, By Pulling Capacity
Figure 114: South America Winch Market Incremental Opportunity (US$ Mn) Forecast, 2017-2031, By Pulling Capacity
Figure 115: South America Winch Market Value (US$ Mn) Forecast, 2017-2031, By Application
Figure 116: South America Winch Market Volume (Thousand Units) Forecast, 2017-2031, By Application
Figure 117: South America Winch Market Incremental Opportunity (US$ Mn) Forecast, 2017-2031, By Application
Figure 118: South America Winch Market Value (US$ Mn) Forecast, 2017-2031, By End-Use Industry
Figure 119: South America Winch Market Volume (Thousand Units) Forecast, 2017-2031, By End-Use Industry
Figure 120: South America Winch Market Incremental Opportunity (US$ Mn) Forecast, 2017-2031, By End-Use Industry
Figure 121: South America Winch Market Value (US$ Mn) Forecast, 2017-2031, By Distribution Channel
Figure 122: South America Winch Market Volume (Thousand Units) Forecast, 2017-2031, By Distribution Channel
Figure 123: South America Winch Market Incremental Opportunity (US$ Mn) Forecast, 2017-2031, By Distribution Channel
Figure 124: South America Winch Market Value (US$ Mn) Forecast, 2017-2031, By Region
Figure 125: South America Winch Market Volume (Thousand Units) Forecast, 2017-2031, By Region
Figure 126: South America Winch Market Incremental Opportunity (US$ Mn) Forecast, 2017-2031, By Region
Copyright © Transparency Market Research, Inc. All Rights reserved
Trust Online

Winch Market