
Reports
Reports
Analysts’ Viewpoint on Market Scenario
Rise in demand for glass wafers from MEMS and image sensors is anticipated to fuel the global wafer glass market in the next few years. A large market potential for semiconductor glass wafers has been created by the emergence and growth of the Internet of Things (IoT). Additionally, consistent R&D activities for the development of glass substrates in last few years have prompted numerous players to produce novel, ground-breaking, cost-effective, and efficient products with better design.
Wafer-level packaging technology has been gaining popularity for the last few years, replacing traditional individual-piece packaging. Consequently, the demand for glass as a carrier substrate in packaging is increasing. Key manufacturers of wafer glass are focused on the development of products with diameters between 25mm and 300mm in order to gain lucrative opportunities. This is because glass wafers with such physical dimensions are more frequently used for MEMS and image sensor applications.
Glass wafers are thin precision glass discs that are typically made of borosilicate glass, quartz, or fused silica and are utilized as a substrate carrier for bonding silicon and other substrates. Glass wafers are also used in display engineering and display glass inspection systems. Glass wafers offer several advantages over silicon wafers, which include low electrical loss, better warp management, and the potential to optimize processes. Wafer glass are employed in various applications such as wafer packaging, substrate carrier, and TGV interposer. Growth in demand for glass wafer fabrication in microelectronic mechanical systems (MEMS) and consumer electronics for wafer packaging and substrate carriers is projected to propel market development during the forecast period.
Glass wafers are increasingly being used as a technological component of MEMS, image sensors, and other electronics applications as an alternative to silicon wafers. Glass wafers protect these sensitive components by preventing corrosion and other damage. Indeed, glass wafer packaging is becoming more common in MEMS technology due to the unique material properties of glass versus other wafer materials such as silicon or ceramic.
Glass wafer fabrication innovation is increasingly contributing to the advancement of MEMS technology, due to the development in consumer electronics and automotive sector. Thus, these are widely used in wafer packaging for MEMS as well as substrates carriers in various consumer electronics devices. Moreover, rise in popularity of Internet of Things (IoT), smartphones, automation, and portable electronics is driving the consumer electronics market in which MEMS plays a significant role. According to the India Brand Equity Foundation, the appliances and consumer electronics (ACE) industry is expected to grow at a CAGR of 9% and reach a value of US$ 48.4 Bn by 2022. Thus, growth in consumer electronics is likely to fuel the demand for wafer glass during the forecast period.
New emerging electronic packaging requirements are broadening the scope of the wafer glass business. Some of the key market players are introducing new products to gain revenue benefits. For instance, in June 2022, Corning Inc. announced the introduction of its new Ultra-Low TTV Glass Carrier Wafers, which enable advanced semiconductor manufacturing as well as applications for 5G connectivity.
MEMS sensors, which combine electronic and mechanical elements to combine signal processing abilities on a single small chip, are widely used in automobiles. MEMS are manufactured using integrated circuit (IC) batch processing techniques, and their sizes range from a few micrometers to millimeters.
MEMS sensors could be used in diverse applications, including tier pressure monitoring systems, oil pressure sensing, pedestrian protection, exhaust gas recirculation, rollover detection, and navigation systems. Sales of electric vehicles, such as battery electric vehicles (BEVs) and plug-in hybrid electric vehicles (PHEVs), increased in 2020 despite a weak auto sector, and they nearly doubled to 6.6 million in 2021. The EV sales growth rate in Europe was highest around 61%, in 2021, surpassing China (58%) and the U.S. (32%). Thus, growth in the automotive sector leads to increase the demand of MEMS devices, which in turn is boosting market progression.
Governments of various nations have an intense interest in forming standards and regulations for automotive MEMS sensors, which in turn is estimated to fuel the wafer glass industry in the next few years. Increased demand for IoT technologies, vehicle safety and security, and advanced technology are also expected to boost the demand for wafer glass in the automotive sector in the next few years.
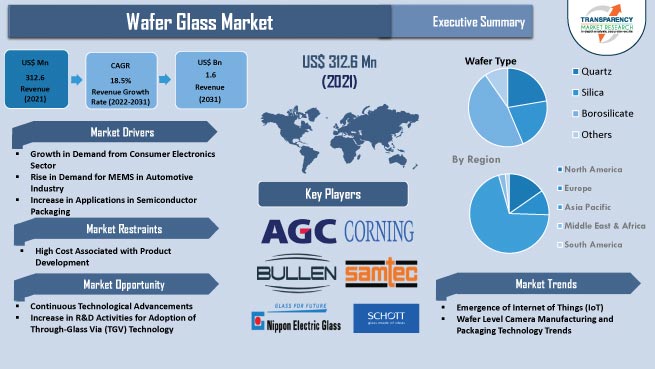
Based on wafer type, the global wafer glass market has been segmented into quartz, silica, borosilicate, and others. The borosilicate segment held 46.7% share of the market in 2021, and it is anticipated to dominate the market during the forecast period. Borosilicate glass is strong and durable, hence suitable for different applications. It is less expensive than other types of wafer glass. The borosilicate segment is likely to maintain its dominance during the forecast period, owing to an increase in adoption in semiconductor devices, optical lenses, optical filters, and sensors applications.
In terms of end-use, the global wafer glass market has been classified into MEMS, image sensors, semiconductors, and others. The image sensors segment dominated and held 38.2% share of the global business in 2021. Increase in demand for image sensors in smartphones, laptops, tablets, TVs, and surveillance cameras is projected to fuel the segment in the next few years.
Furthermore, increase in usage of image sensors in ADAS systems in a vehicle is also contributing to the segment growth. The image sensor uses a glass wafer for wafer-level capping, which is bonded to the image sensor wafer through an adhesive bonding process.
Asia Pacific dominated the global market with 70.1% share in 2021 due to the presence of substantial wafer end users, as well as the largest wafer production capacity and competence among regional players. China and Japan are projected to contribute significant market share of Asia Pacific during the forecast period. Rise in demand for smartphones and computer devices along with increase in adoption of autonomous vehicles in Asia Pacific is expected to fuel market expansion in the region. Moreover, Taiwan held 20.1% share of the global market in 2021, owing to the presence of major wafer producer foundries in the country.
North America and Europe held 15.3% and 10.2% share, respectively, of the global market in 2021. Increase in R&D activities in the U.S. and government initiatives for the growth of the semiconductor sector are likely to boost the market in North America during the forecast period. Furthermore, growth in end-use industries such as automobile, consumer electronics in North America is also contributing to market development in the region.
The global wafer glass market is consolidated, with a small number of large-scale vendors controlling majority of the share. Most of the wafer glass companies are investing significantly in comprehensive research and development activities for new product development. Expansion of product portfolios and mergers and acquisitions are major strategies adopted by key players.
AGC Inc., Bullen, Coresix Precision Glass, Inc., Corning Incorporated, Nippon Electric Glass, Plan Optik AG, Samtec, Inc., SCHOTT AG, Shin-Etsu Chemical Co., Ltd, and Swift Glass are the prominent entities operating in the global market.
Key players have been profiled in the market research report based on parameters such as company overview, financial overview, business strategies, product portfolio, business segments, and recent developments.
|
Attribute |
Detail |
|
Market Size Value in 2021 |
US$ 312.6 Mn |
|
Market Forecast Value in 2031 |
US$ 1.6 Bn |
|
Growth Rate (CAGR) |
18.5% |
|
Forecast Period |
2022–2031 |
|
Historical Data Available for |
2017–2020 |
|
Quantitative Units |
US$ Mn/Bn for Value and Thousand Units for Volume |
|
Market Analysis |
It includes cross segment analysis at global as well as regional level. Furthermore, qualitative analysis includes drivers, restraints, opportunities, key trends, Porter’s Five Forces analysis, value chain analysis, and key trend analysis. |
|
Competition Landscape |
|
|
Format |
Electronic (PDF) + Excel |
|
Market Segmentation |
|
|
Regions Covered |
|
|
Countries Covered |
|
|
Companies Profiled |
|
|
Customization Scope |
Available upon request |
|
Pricing |
Available upon request |
The market stood at US$ 312.6 Mn in 2021
The market is expected to advance at a CAGR of 18.5% from 2022 to 2031
Growth in demand from consumer electronics industry, increase in applications in semiconductor packaging, and rise in demand for MEMS in automotive sector
Consumer electronics was the largest industry vertical segment that held 49.1% share in 2021
Asia Pacific is a more attractive region for vendors in the global market
AGC Inc., Bullen, Coresix Precision Glass, Inc., Corning Incorporated, Nippon Electric Glass, Plan Optik AG, Samtec, Inc., SCHOTT AG, Shin-Etsu Chemical Co., Ltd, and Swift Glass
1. Preface
1.1. Market Introduction
1.2. Market and Segments Definition
1.3. Market Taxonomy
1.4. Research Methodology
1.5. Assumption and Acronyms
2. Executive Summary
2.1. Global Wafer Glass Market Overview
2.2. Regional Outline
2.3. Industry Outline
2.4. Market Dynamics Snapshot
2.5. Competition Blueprint
3. Market Dynamics
3.1. Macro-economic Factors
3.2. Drivers
3.3. Restraints
3.4. Opportunities
3.5. Key Trends
3.6. Regulatory Framework
4. Associated Industry and Key Indicator Assessment
4.1. Parent Industry Overview – Global Printed Circuit Boards Industry Overview
4.2. Supply Chain Analysis
4.3. Technology Roadmap
4.4. Industry SWOT Analysis
4.5. Porter’s Five Forces Analysis
4.6. COVID-19 Impact and Recovery Analysis
5. Global Wafer Glass Market Analysis, by Wafer Type
5.1. Wafer Glass Market Size (US$ Mn) and Volume (Thousand Units) Analysis & Forecast, by Wafer Type, 2017–2031
5.1.1. Quartz
5.1.2. Silica
5.1.3. Borosilicate
5.1.4. Others
5.2. Market Attractiveness Analysis, By Wafer Type
6. Global Wafer Glass Market Analysis, by Wafer Diameter
6.1. Wafer Glass Market Size (US$ Mn) and Volume (Thousand Units) Analysis & Forecast, by Wafer Diameter, 2017–2031
6.1.1. Up to 100mm
6.1.2. 125mm
6.1.3. 150mm
6.1.4. 200mm
6.1.5. 300mm
6.1.6. Above 300mm
6.2. Market Attractiveness Analysis, By Wafer Diameter
7. Global Wafer Glass Market Analysis, by Application
7.1. Wafer Glass Market Size (US$ Mn) Analysis & Forecast, by Application, 2017–2031
7.1.1. Wafer Packaging
7.1.2. Substrate Carrier
7.1.3. TGV Interposer
7.2. Market Attractiveness Analysis, By Application
8. Global Wafer Glass Market Analysis, by End-use
8.1. Wafer Glass Market Size (US$ Mn) Analysis & Forecast, by End-use, 2017–2031
8.1.1. MEMS
8.1.2. Image Sensors
8.1.3. Semiconductors
8.1.4. Others
8.2. Market Attractiveness Analysis, By End-use
9. Global Wafer Glass Market Analysis, by Industry Vertical
9.1. Wafer Glass Market Size (US$ Mn) Analysis & Forecast, by Industry Vertical, 2017–2031
9.1.1. Automotive
9.1.2. Consumer Electronics
9.1.3. IT & Telecommunication
9.1.4. Others
9.2. Market Attractiveness Analysis, By Industry Vertical
10. Global Wafer Glass Market Analysis and Forecast, by Region
10.1. Wafer Glass Market Size (US$ Mn) and Volume (Thousand Units) Analysis & Forecast, by Region, 2017–2031
10.1.1. North America
10.1.2. Europe
10.1.3. Asia Pacific
10.1.4. Middle East & Africa
10.1.5. South America
10.2. Market Attractiveness Analysis, By Region
11. North America Wafer Glass Market Analysis and Forecast
11.1. Market Snapshot
11.2. Drivers and Restraints: Impact Analysis
11.3. Wafer Glass Market Size (US$ Mn) and Volume (Thousand Units) Analysis & Forecast, by Wafer Type, 2017–2031
11.3.1. Quartz
11.3.2. Silica
11.3.3. Borosilicate
11.3.4. Others
11.4. Electronic Wafer Glass Market Size (US$ Mn) and Volume (Thousand Units) Analysis & Forecast, by Wafer Diameter, 2017–2031
11.4.1. Up to 100mm
11.4.2. 125mm
11.4.3. 150mm
11.4.4. 200mm
11.4.5. 300mm
11.4.6. Above 300mm
11.5. Wafer Glass Market Size (US$ Mn) Analysis & Forecast, by Application, 2017–2031
11.5.1. Wafer Packaging
11.5.2. Substrate Carrier
11.5.3. TGV Interposer
11.6. Wafer Glass Market Size (US$ Mn) Analysis & Forecast, by End-use, 2017–2031
11.6.1. MEMS
11.6.2. Image Sensors
11.6.3. Semiconductors
11.6.4. Others
11.7. Wafer Glass Market Size (US$ Mn) Analysis & Forecast, by Industry Vertical, 2017–2031
11.7.1. Automotive
11.7.2. Consumer Electronics
11.7.3. IT & Telecommunication
11.7.4. Others
11.8. Others Wafer Glass Market Size (US$ Mn) and Volume (Thousand Units) Analysis & Forecast, by Country and Sub-region, 2017–2031
11.8.1. The U.S.
11.8.2. Canada
11.8.3. Rest of North America
11.9. Market Attractiveness Analysis
11.9.1. By Wafer Type
11.9.2. By Wafer Diameter
11.9.3. By Application
11.9.4. By End-use
11.9.5. By Industry Vertical
11.9.6. By Country/Sub-region
12. Europe Wafer Glass Market Analysis and Forecast
12.1. Market Snapshot
12.2. Drivers and Restraints: Impact Analysis
12.3. Wafer Glass Market Size (US$ Mn) and Volume (Thousand Units) Analysis & Forecast, by Wafer Type, 2017–2031
12.3.1. Quartz
12.3.2. Silica
12.3.3. Borosilicate
12.3.4. Others
12.4. Electronic Wafer Glass Market Size (US$ Mn) and Volume (Thousand Units) Analysis & Forecast, by Wafer Diameter, 2017–2031
12.4.1. Up to 100mm
12.4.2. 125mm
12.4.3. 150mm
12.4.4. 200mm
12.4.5. 300mm
12.4.6. Above 300mm
12.5. Wafer Glass Market Size (US$ Mn) Analysis & Forecast, by Application, 2017–2031
12.5.1. Wafer Packaging
12.5.2. Substrate Carrier
12.5.3. TGV Interposer
12.6. Wafer Glass Market Size (US$ Mn) Analysis & Forecast, by End-use, 2017–2031
12.6.1. MEMS
12.6.2. Image Sensors
12.6.3. Semiconductors
12.6.4. Others
12.7. Wafer Glass Market Size (US$ Mn) Analysis & Forecast, by Industry Vertical, 2017–2031
12.7.1. Automotive
12.7.2. Consumer Electronics
12.7.3. IT & Telecommunication
12.7.4. Others
12.8. Wafer Glass Market Size (US$ Mn) and Volume (Thousand Units) Analysis & Forecast, by Country and Sub-region, 2017–2031
12.8.1. The U.K.
12.8.2. Germany
12.8.3. France
12.8.4. Rest of Europe
12.9. Market Attractiveness Analysis
12.9.1. By Wafer Type
12.9.2. By Wafer Diameter
12.9.3. By Application
12.9.4. By End-use
12.9.5. By Industry Vertical
12.9.6. By Country/Sub-region
13. Asia Pacific Wafer Glass Market Analysis and Forecast
13.1. Market Snapshot
13.2. Drivers and Restraints: Impact Analysis
13.3. Wafer Glass Market Size (US$ Mn) and Volume (Thousand Units) Analysis & Forecast, by Wafer Type, 2017–2031
13.3.1. Quartz
13.3.2. Silica
13.3.3. Borosilicate
13.3.4. Others
13.4. Electronic Wafer Glass Market Size (US$ Mn) and Volume (Thousand Units) Analysis & Forecast, by Wafer Diameter, 2017–2031
13.4.1. Up to 100mm
13.4.2. 125mm
13.4.3. 150mm
13.4.4. 200mm
13.4.5. 300mm
13.4.6. Above 300mm
13.5. Wafer Glass Market Size (US$ Mn) Analysis & Forecast, by Application, 2017–2031
13.5.1. Wafer Packaging
13.5.2. Substrate Carrier
13.5.3. TGV Interposer
13.6. Wafer Glass Market Size (US$ Mn) Analysis & Forecast, by End-use, 2017–2031
13.6.1. MEMS
13.6.2. Image Sensors
13.6.3. Semiconductors
13.6.4. Others
13.7. Wafer Glass Market Size (US$ Mn) Analysis & Forecast, by Industry Vertical, 2017–2031
13.7.1. Automotive
13.7.2. Consumer Electronics
13.7.3. IT & Telecommunication
13.7.4. Others
13.8. Wafer Glass Market Size (US$ Mn) and Volume (Thousand Units) Analysis & Forecast, by Country and Sub-region, 2017–2031
13.8.1. China
13.8.2. Japan
13.8.3. India
13.8.4. South Korea
13.8.5. Taiwan
13.8.6. Rest of Asia Pacific
13.9. Market Attractiveness Analysis
13.9.1. By Wafer Type
13.9.2. By Wafer Diameter
13.9.3. By Application
13.9.4. By End-use
13.9.5. By Industry Vertical
13.9.6. By Country/Sub-region
14. Middle East & Africa Wafer Glass Market Analysis and Forecast
14.1. Market Snapshot
14.2. Drivers and Restraints: Impact Analysis
14.3. Wafer Glass Market Size (US$ Mn) and Volume (Thousand Units) Analysis & Forecast, by Wafer Type, 2017–2031
14.3.1. Quartz
14.3.2. Silica
14.3.3. Borosilicate
14.3.4. Others
14.4. Electronic Wafer Glass Market Size (US$ Mn) and Volume (Thousand Units) Analysis & Forecast, by Wafer Diameter, 2017–2031
14.4.1. Up to 100mm
14.4.2. 125mm
14.4.3. 150mm
14.4.4. 200mm
14.4.5. 300mm
14.4.6. Above 300mm
14.5. Wafer Glass Market Size (US$ Mn) Analysis & Forecast, by Application, 2017–2031
14.5.1. Wafer Packaging
14.5.2. Substrate Carrier
14.5.3. TGV Interposer
14.6. Wafer Glass Market Size (US$ Mn) Analysis & Forecast, by End-use, 2017–2031
14.6.1. MEMS
14.6.2. Image Sensors
14.6.3. Semiconductors
14.6.4. Others
14.7. Wafer Glass Market Size (US$ Mn) Analysis & Forecast, by Industry Vertical, 2017–2031
14.7.1. Automotive
14.7.2. Consumer Electronics
14.7.3. IT & Telecommunication
14.7.4. Others
14.8. Wafer Glass Market Size (US$ Mn) and Volume (Thousand Units) Analysis & Forecast, by Country and Sub-region, 2017–2031
14.8.1. GCC
14.8.2. South Africa
14.8.3. Rest of Middle East & Africa
14.9. Market Attractiveness Analysis
14.9.1. By Wafer Type
14.9.2. By Wafer Diameter
14.9.3. By Application
14.9.4. By End-use
14.9.5. By Industry Vertical
14.9.6. By Country/Sub-region
15. South America Wafer Glass Market Analysis and Forecast
15.1. Market Snapshot
15.2. Drivers and Restraints: Impact Analysis
15.3. Wafer Glass Market Size (US$ Mn) and Volume (Thousand Units) Analysis & Forecast, by Wafer Type, 2017–2031
15.3.1. Quartz
15.3.2. Silica
15.3.3. Borosilicate
15.3.4. Others
15.4. Electronic Wafer Glass Market Size (US$ Mn) and Volume (Thousand Units) Analysis & Forecast, by Wafer Diameter, 2017–2031
15.4.1. Up to 100mm
15.4.2. 125mm
15.4.3. 150mm
15.4.4. 200mm
15.4.5. 300mm
15.4.6. Above 300mm
15.5. Wafer Glass Market Size (US$ Mn) Analysis & Forecast, by Application, 2017–2031
15.5.1. Wafer Packaging
15.5.2. Substrate Carrier
15.5.3. TGV Interposer
15.6. Wafer Glass Market Size (US$ Mn) Analysis & Forecast, by End-use, 2017–2031
15.6.1. MEMS
15.6.2. Image Sensors
15.6.3. Semiconductors
15.6.4. Others
15.7. Wafer Glass Market Size (US$ Mn) Analysis & Forecast, by Industry Vertical, 2017–2031
15.7.1. Automotive
15.7.2. Consumer Electronics
15.7.3. IT & Telecommunication
15.7.4. Others
15.8. Wafer Glass Market Size (US$ Mn) and Volume (Thousand Units) Analysis & Forecast, by Country and Sub-region, 2017–2031
15.8.1. Brazil
15.8.2. Rest of South America
15.9. Market Attractiveness Analysis
15.9.1. By Wafer Type
15.9.2. By Wafer Diameter
15.9.3. By Application
15.9.4. By End-use
15.9.5. By Industry Vertical
15.9.6. By Country/Sub-region
16. Competition Assessment
16.1. Global Wafer Glass Market Competition Matrix - a Dashboard View
16.1.1. Global Wafer Glass Market Company Share Analysis, by Value (2021)
16.1.2. Technological Differentiator
17. Company Profiles (Global Manufacturers/Suppliers)
17.1. AGC Inc.
17.1.1. Overview
17.1.2. Product Portfolio
17.1.3. Sales Footprint
17.1.4. Key Subsidiaries or Distributors
17.1.5. Strategy and Recent Developments
17.1.6. Key Financials
17.2. Bullen
17.2.1. Overview
17.2.2. Product Portfolio
17.2.3. Sales Footprint
17.2.4. Key Subsidiaries or Distributors
17.2.5. Strategy and Recent Developments
17.2.6. Key Financials
17.3. Coresix Precision Glass, Inc.
17.3.1. Overview
17.3.2. Product Portfolio
17.3.3. Sales Footprint
17.3.4. Key Subsidiaries or Distributors
17.3.5. Strategy and Recent Developments
17.3.6. Key Financials
17.4. Corning Incorporated
17.4.1. Overview
17.4.2. Product Portfolio
17.4.3. Sales Footprint
17.4.4. Key Subsidiaries or Distributors
17.4.5. Strategy and Recent Developments
17.4.6. Key Financials
17.5. Nippon Electric Glass
17.5.1. Overview
17.5.2. Product Portfolio
17.5.3. Sales Footprint
17.5.4. Key Subsidiaries or Distributors
17.5.5. Strategy and Recent Developments
17.5.6. Key Financials
17.6. Plan Optik AG
17.6.1. Overview
17.6.2. Product Portfolio
17.6.3. Sales Footprint
17.6.4. Key Subsidiaries or Distributors
17.6.5. Strategy and Recent Developments
17.6.6. Key Financials
17.7. Samtec, Inc.
17.7.1. Overview
17.7.2. Product Portfolio
17.7.3. Sales Footprint
17.7.4. Key Subsidiaries or Distributors
17.7.5. Strategy and Recent Developments
17.7.6. Key Financials
17.8. SCHOTT AG
17.8.1. Overview
17.8.2. Product Portfolio
17.8.3. Sales Footprint
17.8.4. Key Subsidiaries or Distributors
17.8.5. Strategy and Recent Developments
17.8.6. Key Financials
17.9. Shin-Etsu Chemical Co., Ltd
17.9.1. Overview
17.9.2. Product Portfolio
17.9.3. Sales Footprint
17.9.4. Key Subsidiaries or Distributors
17.9.5. Strategy and Recent Developments
17.9.6. Key Financials
17.10. Swift glass
17.10.1. Overview
17.10.2. Product Portfolio
17.10.3. Sales Footprint
17.10.4. Key Subsidiaries or Distributors
17.10.5. Strategy and Recent Developments
17.10.6. Key Financials
18. Recommendation
18.1. Opportunity Assessment
18.1.1. By Wafer Type
18.1.2. By Wafer Diameter
18.1.3. By Application
18.1.4. By End-use
18.1.5. By Industry Vertical
18.1.6. By Region
List of Tables
Table 01: Global Wafer Glass Market Size & Forecast, by Wafer Type, Value (US$ Mn), 2017-2031
Table 02: Global Wafer Glass Market Size & Forecast, by Wafer Type, Volume (Thousand Units), 2017-2031
Table 03: Global Wafer Glass Market Size & Forecast, by Wafer Diameter, Value (US$ Mn), 2017-2031
Table 04: Global Wafer Glass Market Size & Forecast, by Wafer Diameter, Volume (Thousand Units), 2017-2031
Table 05: Global Wafer Glass Market Size & Forecast, by Application, Value (US$ Mn), 2017-2031
Table 06: Global Wafer Glass Market Size & Forecast, by End-use, Value (US$ Mn), 2017-2031
Table 07: Global Wafer Glass Market Size & Forecast, by Industry Vertical, Value (US$ Mn), 2017-2031
Table 08: Global Wafer Glass Market Size & Forecast, by Region, Value (US$ Mn), 2017-2031
Table 09: Global Wafer Glass Market Size & Forecast, by Region, Volume (Thousand Units), 2017-2031
Table 10: North America Wafer Glass Market Size & Forecast, by Wafer Type, Value (US$ Mn), 2017-2031
Table 11: North America Wafer Glass Market Size & Forecast, by Wafer Type, Volume (Thousand Units), 2017-2031
Table 12: North America Wafer Glass Market Size & Forecast, by Wafer Diameter, Value (US$ Mn), 2017-2031
Table 13: North America Wafer Glass Market Size & Forecast, by Wafer Diameter, Volume (Thousand Units), 2017-2031
Table 14: North America Wafer Glass Market Size & Forecast, by Application, Value (US$ Mn), 2017-2031
Table 15: North America Wafer Glass Market Size & Forecast, by End-use, Value (US$ Mn), 2017-2031
Table 16: North America Wafer Glass Market Size & Forecast, by Industry Vertical, Value (US$ Mn), 2017-2031
Table 17: North America Wafer Glass Market Size & Forecast, by Country, Value (US$ Mn), 2017-2031
Table 18: North America Wafer Glass Market Size & Forecast, by Country, Volume (Thousand Units), 2017-2031
Table 19: Europe Wafer Glass Market Size & Forecast, by Wafer Type, Value (US$ Mn), 2017-2031
Table 20: Europe Wafer Glass Market Size & Forecast, by Wafer Type, Volume (Thousand Units), 2017-2031
Table 21: Europe Wafer Glass Market Size & Forecast, by Wafer Diameter, Value (US$ Mn), 2017-2031
Table 22: Europe Wafer Glass Market Size & Forecast, by Wafer Diameter, Volume (Thousand Units), 2017-2031
Table 23: Europe Wafer Glass Market Size & Forecast, by Application, Value (US$ Mn), 2017-2031
Table 24: Europe Wafer Glass Market Size & Forecast, by End-use, Value (US$ Mn), 2017-2031
Table 25: Europe Wafer Glass Market Size & Forecast, by Industry Vertical, Value (US$ Mn), 2017-2031
Table 26: Europe Wafer Glass Market Size & Forecast, by Country, Value (US$ Mn), 2017-2031
Table 27: Europe Wafer Glass Market Size & Forecast, by Country, Volume (Thousand Units), 2017-2031
Table 28: Asia Pacific Wafer Glass Market Size & Forecast, by Wafer Type, Value (US$ Mn), 2017-2031
Table 29: Asia Pacific Wafer Glass Market Size & Forecast, by Wafer Type, Volume (Thousand Units), 2017-2031
Table 30: Asia Pacific Wafer Glass Market Size & Forecast, by Wafer Diameter, Value (US$ Mn), 2017-2031
Table 31: Asia Pacific Wafer Glass Market Size & Forecast, by Wafer Diameter, Volume (Thousand Units), 2017-2031
Table 32: Asia Pacific Wafer Glass Market Size & Forecast, by Application, Value (US$ Mn), 2017-2031
Table 33: Asia Pacific Wafer Glass Market Size & Forecast, by End-use, Value (US$ Mn), 2017-2031
Table 34: Asia Pacific Wafer Glass Market Size & Forecast, by Industry Vertical, Value (US$ Mn), 2017-2031
Table 35: Asia Pacific Wafer Glass Market Size & Forecast, by Country, Value (US$ Mn), 2017-2031
Table 36: Asia Pacific Wafer Glass Market Size & Forecast, by Country, Volume (Thousand Units), 2017-2031
Table 37: Middle East & Africa Wafer Glass Market Size & Forecast, by Wafer Type, Value (US$ Mn), 2017-2031
Table 38: Middle East & Africa Wafer Glass Market Size & Forecast, by Wafer Type, Volume (Thousand Units), 2017-2031
Table 39: Middle East & Africa Wafer Glass Market Size & Forecast, by Wafer Diameter, Value (US$ Mn), 2017-2031
Table 40: Middle East & Africa Wafer Glass Market Size & Forecast, by Wafer Diameter, Volume (Thousand Units), 2017-2031
Table 41: Middle East & Africa Wafer Glass Market Size & Forecast, by Application, Value (US$ Mn), 2017-2031
Table 42: Middle East & Africa Wafer Glass Market Size & Forecast, by End-use, Value (US$ Mn), 2017-2031
Table 43: Middle East & Africa Wafer Glass Market Size & Forecast, by Industry Vertical, Value (US$ Mn), 2017-2031
Table 44: Middle East & Africa Wafer Glass Market Size & Forecast, by Country, Value (US$ Mn), 2017-2031
Table 45: Middle East & Africa Wafer Glass Market Size & Forecast, by Country, Volume (Thousand Units), 2017-2031
Table 46: South America Wafer Glass Market Size & Forecast, by Wafer Type, Value (US$ Mn), 2017-2031
Table 47: South America Wafer Glass Market Size & Forecast, by Wafer Type, Volume (Thousand Units), 2017-2031
Table 48: South America Wafer Glass Market Size & Forecast, by Wafer Diameter, Value (US$ Mn), 2017-2031
Table 49: South America Wafer Glass Market Size & Forecast, by Wafer Diameter, Volume (Thousand Units), 2017-2031
Table 50: South America Wafer Glass Market Size & Forecast, by Application, Value (US$ Mn), 2017-2031
Table 51: South America Wafer Glass Market Size & Forecast, by End-use, Value (US$ Mn), 2017-2031
Table 52: South America Wafer Glass Market Size & Forecast, by Industry Vertical, Value (US$ Mn), 2017-2031
Table 53: South America Wafer Glass Market Size & Forecast, by Country, Value (US$ Mn), 2017-2031
Table 54: South America Wafer Glass Market Size & Forecast, by Country, Volume (Thousand Units), 2017-2031
List of Figures
Figure 01: Global Wafer Glass Price Trend Analysis (Average Price per Product, Thousand US$)
Figure 02: Global Wafer Glass Market, Value (US$ Mn), 2017-2031
Figure 03: Global Wafer Glass Market, Volume (Thousand Units), 2017-2031
Figure 04: Global Wafer Glass Market Size & Forecast, by Wafer Type, Revenue (US$ Mn), 2017-2031
Figure 05: Global Wafer Glass Market Share Analysis, by Wafer Type, 2022 and 2031
Figure 06: Global Wafer Glass Market Attractiveness, By Wafer Type, Value (US$ Mn), 2022-2031
Figure 07: Global Wafer Glass Market Size & Forecast, by Wafer Diameter, Revenue (US$ Mn), 2017-2031
Figure 08: Global Wafer Glass Market Share Analysis, by Wafer Diameter, 2022 and 2031
Figure 09: Global Wafer Glass Market Attractiveness, By Wafer Diameter, Value (US$ Mn), 2022-2031
Figure 10: Global Wafer Glass Market Size & Forecast, by Application, Revenue (US$ Mn), 2017-2031
Figure 11: Global Wafer Glass Market Share Analysis, by Application, 2022 and 2031
Figure 12: Global Wafer Glass Market Attractiveness, By Application, Value (US$ Mn), 2022-2031
Figure 13: Global Wafer Glass Market Size & Forecast, by End-use, Revenue (US$ Mn), 2017-2031
Figure 14: Global Wafer Glass Market Share Analysis, by End-use, 2022 and 2031
Figure 15: Global Wafer Glass Market Attractiveness, By End-use, Value (US$ Mn), 2022-2031
Figure 16: Global Wafer Glass Market Size & Forecast, by Industry Vertical, Revenue (US$ Mn), 2017-2031
Figure 17: Global Wafer Glass Market Share Analysis, by Industry Vertical, 2022 and 2031
Figure 18: Global Wafer Glass Market Attractiveness, By Industry Vertical, Value (US$ Mn), 2022-2031
Figure 19: Global Wafer Glass Market Size & Forecast, by Region, Revenue (US$ Mn), 2017-2031
Figure 20: Global Wafer Glass Market Share Analysis, by Region, 2022 and 2031
Figure 21: Global Wafer Glass Market Attractiveness, By Region, Value (US$ Mn), 2022-2031
Figure 22: North America Wafer Glass Market, Value (US$ Mn), 2017-2031
Figure 23: North America Wafer Glass Market, Volume (Thousand Units), 2017-2031
Figure 24: North America Wafer Glass Market Size & Forecast, by Wafer Type, Revenue (US$ Mn), 2017-2031
Figure 25: North America Wafer Glass Market Share Analysis, by Wafer Type, 2022 and 2031
Figure 26: North America Wafer Glass Market Attractiveness, By Wafer Type, Value (US$ Mn), 2022-2031
Figure 27: North America Wafer Glass Market Size & Forecast, by Wafer Diameter, Revenue (US$ Mn), 2017-2031
Figure 28: North America Wafer Glass Market Share Analysis, by Wafer Diameter, 2022 and 2031
Figure 29: North America Wafer Glass Market Attractiveness, By Wafer Diameter, Value (US$ Mn), 2022-2031
Figure 30: North America Wafer Glass Market Size & Forecast, by Application, Revenue (US$ Mn), 2017-2031
Figure 31: North America Wafer Glass Market Share Analysis, by Application, 2022 and 2031
Figure 32: North America Wafer Glass Market Attractiveness, By Application, Value (US$ Mn), 2022-2031
Figure 33: North America Wafer Glass Market Size & Forecast, by End-use, Revenue (US$ Mn), 2017-2031
Figure 34: North America Wafer Glass Market Share Analysis, by End-use, 2022 and 2031
Figure 35: North America Wafer Glass Market Attractiveness, By End-use, Value (US$ Mn), 2022-2031
Figure 36: North America Wafer Glass Market Size & Forecast, by Industry Vertical, Revenue (US$ Mn), 2017-2031
Figure 37: North America Wafer Glass Market Share Analysis, by Industry Vertical, 2022 and 2031
Figure 38: North America Wafer Glass Market Attractiveness, By Industry Vertical, Value (US$ Mn), 2022-2031
Figure 39: North America Wafer Glass Market Size & Forecast, by Country, Revenue (US$ Mn), 2017-2031
Figure 40: North America Wafer Glass Market Share Analysis, by Country, 2022 and 2031
Figure 41: North America Wafer Glass Market Attractiveness, By Country, Value (US$ Mn), 2022-2031
Figure 42: Europe Wafer Glass Market, Value (US$ Mn), 2017-2031
Figure 43: Europe Wafer Glass Market, Volume (Thousand Units), 2017-2031
Figure 44: Europe Wafer Glass Market Size & Forecast, by Wafer Type, Revenue (US$ Mn), 2017-2031
Figure 45: Europe Wafer Glass Market Share Analysis, by Wafer Type, 2022 and 2031
Figure 46: Europe Wafer Glass Market Attractiveness, By Wafer Type, Value (US$ Mn), 2022-2031
Figure 47: Europe Wafer Glass Market Size & Forecast, by Wafer Diameter, Revenue (US$ Mn), 2017-2031
Figure 48: Europe Wafer Glass Market Share Analysis, by Wafer Diameter, 2022 and 2031
Figure 49: Europe Wafer Glass Market Attractiveness, By Wafer Diameter, Value (US$ Mn), 2022-2031
Figure 50: Europe Wafer Glass Market Size & Forecast, by Application, Revenue (US$ Mn), 2017-2031
Figure 51: Europe Wafer Glass Market Share Analysis, by Application, 2022 and 2031
Figure 52: Europe Wafer Glass Market Attractiveness, By Application, Value (US$ Mn), 2022-2031
Figure 53: Europe Wafer Glass Market Size & Forecast, by End-use, Revenue (US$ Mn), 2017-2031
Figure 54: Europe Wafer Glass Market Share Analysis, by End-use, 2022 and 2031
Figure 55: Europe Wafer Glass Market Attractiveness, By End-use, Value (US$ Mn), 2022-2031
Figure 56: Europe Wafer Glass Market Size & Forecast, by Industry Vertical, Revenue (US$ Mn), 2017-2031
Figure 57: Europe Wafer Glass Market Share Analysis, by Industry Vertical, 2022 and 2031
Figure 58: Europe Wafer Glass Market Attractiveness, By Industry Vertical, Value (US$ Mn), 2022-2031
Figure 59: Europe Wafer Glass Market Size & Forecast, by Country, Revenue (US$ Mn), 2017-2031
Figure 60: Europe Wafer Glass Market Share Analysis, by Country, 2022 and 2031
Figure 61: Europe Wafer Glass Market Attractiveness, By Country, Value (US$ Mn), 2022-2031
Figure 62: Asia Pacific Wafer Glass Market, Value (US$ Mn), 2017-2031
Figure 63: Asia Pacific Wafer Glass Market, Volume (Thousand Units), 2017-2031
Figure 64: Asia Pacific Wafer Glass Market Size & Forecast, by Wafer Type, Revenue (US$ Mn), 2017-2031
Figure 65: Asia Pacific Wafer Glass Market Share Analysis, by Wafer Type, 2022 and 2031
Figure 66: Asia Pacific Wafer Glass Market Attractiveness, By Wafer Type, Value (US$ Mn), 2022-2031
Figure 67: Asia Pacific Wafer Glass Market Size & Forecast, by Wafer Diameter, Revenue (US$ Mn), 2017-2031
Figure 68: Asia Pacific Wafer Glass Market Share Analysis, by Wafer Diameter, 2022 and 2031
Figure 69: Asia Pacific Wafer Glass Market Attractiveness, By Wafer Diameter, Value (US$ Mn), 2022-2031
Figure 70: Asia Pacific Wafer Glass Market Size & Forecast, by Application, Revenue (US$ Mn), 2017-2031
Figure 71: Asia Pacific Wafer Glass Market Share Analysis, by Application, 2022 and 2031
Figure 72: Asia Pacific Wafer Glass Market Attractiveness, By Application, Value (US$ Mn), 2022-2031
Figure 73: Asia Pacific Wafer Glass Market Size & Forecast, by End-use, Revenue (US$ Mn), 2017-2031
Figure 74: Asia Pacific Wafer Glass Market Share Analysis, by End-use, 2022 and 2031
Figure 75: Asia Pacific Wafer Glass Market Attractiveness, By End-use, Value (US$ Mn), 2022-2031
Figure 76: Asia Pacific Wafer Glass Market Size & Forecast, by Industry Vertical, Revenue (US$ Mn), 2017-2031
Figure 77: Asia Pacific Wafer Glass Market Share Analysis, by Industry Vertical, 2022 and 2031
Figure 78: Asia Pacific Wafer Glass Market Attractiveness, By Industry Vertical, Value (US$ Mn), 2022-2031
Figure 79: Asia Pacific Wafer Glass Market Size & Forecast, by Country, Revenue (US$ Mn), 2017-2031
Figure 80: Asia Pacific Wafer Glass Market Share Analysis, by Country, 2022 and 2031
Figure 81: Asia Pacific Wafer Glass Market Attractiveness, By Country, Value (US$ Mn), 2022-2031
Figure 82: Middle East & Africa Wafer Glass Market, Value (US$ Mn), 2017-2031
Figure 83: Middle East & Africa Wafer Glass Market, Volume (Thousand Units), 2017-2031
Figure 84: Middle East & Africa Wafer Glass Market Size & Forecast, by Wafer Type, Revenue (US$ Mn), 2017-2031
Figure 85: Middle East & Africa Wafer Glass Market Share Analysis, by Wafer Type, 2022 and 2031
Figure 86: Middle East & Africa Wafer Glass Market Attractiveness, By Wafer Type, Value (US$ Mn), 2022-2031
Figure 87: Middle East & Africa Wafer Glass Market Size & Forecast, by Wafer Diameter, Revenue (US$ Mn), 2017-2031
Figure 88: Middle East & Africa Wafer Glass Market Share Analysis, by Wafer Diameter, 2022 and 2031
Figure 89: Middle East & Africa Wafer Glass Market Attractiveness, By Wafer Diameter, Value (US$ Mn), 2022-2031
Figure 90: Middle East & Africa Wafer Glass Market Size & Forecast, by Application, Revenue (US$ Mn), 2017-2031
Figure 91: Middle East & Africa Wafer Glass Market Share Analysis, by Application, 2022 and 2031
Figure 92: Middle East & Africa Wafer Glass Market Attractiveness, By Application, Value (US$ Mn), 2022-2031
Figure 93: Middle East & Africa Wafer Glass Market Size & Forecast, by End-use, Revenue (US$ Mn), 2017-2031
Figure 94: Middle East & Africa Wafer Glass Market Share Analysis, by End-use, 2022 and 2031
Figure 95: Middle East & Africa Wafer Glass Market Attractiveness, By End-use, Value (US$ Mn), 2022-2031
Figure 96: Middle East & Africa Wafer Glass Market Size & Forecast, by Industry Vertical, Revenue (US$ Mn), 2017-2031
Figure 97: Middle East & Africa Wafer Glass Market Share Analysis, by Industry Vertical, 2022 and 2031
Figure 98: Middle East & Africa Wafer Glass Market Attractiveness, By Industry Vertical, Value (US$ Mn), 2022-2031
Figure 99: Middle East & Africa Wafer Glass Market Size & Forecast, by Country, Revenue (US$ Mn), 2017-2031
Figure 100: Middle East & Africa Wafer Glass Market Share Analysis, by Country, 2022 and 2031
Figure 101: Middle East & Africa Wafer Glass Market Attractiveness, By Country, Value (US$ Mn), 2022-2031
Figure 102: South America Wafer Glass Market, Value (US$ Mn), 2017-2031
Figure 103: South America Wafer Glass Market, Volume (Thousand Units), 2017-2031
Figure 104: South America Wafer Glass Market Size & Forecast, by Wafer Type, Revenue (US$ Mn), 2017-2031
Figure 105: South America Wafer Glass Market Share Analysis, by Wafer Type, 2022 and 2031
Figure 106: South America Wafer Glass Market Attractiveness, By Wafer Type, Value (US$ Mn), 2022-2031
Figure 107: South America Wafer Glass Market Size & Forecast, by Wafer Diameter, Revenue (US$ Mn), 2017-2031
Figure 108: South America Wafer Glass Market Share Analysis, by Wafer Diameter, 2022 and 2031
Figure 109: South America Wafer Glass Market Attractiveness, By Wafer Diameter, Value (US$ Mn), 2022-2031
Figure 110: South America Wafer Glass Market Size & Forecast, by Application, Revenue (US$ Mn), 2017-2031
Figure 111: South America Wafer Glass Market Share Analysis, by Application, 2022 and 2031
Figure 112: South America Wafer Glass Market Attractiveness, By Application, Value (US$ Mn), 2022-2031
Figure 113: South America Wafer Glass Market Size & Forecast, by End-use, Revenue (US$ Mn), 2017-2031
Figure 114: South America Wafer Glass Market Share Analysis, by End-use, 2022 and 2031
Figure 115: South America Wafer Glass Market Attractiveness, By End-use, Value (US$ Mn), 2022-2031
Figure 116: South America Wafer Glass Market Size & Forecast, by Industry Vertical, Revenue (US$ Mn), 2017-2031
Figure 117: South America Wafer Glass Market Share Analysis, by Industry Vertical, 2022 and 2031
Figure 118: South America Wafer Glass Market Attractiveness, By Industry Vertical, Value (US$ Mn), 2022-2031
Figure 119: South America Wafer Glass Market Size & Forecast, by Country, Revenue (US$ Mn), 2017-2031
Figure 120: South America Wafer Glass Market Share Analysis, by Country, 2022 and 2031
Figure 121: South America Wafer Glass Market Attractiveness, By Country, Value (US$ Mn), 2022-2031
Copyright © Transparency Market Research, Inc. All Rights reserved
Trust Online

Wafer Glass Market