
Reports
Reports
Global Virtual Fitting Room Market: Overview
Virtual fitting room, or VFR, refers to a technology that assists people in shopping on online platform by trying different types of clothes virtually. The technology is gathering traction as it does not require an individual to wear cloths but do this task virtually. Moreover, consumers can select from a wide range of options such as size, color, fitting, and style of cloth they want to purchase. Hardware, software, and services are some of the key components of the products and services from the global virtual fitting room market.
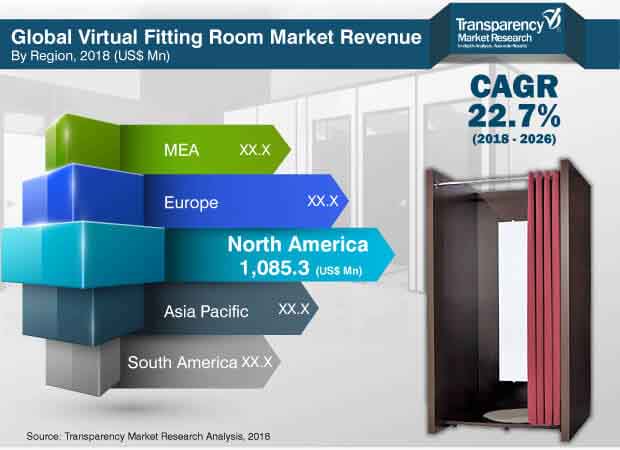
The global virtual fitting room market is expected to attract growth at a CAGR of 22.7% in the forecast period of 2018 to 2026. In 2017, the total valuation of the market was US$2,501.8 Mn.
The study on the global virtual fitting room market is presented in the forms of varied segments, which are decided based on component, software, services, end user, and region. On the basis of services, the market is divided into three parts, namely, integration, maintenance, and consulting.
Expansion of E-commerce Industry to Create Lucrative Prospects in Market for Virtual Fitting Room
Today, several ecommerce websites, apps, and physical stores around the world are enticing their customer base by offering technologically advanced experiences including VFR-enabled shopping facilities. The technique is rapidly being adopted by online shopping platforms owing to its ability to offer excellent user experience when customers are trying and selecting their cloths virtually. This factor is expected to create significant opportunities for companies operating in the global virtual fitting room market in the years ahead.
Many physical store owners across the globe are increasing the adoption of newer technologies such as virtual fitting room solutions. This factor, in turn, is likely to make the physical store as a dominant segment of the global virtual fitting room market in the forecast period 2018-2026.
Major technological advancements such as VR and AR are attracting end-users from different regions of the world to gain experience of virtual surroundings in varied applications. With an aim to expand their customer base, many retailers from different nations across the globe are using virtual fitting room solutions for a wide range of product categories including jewelry & watches, apparel, makeup, and eyewear. These activities are expected to drive the sales prospects in the virtual fitting room market in forecast period.
Surge in Use of Technologically Advanced Solutions Boosts Market Development
One of the prime factors boosting the growth prospects in the global virtual fitting room market is surge in the use of advanced solutions by enterprises in order to provide superior shopping experiences to their consumers around the world.
Companies from varied industrial sectors are experiencing the need for boosting their conversion rates as well as reducing the exchange and returns rates of their products. This factor is encouraging them to use advanced solutions offered by players from the virtual fitting room market.
Market to Observe Prominent Sales Opportunities from Retail Industry
Companies from the retail industry, particularly from the online shopping industry, generally experience high rates of product returns. Majority of times, one of the notable reasons for returning cloths is improper fitting. To deal with the issue, enterprises are increasing the use of virtual fitting room, which are gathering traction as computationally efficient technique of improving the way of online apparel shopping. Apart from this, companies from the retail industry are allotting substantial share of their spending on IT. These factors are expected to bode well with the expansion of the global virtual fitting room market in the upcoming years.
Increased Accessibility to Technology Creates Growth Opportunities in Market
Over the period of past few years, there is notable growth in the accessibility to varied smart technologies such as smart mirrors, high-quality integrated smartphone cameras, and high-definition lenses. This factor is likely to drive the demand opportunities in the global virtual fitting room market in the upcoming years. Moreover, increase in the penetration of the Internet across developed and developed nations around the world will help in the market expansion in the years to come.
Online Shopping Trend to Boost Demand Prospects on Market
With improving spending power of major populace from many developed as well as developing economies around the world, the trend of online shopping is at peak. Moreover, this trend is increasing among the millennial population globally. Apart from this, there is notable growth in the number of smartphone users around the world. These factors are supporting the expansion of the global virtual fitting room market.
Many online platforms are attracting their customers by providing striking offers on apparels. Furthermore, hectic lifestyle and shortage of time are some of the key factors that indirectly support the trend of online shopping, which in turn, is creating lucrative opportunities for virtual fitting room market.
North America and Europe: Lucrative Regions for Virtual Fitting Room Market Growth
Europe, North America, Middle East & Africa (MEA), South America, and Asia Pacific (APAC) are some of the prominent regions contributing to the growth of the global virtual fitting room market. Among all, North America and Europe are lucrative market for players providing virtual fitting room services. The market growth in these regions can be ascribed to many factors such as increase in acceptance of VFR enabled mobile applications and virtual fitting room solutions in many developed nations from North America and Europe.
In terms of revenue, North America holds a lion’s share of the global virtual fitting room market. Several factors impacting positively on the growth of the North America virtual fitting room market include high penetration of Internet-based services and increased adoption of advanced technologies in the region. Increase in inclination among populace from North America toward online shopping is boosting market growth. In recent years, several physical store retailers from the region are offering advanced solutions such as virtual fitting rooms in order to attract their customers.
Players in the virtual fitting room market are estimated to attract prominent sales prospects from the Asia Pacific region. Increase in usage of digital retailing options by regional populace is estimated to help in the Asia Pacific market expansion in the upcoming years. Moreover, swift digitalization across regional retail industry will bode well with the Asia Pacific virtual fitting room market.
Virtual Fitting Room Market: Competition Landscape
Some of the key players operating in the global virtual fitting room market are Visualook, Zugara, Inc., True Fit Corporation, Virtusize AB, Sizebay, Total Immersion, REACTIVE REALITY GMBH, Secret Sauce Partners Inc., Imaginate Technologies, Inc., Metail, Fitle, Fitnect Interactive, ELSE Corp srl, Fit Analytics, Coitor IT Tech, 3D-A-PORTER LTD, and Dressformer.
The presence of many players makes the competition levels in the global virtual fitting room market intense and pushes enterprises to come one step forward and execute organic as well as inorganic strategies to sustain in the market competition. New product launches, mergers, acquisitions, partnerships, collaborations, and regional expansions are some of the prominent strategies used by market players.
1. Preface
1.1. Market Scope
1.2. Market Segmentation
1.3. Key Research Objectives
2. Assumptions and Research Methodology
2.1. Market Taxonomy - Segment Definitions
2.2. Research Methodology
2.2.1. List of Primary and Secondary Sources
2.3. Key Assumptions for Data Modelling
3. Executive Summary: Global Virtual Fitting Room (VFR) Market
4. Market Overview
4.1. Introduction
4.2. Global Market – Macro Economic Factors Overview
4.2.1. World GDP Indicator – For Top 20 Economies
4.2.2. Global ICT Spending (US$ Mn), 2012, 2018, 2026
4.2.3. Key Regional Socio-Political-Technological Developments and their Impact Considerations
4.3. Technology/Product Roadmap
4.4. Customer Behavior Analysis : Online Vs. In-store Shopping
4.5. Trends in Retail Sector
4.5.1. Artificial Intelligence (AI)
4.5.2. Lifestyle Marketing
4.5.3. Personalization
4.6. Analysis : Technologies in Virtual Fitting Room (VFR) Market
4.6.1. 3D Body Scanning
4.6.2. Photo Accurate VFR
4.6.3. 3D Augmented Reality
4.7. Market Factor Analysis
4.7.1. Porter’s Five Forces Analysis
4.7.2. PESTEL Analysis
4.7.3. Value Chain Analysis
4.7.3.1. Key End User/Customers Analysis
4.7.3.2. Market Channel Development Trends
4.7.4. Market Dynamics (Growth Influencers)
4.7.4.1. Drivers
4.7.4.2. Restraints
4.7.4.3. Opportunities
4.7.4.4. Impact Analysis of Drivers & Restraints
4.7.4.5. Key Trends
4.8. Global Virtual Fitting Room (VFR) Market Analysis and Forecast, 2012 - 2026
4.8.1. Market Revenue Analysis (US$ Mn)
4.8.1.1. Historic Growth Trends, 2012-2017
4.8.1.2. Forecast Trends, 2018-2026
4.9. Market Attractiveness Analysis – By Region (Global/North America/Europe /Asia Pacific/Middle East & Africa/South America)
4.9.1. By Region/Country
4.9.2. By Component
4.9.3. By End-user
4.10. Market Outlook
4.11. Competitive Scenario and Trends
4.11.1. Virtual Fitting Room (VFR)Market Concentration Rate
4.11.1.1. List of New Entrants
4.11.2. Mergers & Acquisitions, Expansions
5. Global Virtual Fitting Room (VFR) Market Analysis and Forecasts, By Component
5.1. Introduction & Definitions
5.2. Market Size (US$ Mn) Forecast By Component, 2016-2026
5.2.1. Hardware
5.2.1.1. Pre-fabricated
5.2.1.2. Customized
5.2.1.2.1. Screen/Mirror
5.2.1.2.2. Other Sensors
5.2.2. Software
5.2.2.1. Firmware/Platform
5.2.2.2. Mobile Application
5.2.3. Services
5.2.3.1. Consulting
5.2.3.2. Integration
5.2.3.3. Maintenance
6. Global Virtual Fitting Room (VFR) Market Analysis and Forecasts, By End-user
6.1. Introduction & Definitions
6.2. Market Size (US$ Mn) Forecast By End-user, 2016-2026
6.2.1. E-commerce
6.2.2. Physical Store
6.2.2.1. Apparel
6.2.2.2. Jewelry and Watches
6.2.2.3. Eyewear
6.2.2.4. Others (Shoes, Accessories)
7. Global Virtual Fitting Room (VFR) Market Analysis and Forecast, by Region
7.1. Overview
7.2. Virtual Fitting Room (VFR) Market Size (US$ Mn) Forecast, by Region, 2016 - 2026
7.2.1. North America
7.2.2. Europe
7.2.3. Asia Pacific
7.2.4. Middle East & Africa
7.2.5. South America
8. North America Virtual Fitting Room (VFR) Market Analysis and Forecast
8.1. Key Findings
8.2. Key Trends Impact Analysis
8.3. Market Size (US$ Mn) Forecast By Component, 2016-2026
8.3.1. Hardware
8.3.1.1. Pre-fabricated
8.3.1.2. Customized
8.3.1.2.1. Screen/Mirror
8.3.1.2.2. Other Sensors
8.3.2. Software
8.3.2.1. Firmware/Platform
8.3.2.2. Mobile Application
8.3.3. Services
8.3.3.1. Consulting
8.3.3.2. Integration
8.3.3.3. Maintenance
8.4. Market Size (US$ Mn) Forecast By End-user, 2016-2026
8.4.1. E-commerce
8.4.2. Physical Store
8.4.2.1. Apparel
8.4.2.2. Jewelry and Watches
8.4.2.3. Eyewear
8.4.2.4. Others (Shoes, Accessories)
8.5. Virtual Fitting Room (VFR) Market Size (US$ Mn) Forecast, By Country and Region, 2016 - 2026
8.5.1. The U.S.
8.5.2. Canada
8.5.3. Rest ofNorth America
9. Europe Virtual Fitting Room (VFR) Market Analysis and Forecast
9.1. Key Findings
9.2. Key Trends Impact Analysis
9.3. Market Size (US$ Mn) Forecast By Component, 2016-2026
9.3.1. Hardware
9.3.1.1. Pre-fabricated
9.3.1.2. Customized
9.3.1.2.1. Screen/Mirror
9.3.1.2.2. Other Sensors
9.3.2. Software
9.3.2.1. Firmware/Platform
9.3.2.2. Mobile Application
9.3.3. Services
9.3.3.1. Consulting
9.3.3.2. Integration
9.3.3.3. Maintenance
9.4. Market Size (US$ Mn) Forecast By End-user, 2016-2026
9.4.1. E-commerce
9.4.2. Physical Store
9.4.2.1. Apparel
9.4.2.2. Jewelry and Watches
9.4.2.3. Eyewear
9.4.2.4. Others (Shoes, Accessories)
9.5. Virtual Fitting Room (VFR) Market Size (US$ Mn) Forecast, By Countryand Region, 2016 - 2026
9.5.1. Germany
9.5.2. France
9.5.3. UK
9.5.4. Rest of Europe
10. Asia PacificVirtual Fitting Room (VFR) Market Analysis and Forecast
10.1. Key Findings
10.2. Key Trends Impact Analysis
10.3. Market Size (US$ Mn) Forecast By Component, 2016-2026
10.3.1. Hardware
10.3.1.1. Pre-fabricated
10.3.1.2. Customized
10.3.1.2.1. Screen/Mirror
10.3.1.2.2. Other Sensors
10.3.2. Software
10.3.2.1. Firmware/Platform
10.3.2.2. Mobile Application
10.3.3. Services
10.3.3.1. Consulting
10.3.3.2. Integration
10.3.3.3. Maintenance
10.4. Market Size (US$ Mn) Forecast By End-user, 2016-2026
10.4.1. E-commerce
10.4.2. Physical Store
10.4.2.1. Apparel
10.4.2.2. Jewelry and Watches
10.4.2.3. Eyewear
10.4.2.4. Others (Shoes, Accessories)
10.5. Virtual Fitting Room (VFR) Market Size (US$ Mn) Forecast, By Countryand Region, 2016 - 2026
10.5.1. China
10.5.2. Japan
10.5.3. India
10.5.4. Rest of Asia Pacific
11. Middle East &Africa (MEA) Virtual Fitting Room (VFR) Market Analysis and Forecast
11.1. Key Findings
11.2. Key Trends Impact Analysis
11.3. Market Size (US$ Mn) Forecast By Component, 2016-2026
11.3.1. Hardware
11.3.1.1. Pre-fabricated
11.3.1.2. Customized
11.3.1.2.1. Screen/Mirror
11.3.1.2.2. Other Sensors
11.3.2. Software
11.3.2.1. Firmware/Platform
11.3.2.2. Mobile Application
11.3.3. Services
11.3.3.1. Consulting
11.3.3.2. Integration
11.3.3.3. Maintenance
11.4. Market Size (US$ Mn) Forecast By End-user, 2016-2026
11.4.1. E-commerce
11.4.2. Physical Store
11.4.2.1. Apparel
11.4.2.2. Jewelry and Watches
11.4.2.3. Eyewear
11.4.2.4. Others (Shoes, Accessories)
11.5. Virtual Fitting Room (VFR) Market Size (US$ Mn) Forecast, By Countryand Region, 2016 - 2026
11.5.1. GCC
11.5.2. South Africa
11.5.3. Rest ofMEA
12. South America Virtual Fitting Room (VFR) Market Analysis and Forecast
12.1. Key Findings
12.2. Key Trends Impact Analysis
12.3. Market Size (US$ Mn) Forecast By Component, 2016-2026
12.3.1. Hardware
12.3.1.1. Pre-fabricated
12.3.1.2. Customized
12.3.1.2.1. Screen/Mirror
12.3.1.2.2. Other Sensors
12.3.2. Software
12.3.2.1. Firmware/Platform
12.3.2.2. Mobile Application
12.3.3. Services
12.3.3.1. Consulting
12.3.3.2. Integration
12.3.3.3. Maintenance
12.4. Market Size (US$ Mn) Forecast By End-user, 2016-2026
12.4.1. E-commerce
12.4.2. Physical Store
12.4.2.1. Apparel
12.4.2.2. Jewelry and Watches
12.4.2.3. Eyewear
12.4.2.4. Others (Shoes, Accessories)
12.5. Virtual Fitting Room (VFR) Market Size (US$ Mn) Forecast, By Countryand Region, 2016 - 2026
12.5.1. Brazil
12.5.2. Rest of South America
13. Competition Landscape
13.1. Market Player – Competition Matrix
13.2. Market Revenue Share Analysis (%), By Company (2017)
13.3. Regional Presence (Intensity Map)
14. Company Profiles(Details – Business Overview, Sales Area/Geographical Presence, Revenue, Recent Developments and Strategy)
14.1. 3D-A-PORTER LTD.
14.1.1. Business Overview
14.1.2. Sales Area/Geographical Presence
14.1.3. Revenue
14.1.4. Recent Developments and Strategy
14.2. Coitor IT Tech
14.2.1. Business Overview
14.2.2. Sales Area/Geographical Presence
14.2.3. Revenue
14.2.4. Recent Developments and Strategy
14.3. Dressformer
14.3.1. Business Overview
14.3.2. Sales Area/Geographical Presence
14.3.3. Revenue
14.3.4. Recent Developments and Strategy
14.4. ELSE Corp srl
14.4.1. Business Overview
14.4.2. Sales Area/Geographical Presence
14.4.3. Revenue
14.4.4. Recent Developments and Strategy
14.5. Fit Analytics
14.5.1. Business Overview
14.5.2. Sales Area/Geographical Presence
14.5.3. Revenue
14.5.4. Recent Developments and Strategy
14.6. Fitle
14.6.1. Business Overview
14.6.2. Sales Area/Geographical Presence
14.6.3. Revenue
14.6.4. Recent Developments and Strategy
14.7. Fitnect Interactive
14.7.1. Business Overview
14.7.2. Sales Area/Geographical Presence
14.7.3. Revenue
14.7.4. Recent Developments and Strategy
14.8. Imaginate Technologies, Inc.
14.8.1. Business Overview
14.8.2. Sales Area/Geographical Presence
14.8.3. Revenue
14.8.4. Recent Developments and Strategy
14.9. Metail
14.9.1. Business Overview
14.9.2. Sales Area/Geographical Presence
14.9.3. Revenue
14.9.4. Recent Developments and Strategy
14.10. REACTIVE REALITY GMBH
14.10.1. Business Overview
14.10.2. Sales Area/Geographical Presence
14.10.3. Revenue
14.10.4. Recent Developments and Strategy
14.11. Secret Sauce Partners Inc.
14.11.1. Business Overview
14.11.2. Sales Area/Geographical Presence
14.11.3. Revenue
14.11.4. Recent Developments and Strategy
14.12. Sizebay
14.12.1. Business Overview
14.12.2. Sales Area/Geographical Presence
14.12.3. Revenue
14.12.4. Recent Developments and Strategy
14.13. Total Immersion
14.13.1. Business Overview
14.13.2. Sales Area/Geographical Presence
14.13.3. Revenue
14.13.4. Recent Developments and Strategy
14.14. True Fit Corporation
14.14.1. Business Overview
14.14.2. Sales Area/Geographical Presence
14.14.3. Revenue
14.14.4. Recent Developments and Strategy
14.15. Virtusize AB
14.15.1. Business Overview
14.15.2. Sales Area/Geographical Presence
14.15.3. Revenue
14.15.4. Recent Developments and Strategy
14.16. Visualook
14.16.1. Business Overview
14.16.2. Sales Area/Geographical Presence
14.16.3. Revenue
14.16.4. Recent Developments and Strategy
14.17. Zugara, Inc.
14.17.1. Business Overview
14.17.2. Sales Area/Geographical Presence
14.17.3. Revenue
14.17.4. Recent Developments and Strategy
15. Key Takeaways
List of Tables
Table 1: North America ICT Spending (US$ Mn)
Table 2: Europe ICT Spending (US$ Mn)
Table 3: Asia Pacific ICT Spending (US$ Mn)
Table 4: MEA ICT Spending (US$ Mn)
Table 5: South America ICT Spending (US$ Mn)
Table 6 Mergers & Acquisitions, Expansions
Table 7 New Entrants
Table 8: Global Virtual Fitting Room Market Size (US$ Mn) Forecast, by Component, 2016 – 2026
Table 9: Global Virtual Fitting Room Market Size (US$ Mn) Forecast, by Component, by Hardware, 2016 – 2026
Table 10: Global Virtual Fitting Room Market Size (US$ Mn) Forecast, by Component, by Software, 2016 – 2026
Table11: Global Virtual Fitting Room Market Size (US$ Mn) Forecast, by Component, by Services, 2016 – 2026
Table12: Global Virtual Fitting Room Market Size (US$ Mn) Forecast, by End-user, 2016 – 2026
Table13: Global Virtual Fitting Room Market Size (US$ Mn) Forecast, by Region, 2016 – 2026
Table14: North America Virtual Fitting Room Market Size (US$ Mn) Forecast, by Component, 2016 – 2026
Table15: North America Virtual Fitting Room Market Size (US$ Mn) Forecast, by Component, by Hardware, 2016 – 2026
Table 16: North America Virtual Fitting Room Market Size (US$ Mn) Forecast, by Component, by Software, 2016 – 2026
Table 17: North America Virtual Fitting Room Market Size (US$ Mn) Forecast, by Component, by Services, 2016 – 2026
Table 18: North America Virtual Fitting Room Market Size (US$ Mn) Forecast, by End-user, 2016 – 2026
Table 19: North America Virtual Fitting Room Market Size (US$ Mn) Forecast, by Region/Country, 2016 – 2026
Table20: Europe Virtual Fitting Room Market Size (US$ Mn) Forecast, by Component, 2016 – 2026
Table 21: Europe Virtual Fitting Room Market Size (US$ Mn) Forecast, by Component, by Hardware, 2016 – 2026
Table 22: Europe Virtual Fitting Room Market Size (US$ Mn) Forecast, by Component, by Software, 2016 – 2026
Table 23: Europe Virtual Fitting Room Market Size (US$ Mn) Forecast, by Component, by Services, 2016 – 2026
Table 24: Europe Virtual Fitting Room Market Size (US$ Mn) Forecast, by End-user, 2016 – 2026
Table 25: Europe Virtual Fitting Room Market Size (US$ Mn) Forecast, by Region/Country, 2016 – 2026
Table 26: Asia Pacific Virtual Fitting Room Market Size (US$ Mn) Forecast, by Component, 2016 – 2026
Table 27: Asia Pacific Virtual Fitting Room Market Size (US$ Mn) Forecast, by Component, by Hardware, 2016 – 2026
Table 28: Asia Pacific Virtual Fitting Room Market Size (US$ Mn) Forecast, by Component, by Software, 2016 – 2026
Table29: Asia Pacific Virtual Fitting Room Market Size (US$ Mn) Forecast, by Component, by Services, 2016 – 2026
Table 30: Asia Pacific Virtual Fitting Room Market Size (US$ Mn) Forecast, by End-user, 2016 – 2026
Table 31: Asia Pacific Virtual Fitting Room Market Size (US$ Mn) Forecast, by Region/Country, 2016 – 2026
Table 32: MEA Virtual Fitting Room Market Size (US$ Mn) Forecast, by Component, 2016 – 2026
Table 33: MEA Virtual Fitting Room Market Size (US$ Mn) Forecast, by Component, by Hardware, 2016 – 2026
Table 34: MEA Virtual Fitting Room Market Size (US$ Mn) Forecast, by Component, by Software, 2016 – 2026
Table 35: MEA Virtual Fitting Room Market Size (US$ Mn) Forecast, by Component, by Services, 2016 – 2026
Table 36: MEA Virtual Fitting Room Market Size (US$ Mn) Forecast, by End-user, 2016 – 2026
Table 37: MEA Virtual Fitting Room Market Size (US$ Mn) Forecast, by Region/Country, 2016 – 2026
Table 38: South America Virtual Fitting Room Market Size (US$ Mn) Forecast, by Component, 2016 – 2026
Table 39: South America Virtual Fitting Room Market Size (US$ Mn) Forecast, by Component, by Hardware, 2016 – 2026
Table 40: South America Virtual Fitting Room Market Size (US$ Mn) Forecast, by Component, by Software, 2016 – 2026
Table 41: South America Virtual Fitting Room Market Size (US$ Mn) Forecast, by Component, by Services, 2016 – 2026
Table 42: South America Virtual Fitting Room Market Size (US$ Mn) Forecast, by End-user, 2016 – 2026
Table 43: South America Virtual Fitting Room Market Size (US$ Mn) Forecast, by Region/Country, 2016 – 2026
List of Figures
Figure 1 Global Virtual Fitting Room Market, Fastest Growing Region, CAGR (%)
Figure 2 Global Virtual Fitting Room Market Size (US$ Mn) Forecast, 2016–2026
Figure 3 In-Store Shopping Vs. Online Shopping, 2017
Figure 4 Mobile Vs. Desktop Online Shopping Daily
Figure 5 Historic growth trends, 2012-2017 (US$ Mn)
Figure 6 Forecast trends, 2018-2026 (US$ Mn)
Figure 7 Global Virtual Fitting Room Market Attractiveness Analysis, by Component
Figure 8 Global Virtual Fitting Room Market Attractiveness Analysis, by End-user
Figure 9 Global Virtual Fitting Room Market Attractiveness Analysis, by Region
Figure 10 Global Virtual Fitting Room Market Revenue (US$ Mn) and Y-o-Y Forecast, 2016 – 2026
Figure 11 Global Virtual Fitting Room Market Opportunity Growth Analysis (US$ Mn) Forecast, 2016 – 2026
Figure 12 Global Virtual Fitting Room Market Share Analysis, by Component (2018)
Figure 13 Global Virtual Fitting Room Market Share Analysis, by Component (2026)
Figure 14 Global Virtual Fitting Room Market Share Analysis, by Hardware (2018)
Figure 15 Global Virtual Fitting Room Market Share Analysis, by Hardware (2026)
Figure 16 Global Virtual Fitting Room Market Share Analysis, by Hardware, by Customized (2018)
Figure 17 Global Virtual Fitting Room Market Share Analysis, by Hardware, by Customized (2026)
Figure 18 Global Virtual Fitting Room Market Share Analysis, by Software (2018)
Figure 19 Global Virtual Fitting Room Market Share Analysis, by Software (2026)
Figure 20 Global Virtual Fitting Room Market Share Analysis, by Services, (2018)
Figure 21 Global Virtual Fitting Room Market Share Analysis, by Services, (2026)
Figure 22 Global Virtual Fitting Room Market Share Analysis, by End-user (2018)
Figure 23 Global Virtual Fitting Room Market Share Analysis, by End-user (2026)
Figure 24 Global Virtual Fitting Room Market Share Analysis, by End-user, by Physical Store (2018)
Figure 25 Global Virtual Fitting Room Market Share Analysis, by End-user, by Physical Store (2026)
Figure 26 Global Virtual Fitting Room Market Share Analysis, by Region (2018)
Figure 27 Global Virtual Fitting Room Market Share Analysis, by Region (2026)
Figure 28: North America Virtual Fitting Room Market Share Analysis, by Component (2018)
Figure 29: North America Virtual Fitting Room Market Share Analysis, by Component (2026)
Figure 30: North America Virtual Fitting Room Market Share Analysis, by Hardware (2018)
Figure 31: North America Virtual Fitting Room Market Share Analysis, by Hardware (2026)
Figure 32: North America Virtual Fitting Room Market Share Analysis, by Hardware, by Customized (2018)
Figure 33: North America Virtual Fitting Room Market Share Analysis, by Hardware, by Customized (2026)
Figure 34: North America Virtual Fitting Room Market Share Analysis, by Software (2018)
Figure 35: North America Virtual Fitting Room Market Share Analysis, by Software (2026)
Figure 36: North America Virtual Fitting Room Market Share Analysis, by Services, (2018)
Figure 37: North America Virtual Fitting Room Market Share Analysis, by Services, (2026)
Figure 38: North America Virtual Fitting Room Market Share Analysis, by End-user (2018)
Figure 39: North America Virtual Fitting Room Market Share Analysis, by End-user (2026)
Figure 40: North America Virtual Fitting Room Market Share Analysis, by End-user, by Physical Store (2018)
Figure 41: North America Virtual Fitting Room Market Share Analysis, by End-user, by Physical Store (2026)
Figure 42: North America Virtual Fitting Room Market Share Analysis, by Region/Country (2018)
Figure 43: North America Virtual Fitting Room Market Share Analysis, by Region/Country (2026)
Figure44: Europe Virtual Fitting Room Market Share Analysis, by Component (2018)
Figure45: Europe Virtual Fitting Room Market Share Analysis, by Component (2026)
Figure46: Europe Virtual Fitting Room Market Share Analysis, by Hardware (2018)
Figure47: Europe Virtual Fitting Room Market Share Analysis, by Hardware (2026)
Figure48: Europe Virtual Fitting Room Market Share Analysis, by Hardware, by Customized (2018)
Figure49: Europe Virtual Fitting Room Market Share Analysis, by Hardware, by Customized (2026)
Figure50: Europe Virtual Fitting Room Market Share Analysis, by Software (2018)
Figure51: Europe Virtual Fitting Room Market Share Analysis, by Software (2026)
Figure52: Europe Virtual Fitting Room Market Share Analysis, by Services, (2018)
Figure53: Europe Virtual Fitting Room Market Share Analysis, by Services, (2026)
Figure54: Europe Virtual Fitting Room Market Share Analysis, by End-user (2018)
Figure55: Europe Virtual Fitting Room Market Share Analysis, by End-user (2026)
Figure56: Europe Virtual Fitting Room Market Share Analysis, by End-user, by Physical Store (2018)
Figure57: Europe Virtual Fitting Room Market Share Analysis, by End-user, by Physical Store (2026)
Figure58: Europe Virtual Fitting Room Market Share Analysis, by Region/Country (2018)
Figure59: Europe Virtual Fitting Room Market Share Analysis, by Region/Country (2026)
Figure60: Asia Pacific Virtual Fitting Room Market Share Analysis, by Component (2018)
Figure61: Asia Pacific Virtual Fitting Room Market Share Analysis, by Component (2026)
Figure62: Asia Pacific Virtual Fitting Room Market Share Analysis, by Hardware (2018)
Figure63: Asia Pacific Virtual Fitting Room Market Share Analysis, by Hardware (2026)
Figure64: Asia Pacific Virtual Fitting Room Market Share Analysis, by Hardware, by Customized (2018)
Figure65: Asia Pacific Virtual Fitting Room Market Share Analysis, by Hardware, by Customized (2026)
Figure66: Asia Pacific Virtual Fitting Room Market Share Analysis, by Software (2018)
Figure67: Asia Pacific Virtual Fitting Room Market Share Analysis, by Software (2026)
Figure68: Asia Pacific Virtual Fitting Room Market Share Analysis, by Services, (2018)
Figure69: Asia Pacific Virtual Fitting Room Market Share Analysis, by Services, (2026)
Figure70: Asia Pacific Virtual Fitting Room Market Share Analysis, by End-user (2018)
Figure71: Asia Pacific Virtual Fitting Room Market Share Analysis, by End-user (2026)
Figure72: Asia Pacific Virtual Fitting Room Market Share Analysis, by End-user, by Physical Store (2018)
Figure73: Asia Pacific Virtual Fitting Room Market Share Analysis, by End-user, by Physical Store (2026)
Figure74: Asia Pacific Virtual Fitting Room Market Share Analysis, by Region/Country (2018)
Figure75: Asia Pacific Virtual Fitting Room Market Share Analysis, by Region/Country (2026)
Figure 76: MEA Virtual Fitting Room Market Share Analysis, by Component (2018)
Figure 77: MEA Virtual Fitting Room Market Share Analysis, by Component (2026)
Figure 78: MEA Virtual Fitting Room Market Share Analysis, by Hardware (2018)
Figure 79: MEA Virtual Fitting Room Market Share Analysis, by Hardware (2026)
Figure 80: MEA Virtual Fitting Room Market Share Analysis, by Hardware, by Customized (2018)
Figure 81: MEA Virtual Fitting Room Market Share Analysis, by Hardware, by Customized (2026)
Figure 82: MEA Virtual Fitting Room Market Share Analysis, by Software (2018)
Figure 83: MEA Virtual Fitting Room Market Share Analysis, by Software (2026)
Figure 84: MEA Virtual Fitting Room Market Share Analysis, by Services, (2018)
Figure 85: MEA Virtual Fitting Room Market Share Analysis, by Services, (2026)
Figure 86: MEA Virtual Fitting Room Market Share Analysis, by End-user (2018)
Figure 87: MEA Virtual Fitting Room Market Share Analysis, by End-user (2026)
Figure 88: MEA Virtual Fitting Room Market Share Analysis, by End-user, by Physical Store (2018)
Figure 89: MEA Virtual Fitting Room Market Share Analysis, by End-user, by Physical Store (2026)
Figure 90: MEA Virtual Fitting Room Market Share Analysis, by Region/Country (2018)
Figure 91: MEA Virtual Fitting Room Market Share Analysis, by Region/Country (2026)
Figure 92: South America Virtual Fitting Room Market Share Analysis, by Component (2018)
Figure 93: South America Virtual Fitting Room Market Share Analysis, by Component (2026)
Figure 94: South America Virtual Fitting Room Market Share Analysis, by Hardware (2018)
Figure 95: South America Virtual Fitting Room Market Share Analysis, by Hardware (2026)
Figure 96: South America Virtual Fitting Room Market Share Analysis, by Hardware, by Customized (2018)
Figure 97: South America Virtual Fitting Room Market Share Analysis, by Hardware, by Customized (2026)
Figure 98: South America Virtual Fitting Room Market Share Analysis, by Software (2018)
Figure 99: South America Virtual Fitting Room Market Share Analysis, by Software (2026)
Figure 100: South America Virtual Fitting Room Market Share Analysis, by Services, (2018)
Figure 101: South America Virtual Fitting Room Market Share Analysis, by Services, (2026)
Figure 102: South America Virtual Fitting Room Market Share Analysis, by End-user (2018)
Figure 103: South America Virtual Fitting Room Market Share Analysis, by End-user (2026)
Figure 104: South America Virtual Fitting Room Market Share Analysis, by End-user, by Physical Store (2018)
Figure 105: South America Virtual Fitting Room Market Share Analysis, by End-user, by Physical Store (2026)
Figure 106: South America Virtual Fitting Room Market Share Analysis, by Region/Country (2018)
Figure 107: South America Virtual Fitting Room Market Share Analysis, by Region/Country (2026)
Copyright © Transparency Market Research, Inc. All Rights reserved
Trust Online

Virtual Fitting Room Market