
Reports
Reports
Video Live Streaming Solutions Market - Snapshot
Video live streaming is a type of solution in which the user can select and view live video content. Video live provides the user access to a wide range of live digital content such as sports, concerts, events, and more. Video live streaming solutions offer reliability, efficiency, and cost-effectiveness for media streaming on any screen across a vast range of industries and streaming types. Growing adoption of online multimedia content is one the major reasons for viewers moving toward multi-screen services. Consumers prefer video live streaming solutions due to high-speed network access and availability of connecting multiple devices, such as tablets and smartphones. Furthermore, live video service providers have an opportunity to enhance their video delivery platforms and to provide cross-screen services through the support of extended devices. With advancements in broadband services, data access for streaming live videos have increased greatly, enabling viewers to experience improved video quality without any lag in real time. This helps video service providers to deliver streaming services through mobile phone networks and terrestrial television stations. Introduction of several streaming media devices such as Google Chromecast (Google Inc.), Apple TV (Apple TV), Slingbox (Sling Media), NVidia Shield (NVIDIA Corporation), and Fire TV (Amazon Inc.), has transformed the viewing experience across mobile devices such as smartphones, tablets, and laptops to a great extent. Increasing use of mobile TV services is also anticipated to have a significant impact on video live streaming solutions. Moreover, growing number of viewers is also creating opportunity for the live video streaming solutions market. Nowadays, increase in live video streaming options where viewers can stream live content from an online source is generating wide ranging opportunities for consumers who have better control over when they watch, what they watch, and how they watch their favorite content.
The global video live streaming solutions market has been segmented in terms of component, software solutions, industry, and region. In terms of component, the market has been segmented into software and services. The software market is further divided into on-premise and cloud. The cloud segment is classified into public cloud, private cloud, and hybrid cloud. The services segment is also divided into professional and managed services. Based on software solutions, the market has been segmented into editing and transcoding, delivery and distribution, analytics, video security, publishing, captioning, and archiving. On the basis of industry, the market is divided into education; government; media and entertainment; gaming; retail; banking, financial services and insurance; healthcare; and others. Geographically, the market has been segmented into North America, Europe, Asia Pacific, Middle East & Africa, and South America.
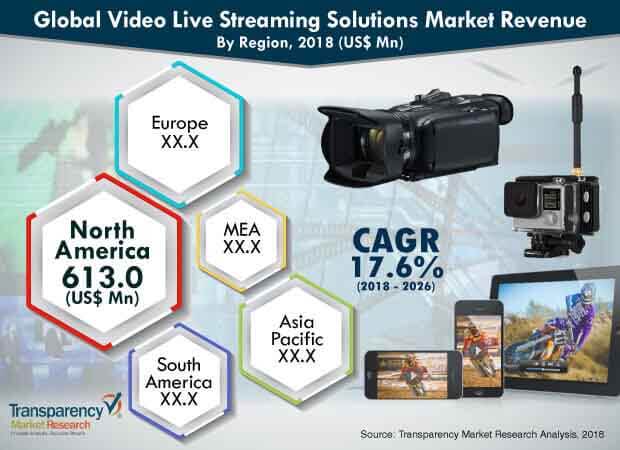
The North America region is dominant in the adoption of video live streaming solutions. This is due to the increasing availability of live content and their adoption across the region. It has a high penetration rate for video live streaming solutions due to its large subscriber base connected through multiple platforms. The market is in the emerging stage in the regions of Asia Pacific (APAC), Latin America, and Middle East & Africa (MEA). Video live streaming solution providers have been expanding their presence in South America by collaborating with local content producers and live video service providers. Furthermore, with increasing access to live video services through smartphones and tablets, service providers are focusing on developing efficient mobile applications to deliver digital content. Asia Pacific is anticipated to witness significant growth primarily due to the rising penetration of smartphones and the development of high-speed network systems across the region.
This report on the global video live streaming solutions market offers revenue share analysis of several vital participants. Some of the key players profiled in the report include IBM Corporation, DigiVive Services Pvt. Ltd., Haivision, Inc., Qumu Corporation, Contus Support Interactive Pvt. Ltd., Sonic Foundry Inc., Telestream, LLC, Wowza Media Systems, LLC, Livestream LLC, and Ooyala, Inc.
1. Preface
1.1. Market Scope
1.2. Market Segmentation
1.3. Key Research Objectives
2. Assumptions and Research Methodology
2.1. Market Taxonomy - Segment Definitions
2.2. Research Methodology
2.2.1. List of Primary and Secondary Sources
2.3. Key Assumptions for Data Modelling
3. Executive Summary: Global Video Live Streaming Solutions Market
4. Market Overview
4.1. Introduction
4.2. Global Market – Macro Economic Factors Overview
4.2.1. World GDP Indicator – For Top 20 Economies
4.2.2. Global ICT Spending (US$ Mn), 2012, 2018, 2026
4.2.3. Key Regional Socio-Political-Technological Developments and Their Impact Considerations
4.3. Technology/Product Roadmap
4.4. Market Dynamics (Growth Influencers)
4.4.1. Drivers
4.4.2. Restraints
4.4.3. Opportunities
4.5. Global Video Live Streaming Solutions Market Analysis and Forecast, 2012 - 2026
4.5.1. Market Revenue Analysis (US$ Mn)
4.5.1.1. Historic Growth Trends, 2012-2017
4.5.1.2. Forecast Trends, 2017-2026
4.6. Market Attractiveness Analysis– By Region/Country (Global/North America/Europe/Asia Pacific/Middle East & Africa/South America)
4.6.1. By Region/Country
4.6.2. By Component
4.6.3. By End-users
4.7. Market Outlook
4.8. Analysis of Video Live Streaming Solutions Market – By Solution
4.8.1. Editing and Transcoding
4.8.2. Delivery and Distribution
4.8.3. Analytics
4.8.4. Video Security
4.8.5. Publishing
4.8.6. Captioning
4.8.7. Archiving
4.9. Pricing Trend Analysis
4.10. Competitive Scenario and Trends
4.10.1. Video Live Streaming Solutions Market Concentration Rate
4.10.1.1.List of New Entrants
4.10.2. Mergers & Acquisitions, Expansions
5. Global Video Live Streaming Solutions Market Analysis and Forecast, By Component
5.1. Overview & Definitions
5.2. Video Live Streaming Solutions Market Size (US$ Mn) Forecast, By Component, 2016 - 2026
5.2.1. Software
5.2.1.1. On-Premise
5.2.1.2. Cloud
5.2.1.2.1. Public
5.2.1.2.2. Private
5.2.1.2.3. Hybrid
5.2.2. By Services
5.2.2.1. Professional Services
5.2.2.2. Managed Services
6. Global Video Live Streaming Solutions Market Analysis and Forecast, By End-users
6.1. Overview & Definitions
6.2. Video Live Streaming Solutions Market Size (US$ Mn) Forecast, By End-users, 2016 - 2026
6.2.1. BFSI
6.2.2. Government
6.2.3. Media & Entertainment
6.2.4. Education
6.2.5. Healthcare
6.2.6. Gaming
6.2.7. Others (Hospitality etc.)
7. Global Video Live Streaming Solutions Market Analysis and Forecast, by Region
7.1. Overview
7.2. Video Live Streaming Solutions Market Size (US$ Mn) Forecast, by Region, 2016 - 2026
7.2.1. North America
7.2.2. Europe
7.2.3. Asia Pacific
7.2.4. Middle East & Africa
7.2.5. South America
8. North America Video Live Streaming Solutions Market Analysis and Forecast
8.1. Key Findings
8.2. Video Live Streaming Solutions Market Size (US$ Mn) Forecast, By Component, 2016 - 2026
8.2.1. Software
8.2.1.1. On-Premise
8.2.1.2. Cloud
8.2.1.2.1. Public
8.2.1.2.2. Private
8.2.1.2.3. Hybrid
8.2.2. By Services
8.2.2.1. Professional Services
8.2.2.2. Managed Services
8.3. Video Live Streaming Solutions Market Size (US$ Mn) Forecast, By End-users, 2016 - 2026
8.3.1. BFSI
8.3.2. Government
8.3.3. Media & Entertainment
8.3.4. Education
8.3.5. Healthcare
8.3.6. Gaming
8.3.7. Others (Hospitality etc.)
8.4. Video Live Streaming Solutions Market Size (US$ Mn) Forecast, By Country and Region, 2016 - 2026
8.4.1. The U.S.
8.4.2. Canada
8.4.3. Rest of North America
9. Europe Video Live Streaming Solutions Market Analysis and Forecast
9.1. Key Findings
9.2. Video Live Streaming Solutions Market Size (US$ Mn) Forecast, By Component, 2016 - 2026
9.2.1. Software
9.2.1.1. On-Premise
9.2.1.2. Cloud
9.2.1.2.1. Public
9.2.1.2.2. Private
9.2.1.2.3. Hybrid
9.2.2. By Services
9.2.2.1. Professional Services
9.2.2.2. Managed Services
9.3. Video Live Streaming Solutions Market Size (US$ Mn) Forecast, By End-users, 2016 - 2026
9.3.1. BFSI
9.3.2. Government
9.3.3. Media & Entertainment
9.3.4. Education
9.3.5. Healthcare
9.3.6. Gaming
9.3.7. Others (Hospitality etc.)
9.4. Video Live Streaming Solutions Market Size (US$ Mn) Forecast, By Country and Region, 2016 - 2026
9.4.1. Germany
9.4.2. France
9.4.3. UK
9.4.4. Rest of Europe
10. Asia Pacific Video Live Streaming Solutions Market Analysis and Forecast
10.1. Key Findings
10.2. Video Live Streaming Solutions Market Size (US$ Mn) Forecast, By Component, 2016 - 2026
10.2.1. Software
10.2.1.1.On-Premise
10.2.1.2.Cloud
10.2.1.2.1.Public
10.2.1.2.2.Private
10.2.1.2.3.Hybrid
10.2.2. By Services
10.2.2.1.Professional Services
10.2.2.2.Managed Services
10.3. Video Live Streaming Solutions Market Size (US$ Mn) Forecast, By End-users, 2016 - 2026
10.3.1. BFSI
10.3.2. Government
10.3.3. Media & Entertainment
10.3.4. Education
10.3.5. Healthcare
10.3.6. Gaming
10.3.7. Others (Hospitality etc.)
10.4. Video Live Streaming Solutions Market Size (US$ Mn) Forecast, By Country and Region, 2016 - 2026
10.4.1. China
10.4.2. Japan
10.4.3. India
10.4.4. Rest of Asia Pacific
11. Middle East & Africa (MEA) Video Live Streaming Solutions Market Analysis and Forecast
11.1. Key Findings
11.2. Video Live Streaming Solutions Market Size (US$ Mn) Forecast, By Component, 2016 - 2026
11.2.1. Software
11.2.1.1.On-Premise
11.2.1.2.Cloud
11.2.1.2.1.Public
11.2.1.2.2.Private
11.2.1.2.3.Hybrid
11.2.2. By Services
11.2.2.1.Professional Services
11.2.2.2.Managed Services
11.3. Video Live Streaming Solutions Market Size (US$ Mn) Forecast, By End-users, 2016 - 2026
11.3.1. BFSI
11.3.2. Government
11.3.3. Media & Entertainment
11.3.4. Education
11.3.5. Healthcare
11.3.6. Gaming
11.3.7. Others (Hospitality etc.)
11.4. Video Live Streaming Solutions Market Size (US$ Mn) Forecast, By Country and Region, 2016 - 2026
11.4.1. GCC
11.4.2. South Africa
11.4.3. Rest of MEA
12. South America Video Live Streaming Solutions Market Analysis and Forecast
12.1. Key Findings
12.2. Video Live Streaming Solutions Market Size (US$ Mn) Forecast, By Component, 2016 - 2026
12.2.1. Software
12.2.1.1.On-Premise
12.2.1.2.Cloud
12.2.1.2.1.Public
12.2.1.2.2.Private
12.2.1.2.3.Hybrid
12.2.2. By Services
12.2.2.1.Professional Services
12.2.2.2.Managed Services
12.3. Video Live Streaming Solutions Market Size (US$ Mn) Forecast, By End-users, 2016 - 2026
12.3.1. BFSI
12.3.2. Government
12.3.3. Media & Entertainment
12.3.4. Education
12.3.5. Healthcare
12.3.6. Gaming
12.3.7. Others (Hospitality etc.)
12.4. Video Live Streaming Solutions Market Size (US$ Mn) Forecast, By Country and Region, 2016 - 2026
12.4.1. Brazil
12.4.2. Rest of South America
13. Competition Landscape
13.1. Market Player – Competition Matrix
13.2. Market Revenue Share Analysis (%), By Company (2017)
14. Company Profiles(Details – Business Overview, Sales Area/Geographical Presence, Revenue and Strategy)
14.1. DigiVive Services Pvt. Ltd
14.1.1. Overview
14.1.2. Strategic Overview
14.1.3. Financial Information
14.2. Haivision, Inc.
14.2.1. Overview
14.2.2. Strategic Overview
14.2.3. Financial Information
14.3. IBM Corporation
14.3.1. Overview
14.3.2. Strategic Overview
14.3.3. Financial Information
14.4. Livestream
14.4.1. Overview
14.4.2. Strategic Overview
14.4.3. Financial Information
14.5. Ooyala
14.5.1. Overview
14.5.2. Strategic Overview
14.5.3. Financial Information
14.6. Polycom, Inc.
14.6.1. Overview
14.6.2. Strategic Overview
14.6.3. Financial Information
14.7. Qumu Corporation
14.7.1. Overview
14.7.2. Strategic Overview
14.7.3. Financial Information
14.8. Sonic Foundry
14.8.1. Overview
14.8.2. Strategic Overview
14.8.3. Financial Information
14.9. Telestream, LLC
14.9.1. Overview
14.9.2. Strategic Overview
14.9.3. Financial Information
14.10. Wowza Media Systems, LLC
14.10.1. Overview
14.10.2. Strategic Overview
14.10.3. Financial Information
16. Key Takeaways
List of Tables
Table 1: Global Video Live Streaming Solutions Market Size (US$ Mn) Forecast, by Component, 2016 – 2026
Table 2: Global Video Live Streaming Solutions Market Size (US$ Mn) Forecast, by Cloud Based Software, 2016 – 2026
Table 3: Global Video Live Streaming Solutions Market Size (US$ Mn) Forecast, by Software Solutions, 2016 – 2026
Table 4: Global Video Live Streaming Solutions Market Size (US$ Mn) Forecast, by End-user, 2016 – 2026
Table 5: Global Video Live Streaming Solutions Market Size (US$ Mn) Forecast, by Region, 2016 – 2026
Table 6: North America Video Live Streaming Solutions Market Size (US$ Mn) Forecast, by Component, 2016 – 2026
Table 7: North America Video Live Streaming Solutions Market Size (US$ Mn) Forecast, by Cloud Based Software 2016 – 2026
Table 8: North America Video Live Streaming Solutions Market Size (US$ Mn) Forecast, by Software Solutions, 2016 – 2026
Table 9: North America Video Live Streaming Solutions Market Size (US$ Mn) Forecast, by End-user, 2016 – 2026
Table 10: North America Video Live Streaming Solutions Market Size (US$ Mn) Forecast, by Country, 2016 – 2026
Table 11: Europe Video Live Streaming Solutions Market Size (US$ Mn) Forecast, by Component, 2016 – 2026
Table 12: Europe Video Live Streaming Solutions Market Size (US$ Mn) Forecast, by Cloud Based Software 2016 – 2026
Table 13: Europe Video Live Streaming Solutions Market Size (US$ Mn) Forecast, by Software Solutions, 2016 – 2026
Table 14: Europe Video Live Streaming Solutions Market Size (US$ Mn) Forecast, by End-user, 2016 – 2026
Table 15: Europe Video Live Streaming Solutions Market Size (US$ Mn) Forecast, by Country, 2016 – 2026
Table 16: Asia Pacific Video Live Streaming Solutions Market Size (US$ Mn) Forecast, by Component, 2016 – 2026
Table 17: Asia Pacific Video Live Streaming Solutions Market Size (US$ Mn) Forecast, by Cloud Based Software 2016 – 2026
Table 18: Asia Pacific Video Live Streaming Solutions Market Size (US$ Mn) Forecast, by Software Solutions, 2016 – 2026
Table 19: Asia Pacific Video Live Streaming Solutions Market Size (US$ Mn) Forecast, by End-user, 2016 – 2026
Table 20: Asia Pacific Video Live Streaming Solutions Market Size (US$ Mn) Forecast, by Country, 2016 – 2026
Table 21: Middle East & Africa (MEA) Video Live Streaming Solutions Market Size (US$ Mn) Forecast, by Component, 2016 – 2026
Table 22: Middle East & Africa (MEA) Video Live Streaming Solutions Market Size (US$ Mn) Forecast, by Cloud Based Software 2016 – 2026
Table 23: Middle East & Africa (MEA) Video Live Streaming Solutions Market Size (US$ Mn) Forecast, by Software Solutions, 2016 – 2026
Table 24: Middle East & Africa (MEA) Video Live Streaming Solutions Market Size (US$ Mn) Forecast, by End-user, 2016 – 2026
Table 25: MEA Video Live Streaming Solutions Market Size (US$ Mn) Forecast, by Country, 2016 – 2026
Table 26: South America Video Live Streaming Solutions Market Size (US$ Mn) Forecast, by Component, 2016 – 2026
Table 27: South America Video Live Streaming Solutions Market Size (US$ Mn) Forecast, by Cloud Based Software 2016 – 2026
Table 28: South America Video Live Streaming Solutions Market Size (US$ Mn) Forecast, by Software Solutions, 2016 – 2026
Table 29: South America Video Live Streaming Solutions Market Size (US$ Mn) Forecast, by End-user, 2016 – 2026
Table 30: South America Video Live Streaming Solutions Market Size (US$ Mn) Forecast, by Country, 2016 – 2026
List of Figures
Figure 1: Global Video Live Streaming Solutions Market Size (US$ Mn) Forecast, 2016–2026
Figure 2: Video Live Streaming Solutions Market, Regional Outline
Figure 3: World GDP Indicator - 2017
Figure 4: Global ICT Spending (US$ Bn)
Figure 5: Gross Domestic Product (GDP) per Capita; Analysis (1/2) (US$ Tn), by Major Countries, 2011-2016
Figure 6: Gross Domestic Product (GDP) Analysis (2/2) (US$ Tn), by Major Countries, 2011-2016
Figure 7: Global Video Live Streaming Solutions Market Attractiveness Analysis, by Solution (2018)
Figure 8: Global Video Live Streaming Solutions Market Attractiveness Analysis, by End-User (2018)
Figure 9: Global Video Live Streaming Solutions Market Attractiveness Analysis, by Software Solutions (2018)
Figure 10: Global Video Live Streaming Solutions Market Attractiveness Analysis, by Region (2018)
Figure 11: North America Video Live Streaming Solutions Market Attractiveness Analysis, by Component (2018)
Figure 12: North America Video Live Streaming Solutions Market Attractiveness Analysis, by End User (2018)
Figure 13: North America Video Live Streaming Solutions Market Attractiveness Analysis, by Software Solutions (2018)
Figure 14: Europe Video Live Streaming Solutions Market Attractiveness Analysis, by Component (2018)
Figure 15: Europe Video Live Streaming Solutions Market Attractiveness Analysis, by End-User(2018)
Figure 16: Europe Video Live Streaming Solutions Market Attractiveness Analysis, by Software Solutions (2018)
Figure 17: Asia Pacific Video Live Streaming Solutions Market Attractiveness Analysis, by Component (2018)
Figure 18: Asia Pacific Video Live Streaming Solutions Market Attractiveness Analysis, by End User (2018)
Figure 19: Asia Pacific Video Live Streaming Solutions Market Attractiveness Analysis, by Software Solutions (2018)
Figure 20: MEA Video Live Streaming Solutions Market Attractiveness Analysis, by Component (2018)
Figure 21: MEA Video Live Streaming Solutions Market Attractiveness Analysis, by End User (2018)
Figure 22: MEA Video Live Streaming Solutions Market Attractiveness Analysis, by Software Solutions (2018)
Figure 23: South America Video Live Streaming Solutions Market Attractiveness Analysis, Component (2018)
Figure 24: South America Video Live Streaming Solutions Market Attractiveness Analysis, by End User (2018)
Figure 25: South America Video Live Streaming Solutions Market Attractiveness Analysis, by Software Solutions (2018)
Figure 26: Global Video Live Streaming Solutions Market Size (US$ Mn), 2012 – 2017
Figure 27: Global Video Live Streaming Solutions Market Size (US$ Mn), 2017 - 2026
Figure 28: Global Video Live Streaming Solutions Market Outlook (Value %), by Component
Figure 29: Global Video Live Streaming Solutions Market Outlook (Value %), by End-user
Figure 30: Global Video Live Streaming Solutions Market Outlook (Value %), by Software Solutions
Figure 31: Global Video Live Streaming Solutions Market Outlook (Value %), by Region
Figure 32: Global Video Live Streaming Solutions Market Share Analysis, by Component (2018)
Figure 33: Global Video Live Streaming Solutions Market Share Analysis, by Component (2026)
Figure 34: Global Video Live Streaming Solutions Market Share Analysis, by Software Solutions (2018)
Figure 35: Global Video Live Streaming Solutions Market Share Analysis, by Software Solutions (2026)
Figure 36: Global Video Live Streaming Solutions Market Share Analysis, by End-user (2018)
Figure 37: Global Video Live Streaming Solutions Market Share Analysis, by End-user (2026)
Figure 38: Global Video Live Streaming Solutions Market Share Analysis, by Region (2018)
Figure 39: Global Video Live Streaming Solutions Market Share Analysis, by Region (2026)
Figure 40: North America Video Live Streaming Solutions Market Revenue (US$ Mn) 2016– 2026
Figure 41: North America Video Live Streaming Solutions Opportunity Growth Analysis (US$ Mn) Forecast, 2016 – 2026
Figure 42: North America Video Live Streaming Solutions Market Share Analysis, by Component (2018)
Figure 43: North America Video Live Streaming Solutions Market Share Analysis, by Component (2026)
Figure 44: North America Video Live Streaming Solutions Market Share Analysis, by Software Solutions (2018)
Figure 45: North America Video Live Streaming Solutions Market Share Analysis, by Software Solutions (2026)
Figure 46: North America Video Live Streaming Solutions Market Share Analysis, by End-user (2018)
Figure 47: North America Video Live Streaming Solutions Market Share Analysis, by End-user (2026)
Figure 48: North America Video Live Streaming Solutions Market Share Analysis, by Country (2018)
Figure 49: North America Video Live Streaming Solutions Market Share Analysis, by Country (2026)
Figure 50: Europe Video Live Streaming Solutions Market Revenue (US$ Mn) 2016– 2026
Figure 51: Europe Video Live Streaming Solutions Opportunity Growth Analysis (US$ Mn) Forecast, 2016 – 2026
Figure 52: Europe Video Live Streaming Solutions Market Share Analysis, by Component (2018)
Figure 53: Europe Video Live Streaming Solutions Market Share Analysis, by Component (2026)
Figure 54: Europe Video Live Streaming Solutions Market Share Analysis, by Software Solutions (2018)
Figure 55: Europe Video Live Streaming Solutions Market Share Analysis, by Software Solutions (2026)
Figure 56: Europe Video Live Streaming Solutions Market Share Analysis, by End-user (2018)
Figure 57: Europe Video Live Streaming Solutions Market Share Analysis, by End-user (2026)
Figure 58: Europe Video Live Streaming Solutions Market Share Analysis, by Country (2018)
Figure 59: Europe Video Live Streaming Solutions Market Share Analysis, by Country (2026)
Figure 60: Asia Pacific Video Live Streaming Solutions Market Revenue (US$ Mn) 2016– 2026
Figure 61: Asia Pacific Video Live Streaming Solutions Opportunity Growth Analysis (US$ Mn) Forecast, 2016 – 2026
Figure 62: Asia Pacific Video Live Streaming Solutions Market Share Analysis, by Component (2018)
Figure 63: Asia Pacific Video Live Streaming Solutions Market Share Analysis, by Component (2026)
Figure 64: Asia Pacific Video Live Streaming Solutions Market Share Analysis, by Software Solutions (2018)
Figure 65: Asia Pacific Video Live Streaming Solutions Market Share Analysis, by Software Solutions (2026)
Figure 66: Asia Pacific Video Live Streaming Solutions Market Share Analysis, by End-user (2018)
Figure 67: Asia Pacific Video Live Streaming Solutions Market Share Analysis, by End-user (2026)
Figure 68: Asia Pacific Video Live Streaming Solutions Market Share Analysis, by Country (2018)
Figure 69: Asia Pacific Video Live Streaming Solutions Market Share Analysis, by Country (2026)
Figure 70: Middle East & Africa (MEA) Video Live Streaming Solutions Market Revenue (US$ Mn) 2016– 2026
Figure 71: Middle East & Africa (MEA) Video Live Streaming Solutions Opportunity Growth Analysis (US$ Mn) Forecast, 2016 – 2026
Figure 72: Middle East & Africa (MEA) Video Live Streaming Solutions Market Share Analysis, by Component (2018)
Figure 73: Middle East & Africa (MEA) Video Live Streaming Solutions Market Share Analysis, by Component (2026)
Figure 74: Middle East & Africa (MEA) Video Live Streaming Solutions Market Share Analysis, by Software Solutions (2018)
Figure 75: Middle East & Africa (MEA) Video Live Streaming Solutions Market Share Analysis, by Software Solutions (2026)
Figure 76: Middle East & Africa (MEA) Video Live Streaming Solutions Market Share Analysis, by End-user (2018)
Figure 77: Middle East & Africa (MEA) Video Live Streaming Solutions Market Share Analysis, by End-user (2026)
Figure 78: MEA Video Live Streaming Solutions Market Share Analysis, by Country (2018)
Figure 79: MEA Video Live Streaming Solutions Market Share Analysis, by Country (2026)
Figure 80: South America Video Live Streaming Solutions Market Revenue (US$ Mn) 2016– 2026
Figure 81: South America Video Live Streaming Solutions Opportunity Growth Analysis (US$ Mn) Forecast, 2016 – 2026
Figure 82: South America Video Live Streaming Solutions Market Share Analysis, by Component (2018)
Figure 83: South America Video Live Streaming Solutions Market Share Analysis, by Component (2026)
Figure 84: South America Video Live Streaming Solutions Market Share Analysis, by Software Solutions (2018)
Figure 85: South America Video Live Streaming Solutions Market Share Analysis, by Software Solutions (2026)
Figure 86: South America Video Live Streaming Solutions Market Share Analysis, by End-user (2018)
Figure 87: South America Video Live Streaming Solutions Market Share Analysis, by End-user (2026)
Figure 88: South America Video Live Streaming Solutions Market Share Analysis, by Country (2018)
Figure 89: South America Video Live Streaming Solutions Market Share Analysis, by Country (2026)
Copyright © Transparency Market Research, Inc. All Rights reserved
Trust Online

Video Live Streaming Solutions Market