
Reports
Reports
Consumer trends continue to dictate the course of the food & beverage industry. Consumers are increasingly embracing new food trends and preferences that have stayed in the niche category for a considerable amount of time. However, climate change, mounting concerns related to animal cruelty, and health are some of the leading factors that are driving the vegan movement worldwide. At present, veganism is at its peak and the trend is likely to continue in the near future, as more number of individuals across the world continues to realize the benefits of veganism. As the vegan trend gradually gains mainstream recognition, an array of food brands and companies are expanding their product portfolio and offering vegan products including cheese, bread, ice cream, and biscuits.
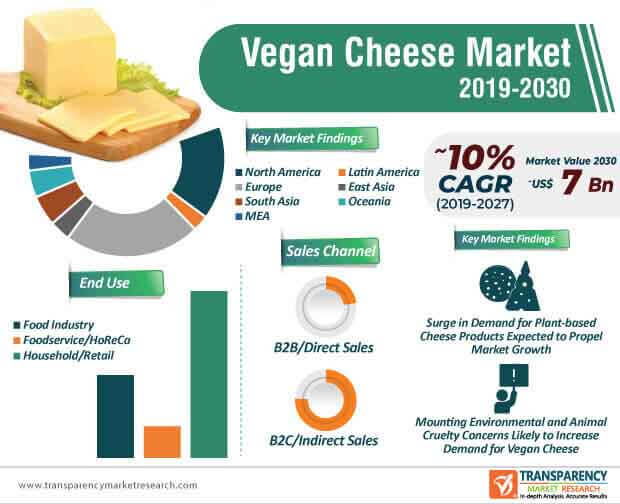
Plant-based cheese products gain popularity, as consumers are making the switch from conventional cheese. Sensing the growing interest in vegan cheese, an array of vegan cheese brands have entered the global market due to which, the competition in the vegan cheese market is high. As the demand for vegan cheese grows at an exponential rate, plant-based cheese brands are currently expanding their production capacity to meet the demand. At the back of these factors, along with the growing number of celebrities and influencers advocating the consumption of vegan products, the global vegan cheese market is expected to attain a market value of ~US$ 7 Bn by the end of 2030.
Within the vegan cheese market, research and development is imperative for market growth. Although the sales of vegan cheese continues to grow at an impressive rate, particularly in Europe and North America, the vegan cheese market is playing the catch up game with other plant-based food sectors, including meat and milk. However, as the competition within the current vegan cheese market landscape continues to grow, several companies are increasingly investing resources in research and development to successfully mimic the complex function and flavor profiles of cheese.
Although vegan cheese is gradually crossing over to the mainstream, modern day consumers are more wary of the quality and nutritional content of the products. Thereby, research and development activities are in full swing to mimic the properties of conventional cheese. As plant-based food products continue to gain considerable popularity, the demand for vegan cheese is expected to witness notable growth in the upcoming years.
While the vegan trend continues to spread like wild fire across different regions of the world, the vegan cheese market is set to grow at an impressive pace over the forecast period. Several factors are expected to drive the growth of the vegan cheese market, including growing consumer awareness pertaining to lactose intolerance and soaring adoption of non-dairy cheese products in baked food and snack items. The vegan cheese market across Europe and North America is expected to witness noteworthy development in terms of sales and value.
The Presence of top tier vegan cheese brands, growing consumer awareness, increasing number of social media influencers and celebrities promoting vegan cheese, and shift toward a healthier lifestyle are some of the major factors expected to drive the growth of the market for vegan cheese in these two regions. Several companies are expanding their product portfolio in tune with the evolving consumer trends and lifestyle preferences. In addition, while offline sales across supermarkets, retail stores, wholesale markets, etc., are likely to generate considerable business, market players are also expected to launch their products on e-Commerce platforms to generate additional revenue.
The advent of the COVID-19 pandemic is expected to trigger major developments in the food & beverage sector. The ongoing health crisis is expected to hamper the growth of the global vegan cheese market, particularly in 2020, as consumer demand continues to decline. In addition, as major food exhibitions and events are either delayed or postponed and restaurants continue to remain closed during the lockdown period, demand for vegan cheese is likely to decline. In addition, brands are expected to address financial challenges put forward by the COVID-19 event and assess the situation thoroughly. While the production of vegan cheese could potentially resume in the second half of 2020, major brands are anticipated to diversify their income streams and turn to e-Commerce platforms to increase sales and market presence. Brands are also projected to address the logistics channels and work their way through to identify most suitable supply chain models during these troubling times.
Analysts’ Viewpoint
The global vegan cheese market is expected to grow at an impressive CAGR of ~10% during the forecast period. The market growth can be primarily attributed to a host of factors, including consistent rise in the number of vegan consumer base worldwide, growing awareness regarding the benefits of vegan food products, mounting environment protection concerns, animal welfare, and evolving consumer trends. Europe and North America are projected to be at the forefront in terms of market share and value, owing to the presence of leading brands, high consumer awareness, high disposable income, and influence of social media.
Vegan Cheese Market: Overview
Vegan Cheese: Market Frontrunners
Vegan Cheese Market: Trends
Growing Health & Wellness Trend
Vegan Cheese Market: Strategies
Target Region for Market
Vegan Cheese Market: Players
Vegan Cheese Market is expected to reach US$ 7 Bn By 2030
Vegan Cheese Market is estimated to rise at a CAGR of 10% during forecast period
Increasing consumption of plant-based products is expected to fuel the demand for vegan cheese in the forecast period
North America and Europe is more attractive for vendors in the Vegan Cheese Market
Key players of Vegan Cheese Market are Violife Foods, Daiya Foods, Tyne Chease Limited, Vtopian Artisan Cheese Company, Kite Hill, Miyoko’s Kitchen Company, Vermont Farmstead Company, Good Planet Foods, Follow Your Heart, Galaxy Nutritional Foods, Inc., Parmela Creamery, Field Roast Grain Meat Co
1. Executive Summary
1.1. Market Overview
1.2. Market Analysis
1.3. TMR Analysis and Recommendations
1.4. Opportunity Matrix
2. Market Introduction
2.1. Market Definition
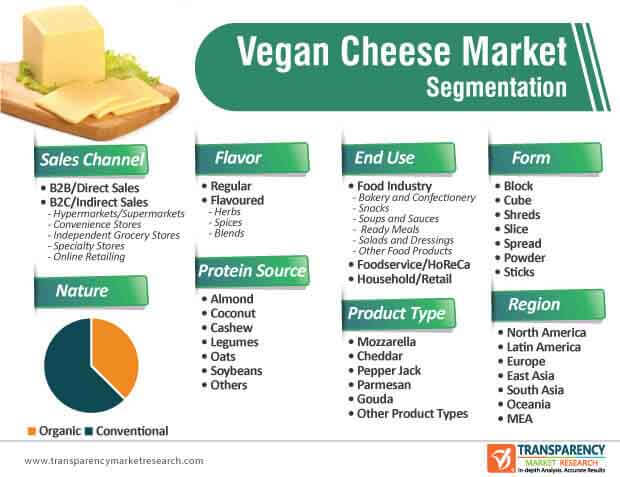
2.2. Market Taxonomy
3. Vegan Cheese Market Background
3.1. Evolution of Plant Based Food Products (2007 – 2017)
3.2. Key Certifications
3.3. Cheese Production Overview
3.3.1. Total Production of Cheese
3.3.2. Per Capita Consumption of Cheese
3.3.3. Total Consumption of Cheese
3.4. Policy Developments and Regulatory Scenario
3.5. Product Launches for Vegan Cheese in 2019 and 2020 (YTD)
3.6. Macro-Economic Indicators
3.7. Global Economic Outlook
3.7.1. Global GDP by Region and Country, 2006–2021
3.7.2. Global Industry Value Added
3.7.3. Global Retail Industry Outlook
3.8. Value Chain Analysis
3.8.1. Raw Material Suppliers
3.8.2. Vegan Cheese Manufacturers
3.8.3. Distributors/Suppliers/Wholesalers
3.8.4. Traders
3.8.5. End Users
3.9. Market Dynamics
3.9.1. Drivers
3.9.2. Restraints
3.9.3. Opportunities
3.9.4. Trends
3.10. Forecast Factors – Relevance and Impact
4. Global Vegan Cheese Market Analysis 2015–2019 and Forecast 2020–2030
4.1. Per Capita Consumption of Vegan Cheese, by Country/Region, 2017
4.2. Market Volume (Metric Tons) and Forecast
4.3. Market Size (US$ Mn) and Forecast
4.3.1. Market Size (US$ Mn) and Y-o-Y Growth
4.3.2. Absolute $ Opportunity
5. Global Vegan Cheese Market Pricing Analysis
5.1. Regional Average Pricing Analysis (US$/MT)
5.1.1. North America
5.1.2. Latin America
5.1.3. Europe
5.1.4. East Asia
5.1.5. South Asia
5.1.6. Oceania
5.1.7. Middle East & Africa
5.2. Pricing Analysis, By Nature
6. Global Vegan Cheese Market Analysis 2015–2019 and Forecast 2020–2030, by Nature
6.1. Introduction
6.2. Historical Market Size (US$ Mn) and Volume (MT) By Nature, 2015–2019
6.3. Market Size (US$ Mn) and Volume (MT) Forecast By Nature, 2020-2030
6.3.1. Organic
6.3.2. Conventional
6.4. Attractiveness Analysis by Nature
7. Global Vegan Cheese Market Analysis 2015–2019 and Forecast 2020–2030, by Product Type
7.1. Introduction
7.2. Historical Market Size (US$ Mn) and Volume (MT) By Product Type, 2015–2019
7.3. Market Size (US$ Mn) and Volume (MT) Forecast By Product Type, 2020-2030
7.3.1. Mozzarella
7.3.2. Cheddar
7.3.3. Pepper Jack
7.3.4. Parmesan
7.3.5. Gouda
7.3.6. Other Product Types
7.4. Attractiveness Analysis by Product Type
8. Global Vegan Cheese Market Analysis 2015–2019 and Forecast 2020–2030, by Form
8.1. Introduction
8.2. Historical Market Size (US$ Mn) and Volume (MT) By Form, 2015–2019
8.3. Market Size (US$ Mn) and Volume (MT) Forecast By Form, 2020-2030
8.3.1. Block
8.3.2. Cube
8.3.3. Shreds
8.3.4. Slice
8.3.5. Spread
8.3.6. Powder
8.3.7. Sticks
8.4. Attractiveness Analysis By Form
9. Global Vegan Cheese Market Analysis 2015–2019 and Forecast 2020–2030, by Protein Source
9.1. Introduction
9.2. Historical Market Size (US$ Mn) and Volume (MT) By Protein Source, 2015–2019
9.3. Market Size (US$ Mn) and Volume (MT) Forecast By Protein Source, 2020-2030
9.3.1. Almond
9.3.2. Coconut
9.3.3. Cashew
9.3.4. Legumes
9.3.5. Oats
9.3.6. Soybeans
9.3.7. Others
9.4. Attractiveness Analysis By Protein Source
10. Global Vegan Cheese Market Analysis 2015–2019 and Forecast 2020–2030, by End-use
10.1. Introduction
10.2. Historical Market Size (US$ Mn) and Volume (MT) By End-use, 2015–2019
10.3. Market Size (US$ Mn) and Volume (MT) Forecast By End-use, 2020-2030
10.3.1. Food Industry
10.3.2. Bakery and Confectionery
10.3.3. Snacks
10.3.4. Soups and Sauces
10.3.5. Ready Meals
10.3.6. Salads and Dressings
10.3.7. Other Food Products
10.3.8. Foodservice/HoReCa
10.3.9. Household/Retail
10.4. Attractiveness Analysis By End-use
11. Global Vegan Cheese Market Analysis 2015–2019 and Forecast 2020–2030, by Flavor
11.1. Introduction
11.2. Historical Market Size (US$ Mn) and Volume (MT) By Flavor, 2015–2019
11.3. Market Size (US$ Mn) and Volume (MT) Forecast By Flavor, 2020-2030
11.3.1. Regular
11.3.2. Flavoured
11.3.2.1. Herbs
11.3.2.2. Spices
11.3.2.3. Blends
11.4. Attractiveness Analysis By Flavor
12. Global Vegan Cheese Market Analysis 2015–2019 and Forecast 2020–2030, by Sales Channel
12.1. Introduction
12.2. Historical Market Size (US$ Mn) and Volume (MT) By Sales Channel, 2015–2019
12.3. Market Size (US$ Mn) and Volume (MT) Forecast By Sales Channel, 2020-2030
12.3.1. B2B/Direct Sales
12.3.2. B2C/Indirect Sales
12.3.2.1. Hypermarkets/Supermarkets
12.3.2.2. Convenience Stores
12.3.2.3. Independent Grocery Stores
12.3.2.4. Specialty Stores
12.3.2.5. Online Retailing
12.4. Attractiveness Analysis By Sales Channel
13. Global Vegan Cheese Market Analysis 2015–2019 and Forecast 2020–2030, by Region
13.1. Introduction
13.2. Historical Market Size (US$ Mn) and Volume (MT) By Region, 2015–2019
13.3. Market Size (US$ Mn) and Volume (MT) Forecast By Region, 2020-2030
13.3.1. North America
13.3.2. Latin America
13.3.3. Europe
13.3.4. East Asia
13.3.5. South Asia
13.3.6. Oceania
13.3.7. MEA
13.4. Attractiveness Analysis By Region
14. North America Vegan Cheese Market Analysis 2015–2019 and Forecast 2020–2030
14.1. Introduction
14.2. Historical Market Value (US$ Mn) and Volume (Metric Tons) By Market Segments, 2015–2019
14.3. Market Value (US$ Mn) and Volume (Metric Tons) Forecast By Market Segments, 2020-2030
14.3.1. By Country
14.3.1.1. U.S.
14.3.1.2. Canada
14.3.2. By Nature
14.3.3. By Product Type
14.3.4. By Form
14.3.5. By Protein Source
14.3.6. By End-use
14.3.7. By Flavor
14.3.8. By Sales Channel
14.4. Market Attractiveness Analysis
14.4.1. By Country
14.4.2. By Nature
14.4.3. By Product Type
14.4.4. By Form
14.4.5. By Protein Source
14.4.6. By End-use
14.4.7. By Flavor
14.4.8. By Sales Channel
14.5. Drivers and Restraints: Impact Analysis
14.6. Key Participants Market Presence Intensity Mapping
15. Latin America Vegan Cheese Market Analysis 2015–2019 and Forecast 2020–2030
15.1. Introduction
15.2. Historical Market Value (US$ Mn) and Volume (Metric Tons) By Market Segments, 2015–2019
15.3. Market Value (US$ Mn) and Volume (Metric Tons) Forecast By Market Segments, 2020-2030
15.3.1. By Country
15.3.1.1. Brazil
15.3.1.2. Mexico
15.3.1.3. Chile
15.3.1.4. Peru
15.3.1.5. Rest of Latin America
15.3.2. By Nature
15.3.3. By Product Type
15.3.4. By Form
15.3.5. By Protein Source
15.3.6. By End-use
15.3.7. By Flavor
15.3.8. By Sales Channel
15.4. Market Attractiveness Analysis
15.4.1. By Country
15.4.2. By Nature
15.4.3. By Product Type
15.4.4. By Form
15.4.5. By Protein Source
15.4.6. By End-use
15.4.7. By Flavor
15.4.8. By Sales Channel
15.5. Drivers and Restraints: Impact Analysis
15.6. Key Participants Market Presence Intensity Mapping
16. Europe Vegan Cheese Market Analysis 2015–2019 and Forecast 2020–2030
16.1. Introduction
16.2. Historical Market Value (US$ Mn) and Volume (Metric Tons) By Market Segments, 2015–2019
16.3. Market Value (US$ Mn) and Volume (Metric Tons) Forecast By Market Segments, 2020-2030
16.3.1. By Country
16.3.1.1. EU-4
16.3.1.2. U.K
16.3.1.3. BENELUX
16.3.1.4. NORDIC
16.3.1.5. Russia
16.3.1.6. Poland
16.3.1.7. Rest of Europe
16.3.2. By Nature
16.3.3. By Product Type
16.3.4. By Form
16.3.5. By Protein Source
16.3.6. By End-use
16.3.7. By Flavor
16.3.8. By Sales Channel
16.4. Market Attractiveness Analysis
16.4.1. By Country
16.4.2. By Nature
16.4.3. By Product Type
16.4.4. By Form
16.4.5. By Protein Source
16.4.6. By End-use
16.4.7. By Flavor
16.4.8. By Sales Channel
16.5. Drivers and Restraints: Impact Analysis
16.6. Key Participants Market Presence Intensity Mapping
17. East Asia Vegan Cheese Market Analysis 2015–2019 and Forecast 2020–2030
17.1. Introduction
17.2. Historical Market Value (US$ Mn) and Volume (Metric Tons) By Market Segments, 2015–2019
17.3. Market Value (US$ Mn) and Volume (Metric Tons) Forecast By Market Segments, 2020-2030
17.3.1. By Country
17.3.1.1. China
17.3.1.2. Japan
17.3.1.3. South Korea
17.3.2. By Nature
17.3.3. By Product Type
17.3.4. By Form
17.3.5. By Protein Source
17.3.6. By End-use
17.3.7. By Flavor
17.3.8. By Sales Channel
17.4. Market Attractiveness Analysis
17.4.1. By Country
17.4.2. By Nature
17.4.3. By Product Type
17.4.4. By Form
17.4.5. By Protein Source
17.4.6. By End-use
17.4.7. By Flavor
17.4.8. By Sales Channel
17.5. Drivers and Restraints: Impact Analysis
17.6. Key Participants Market Presence Intensity Mapping
18. South Asia Vegan Cheese Market Analysis 2015–2019 and Forecast 2020–2030
18.1. Introduction
18.2. Historical Market Value (US$ Mn) and Volume (Metric Tons) By Market Segments, 2015–2019
18.3. Market Value (US$ Mn) and Volume (Metric Tons) Forecast By Market Segments, 2020-2030
18.3.1. By Country
18.3.1.1. India
18.3.1.2. Thailand
18.3.1.3. Malaysia
18.3.1.4. Singapore
18.3.1.5. Rest of South Asia
1.1.1. By Nature
18.3.2. By Product Type
18.3.3. By Form
18.3.4. By Protein Source
18.3.5. By End-use
18.3.6. By Flavor
18.3.7. By Sales Channel
18.4. Market Attractiveness Analysis
18.4.1. By Country
1.1.1. By Nature
18.4.2. By Product Type
18.4.3. By Form
18.4.4. By Protein Source
18.4.5. By End-use
18.4.6. By Flavor
18.4.7. By Sales Channel
18.5. Drivers and Restraints: Impact Analysis
18.6. Key Participants Market Presence Intensity Mapping
19. Oceania Vegan Cheese Market Analysis 2015–2019 and Forecast 2020–2030
19.1. Introduction
19.2. Historical Market Value (US$ Mn) and Volume (Metric Tons) By Market Segments, 2015–2019
19.3. Market Value (US$ Mn) and Volume (Metric Tons) Forecast By Market Segments, 2020-2030
19.3.1. By Country
19.3.1.1. Australia
19.3.1.2. New Zealand
19.3.2. By Nature
19.3.3. By Product Type
19.3.4. By Form
19.3.5. By Protein Source
19.3.6. By End-use
19.3.7. By Flavor
19.3.8. By Sales Channel
19.4. Market Attractiveness Analysis
19.4.1. By Country
19.4.2. By Nature
19.4.3. By Product Type
19.4.4. By Form
19.4.5. By Protein Source
19.4.6. By End-use
19.4.7. By Flavor
19.4.8. By Sales Channel
19.5. Drivers and Restraints: Impact Analysis
19.6. Key Participants Market Presence Intensity Mapping
20. MEA Vegan Cheese Market Analysis 2015–2019 and Forecast 2020–2030
20.1. Introduction
20.2. Historical Market Value (US$ Mn) and Volume (Metric Tons) By Market Segments, 2015–2019
20.3. Market Value (US$ Mn) and Volume (Metric Tons) Forecast By Market Segments, 2020-2030
20.3.1. By Country
20.3.1.1. GCC Countries
20.3.1.2. South Africa
20.3.1.3. Turkey
20.3.1.4. Rest of MEA
20.3.2. By Nature
20.3.3. By Product Type
20.3.4. By Form
20.3.5. By Protein Source
20.3.6. By End-use
20.3.7. By Flavor
20.3.8. By Sales Channel
20.4. Market Attractiveness Analysis
20.4.1. By Country
20.4.2. By Nature
20.4.3. By Product Type
20.4.4. By Form
20.4.5. By Protein Source
20.4.6. By End-use
20.4.7. By Flavor
20.4.8. By Sales Channel
20.5. Drivers and Restraints: Impact Analysis
20.6. Key Participants Market Presence Intensity Mapping
21. Vegan Cheese Market Industry Structure
21.1. Market Analysis by Tier of Companies
21.1.1. By Large, Medium and Small
21.2. Market Concentration
21.2.1. By Top 5 and By Top 10
21.3. Market Share Analysis of Top 10 Players
21.4. Market Presence Analysis
21.4.1. By Regional Footprint
21.4.2. By Product Footprint
21.4.3. By Channel Footprint
22. Competition Analysis
22.1. Competition Dashboard
22.2. Competitive Benchmarking
22.3. Competition Developments (Mergers, Acquisitions and Expansions)
22.4. Competition Deepdive (Tentative List)
22.4.1. Violife Foods
22.4.1.1. Overview
22.4.1.2. Product Portfolio
22.4.1.3. Profitability by Market Segments (Product/Channel/Region)
22.4.1.4. Sales Footprint
22.4.1.5. Channel Footprint
22.4.1.6. Strategy Overview
22.4.1.6.1. Marketing Strategy
22.4.1.6.2. Product Strategy
22.4.1.6.3. Channel Strategy
22.4.2. Daiya Foods
22.4.2.1. Overview
22.4.2.2. Product Portfolio
22.4.2.3. Profitability by Market Segments (Product/Channel/Region)
22.4.2.4. Sales Footprint
22.4.2.5. Channel Footprint
22.4.2.6. Strategy Overview
22.4.2.6.1. Marketing Strategy
22.4.2.6.2. Product Strategy
22.4.2.6.3. Channel Strategy
22.4.3. Tyne Chease Limited
22.4.3.1. Overview
22.4.3.2. Product Portfolio
22.4.3.3. Profitability by Market Segments (Product/Channel/Region)
22.4.3.4. Sales Footprint
22.4.3.5. Channel Footprint
22.4.3.6. Strategy Overview
22.4.3.6.1. Marketing Strategy
22.4.3.6.2. Product Strategy
22.4.3.6.3. Channel Strategy
22.4.4. Vtopian Artisan Cheese Company
22.4.4.1. Overview
22.4.4.2. Product Portfolio
22.4.4.3. Profitability by Market Segments (Product/Channel/Region)
22.4.4.4. Sales Footprint
22.4.4.5. Channel Footprint
22.4.4.6. Strategy Overview
22.4.4.6.1. Marketing Strategy
22.4.4.6.2. Product Strategy
22.4.4.6.3. Channel Strategy
22.4.5. Kite Hill
22.4.5.1. Overview
22.4.5.2. Product Portfolio
22.4.5.3. Profitability by Market Segments (Product/Channel/Region)
22.4.5.4. Sales Footprint
22.4.5.5. Channel Footprint
22.4.5.6. Strategy Overview
22.4.5.6.1. Marketing Strategy
22.4.5.6.2. Product Strategy
22.4.5.6.3. Channel Strategy
22.4.6. Miyoko’s Kitchen Company
22.4.6.1. Overview
22.4.6.2. Product Portfolio
22.4.6.3. Profitability by Market Segments (Product/Channel/Region)
22.4.6.4. Sales Footprint
22.4.6.5. Channel Footprint
22.4.6.6. Strategy Overview
22.4.6.6.1. Marketing Strategy
22.4.6.6.2. Product Strategy
22.4.6.6.3. Channel Strategy
22.4.7. Vermont Farmstead Company
22.4.7.1. Overview
22.4.7.2. Product Portfolio
22.4.7.3. Profitability by Market Segments (Product/Channel/Region)
22.4.7.4. Sales Footprint
22.4.7.5. Channel Footprint
22.4.7.6. Strategy Overview
22.4.7.6.1. Marketing Strategy
22.4.7.6.2. Product Strategy
22.4.7.6.3. Channel Strategy
22.4.8. Good Planet Foods
22.4.8.1. Overview
22.4.8.2. Product Portfolio
22.4.8.3. Profitability by Market Segments (Product/Channel/Region)
22.4.8.4. Sales Footprint
22.4.8.5. Channel Footprint
22.4.8.6. Strategy Overview
22.4.8.6.1. Marketing Strategy
22.4.8.6.2. Product Strategy
22.4.8.6.3. Channel Strategy
22.4.9. Follow your Heart
22.4.9.1. Overview
22.4.9.2. Product Portfolio
22.4.9.3. Profitability by Market Segments (Product/Channel/Region)
22.4.9.4. Sales Footprint
22.4.9.5. Channel Footprint
22.4.9.6. Strategy Overview
22.4.9.6.1. Marketing Strategy
22.4.9.6.2. Product Strategy
22.4.9.6.3. Channel Strategy
22.4.10. Galaxy Nutritional Foods, Inc.
22.4.10.1. Overview
22.4.10.2. Product Portfolio
22.4.10.3. Profitability by Market Segments (Product/Channel/Region)
22.4.10.4. Sales Footprint
22.4.10.5. Channel Footprint
22.4.10.6. Strategy Overview
22.4.10.6.1. Marketing Strategy
22.4.10.6.2. Product Strategy
22.4.10.6.3. Channel Strategy
22.4.11. Parmela Creamery
22.4.11.1. Overview
22.4.11.2. Product Portfolio
22.4.11.3. Profitability by Market Segments (Product/Channel/Region)
22.4.11.4. Sales Footprint
22.4.11.5. Channel Footprint
22.4.11.6. Strategy Overview
22.4.11.6.1. Marketing Strategy
22.4.11.6.2. Product Strategy
22.4.11.6.3. Channel Strategy
22.4.12. Field Roast Grain Meat Co.
22.4.12.1. Overview
22.4.12.2. Product Portfolio
22.4.12.3. Profitability by Market Segments (Product/Channel/Region)
22.4.12.4. Sales Footprint
22.4.12.5. Channel Footprint
22.4.12.6. Strategy Overview
22.4.12.6.1. Marketing Strategy
22.4.12.6.2. Product Strategy
22.4.12.6.3. Channel Strategy
22.4.13. Bute Island Food Ltd.
22.4.13.1. Overview
22.4.13.2. Product Portfolio
22.4.13.3. Profitability by Market Segments (Product/Channel/Region)
22.4.13.4. Sales Footprint
22.4.13.5. Channel Footprint
22.4.13.6. Strategy Overview
22.4.13.6.1. Marketing Strategy
22.4.13.6.2. Product Strategy
22.4.13.6.3. Channel Strategy
23. Assumptions and Acronyms Used
24. Research Methodology
List of Tables
Table 01: Global Vegan Cheese Market Value (US$ Mn) and Forecast by Region, 2015–2030
Table 02: Global Vegan Cheese Market Volume (Metric Tons) and Forecast by Region, 2015–2030
Table 03: Global Vegan Cheese Market Value (US$ Mn) and Forecast by Product Type, 2015–2030
Table 04: Global Vegan Cheese Market Volume (Metric Tons) and Forecast by Product Type, 2015–2030
Table 05: Global Vegan Cheese Market Value (US$ Mn) and Forecast by Nature, 2015–2030
Table 06: Global Vegan Cheese Market Volume (Metric Tons) and Forecast by Nature, 2015–2030
Table 07: Global Vegan Cheese Market Value (US$ Mn) and Forecast by Form, 2015–2030
Table 08: Global Vegan Cheese Market Volume (Metric Tons) and Forecast by Form, 2015–2030
Table 09: Global Vegan Cheese Market Value (US$ Mn) and Forecast by Protein Source, 2015–2030
Table 10: Global Vegan Cheese Market Volume (Metric Tons) and Forecast by Protein Source, 2015–2030
Table 11: Global Vegan Cheese Market Value (US$ Mn) and Forecast by End Use, 2015–2030
Table 12: Global Vegan Cheese Market Volume (Metric Tons) and Forecast by End Use, 2015–2030
Table 13: Global Vegan Cheese Market Value (US$ Mn) and Forecast by Flavor, 2015–2030
Table 14: Global Vegan Cheese Market Volume (Metric Tons) and Forecast by Flavor, 2015–2030
Table 15: Global Vegan Cheese Market Value (US$ Mn) and Forecast by Sales Channel, 2015–2030
Table 16: Global Vegan Cheese Market Volume (Metric Tons) and Forecast by Sales Channel, 2015–2030
Table 17: North America Vegan Cheese Market Value (US$ Mn) and Forecast by Country, 2015–2030
Table 18: North America Vegan Cheese Market Volume (Metric Tons) and Forecast by Country, 2015–2030
Table 19: North America Vegan Cheese Market Value (US$ Mn) and Forecast by Product Type, 2015–2030
Table 20: North America Vegan Cheese Market Volume (Metric Tons) and Forecast by Product Type, 2015–2030
Table 21: North America Vegan Cheese Market Value (US$ Mn) and Forecast by Nature, 2015–2030
Table 22: North America Vegan Cheese Market Volume (Metric Tons) and Forecast by Nature, 2015–2030
Table 23: North America Vegan Cheese Market Value (US$ Mn) and Forecast by Form, 2015–2030
Table 24: North America Vegan Cheese Market Volume (Metric Tons) and Forecast by Form, 2015–2030
Table 25: North America Vegan Cheese Market Value (US$ Mn) and Forecast by Protein Source, 2015–2030
Table 26: North America Vegan Cheese Market Volume (Metric Tons) and Forecast by Protein Source, 2015–2030
Table 27: North America Vegan Cheese Market Value (US$ Mn) and Forecast by End Use, 2015–2030
Table 28: North America Vegan Cheese Market Volume (Metric Tons) and Forecast by End Use, 2015–2030
Table 29: North America Vegan Cheese Market Value (US$ Mn) and Forecast by Flavor, 2015–2030
Table 30: North America Vegan Cheese Market Volume (Metric Tons) and Forecast by Flavor, 2015–2030
Table 31: North America Vegan Cheese Market Value (US$ Mn) and Forecast by Sales Channel, 2015–2030
Table 32: North America Vegan Cheese Market Volume (Metric Tons) and Forecast by Sales Channel, 2015–2030
Table 33: Latin America Vegan Cheese Market Value (US$ Mn) and Forecast by Country, 2015–2030
Table 34: Latin America Vegan Cheese Market Volume (Metric Tons) and Forecast by Country, 2015–2030
Table 35: Latin America Vegan Cheese Market Value (US$ Mn) and Forecast by Product Type, 2015–2030
Table 36: Latin America Vegan Cheese Market Volume (Metric Tons) and Forecast by Product Type, 2015–2030
Table 37: Latin America Vegan Cheese Market Value (US$ Mn) and Forecast by Nature, 2015–2030
Table 38: Latin America Vegan Cheese Market Volume (Metric Tons) and Forecast by Nature, 2015–2030
Table 39: Latin America Vegan Cheese Market Value (US$ Mn) and Forecast by Form, 2015–2030
Table 40: Latin America Vegan Cheese Market Volume (Metric Tons) and Forecast by Form, 2015–2030
Table 41: Latin America Vegan Cheese Market Value (US$ Mn) and Forecast by Protein Source, 2015–2030
Table 42: Latin America Vegan Cheese Market Volume (Metric Tons) and Forecast by Protein Source, 2015–2030
Table 43: Latin America Vegan Cheese Market Value (US$ Mn) and Forecast by End Use, 2015–2030
Table 44: Latin America Vegan Cheese Market Volume (Metric Tons) and Forecast by End Use, 2015–2030
Table 45: Latin America Vegan Cheese Market Value (US$ Mn) and Forecast by Flavor, 2015–2030
Table 46: Latin America Vegan Cheese Market Volume (Metric Tons) and Forecast by Flavor, 2015–2030
Table 47: Latin America Vegan Cheese Market Value (US$ Mn) and Forecast by Sales Channel, 2015–2030
Table 48: Latin America Vegan Cheese Market Volume (Metric Tons) and Forecast by Sales Channel, 2015–2030
Table 49: Europe Vegan Cheese Market Value (US$ Mn) and Forecast by Country, 2015–2030
Table 50: Europe Vegan Cheese Market Volume (Metric Tons) and Forecast by Country, 2015–2030
Table 51: Europe Vegan Cheese Market Value (US$ Mn) and Forecast by Product Type, 2015–2030
Table 52: Europe Vegan Cheese Market Volume (Metric Tons) and Forecast by Product Type, 2015–2030
Table 53: Europe Vegan Cheese Market Value (US$ Mn) and Forecast by Nature, 2015–2030
Table 54: Europe Vegan Cheese Market Volume (Metric Tons) and Forecast by Nature, 2015–2030
Table 55: Europe Vegan Cheese Market Value (US$ Mn) and Forecast by Form, 2015–2030
Table 56: Europe Vegan Cheese Market Volume (Metric Tons) and Forecast by Form, 2015–2030
Table 57: Europe Vegan Cheese Market Value (US$ Mn) and Forecast by Protein Source, 2015–2030
Table 58: Europe Vegan Cheese Market Volume (Metric Tons) and Forecast by Protein Source, 2015–2030
Table 59: Europe Vegan Cheese Market Value (US$ Mn) and Forecast by End Use, 2015–2030
Table 60: Europe Vegan Cheese Market Volume (Metric Tons) and Forecast by End Use, 2015–2030
Table 61: Europe Vegan Cheese Market Value (US$ Mn) and Forecast by Flavor, 2015–2030
Table 62: Europe Vegan Cheese Market Volume (Metric Tons) and Forecast by Flavor, 2015–2030
Table 63: Europe Vegan Cheese Market Value (US$ Mn) and Forecast by Sales Channel, 2015–2030
Table 64: Europe Vegan Cheese Market Volume (Metric Tons) and Forecast by Sales Channel, 2015–2030
Table 65: East Asia Vegan Cheese Market Value (US$ Mn) and Forecast by Country, 2015–2030
Table 66: East Asia Vegan Cheese Market Volume (Metric Tons) and Forecast by Country, 2015–2030
Table 67: East Asia Vegan Cheese Market Value (US$ Mn) and Forecast by Product Type, 2015–2030
Table 68: East Asia Vegan Cheese Market Volume (Metric Tons) and Forecast by Product Type, 2015–2030
Table 69: East Asia Vegan Cheese Market Value (US$ Mn) and Forecast by Nature, 2015–2030
Table 70: East Asia Vegan Cheese Market Volume (Metric Tons) and Forecast by Nature, 2015–2030
Table 71: East Asia Vegan Cheese Market Value (US$ Mn) and Forecast by Form, 2015–2030
Table 72: East Asia Vegan Cheese Market Volume (Metric Tons) and Forecast by Form, 2015–2030
Table 73: East Asia Vegan Cheese Market Value (US$ Mn) and Forecast by Protein Source, 2015–2030
Table 74: East Asia Vegan Cheese Market Volume (Metric Tons) and Forecast by Protein Source, 2015–2030
Table 75: East Asia Vegan Cheese Market Value (US$ Mn) and Forecast by End Use, 2015–2030
Table 76: East Asia Vegan Cheese Market Volume (Metric Tons) and Forecast by End Use, 2015–2030
Table 77: East Asia Vegan Cheese Market Value (US$ Mn) and Forecast by Flavor, 2015–2030
Table 78: East Asia Vegan Cheese Market Volume (Metric Tons) and Forecast by Flavor, 2015–2030
Table 79: East Asia Vegan Cheese Market Value (US$ Mn) and Forecast by Sales Channel, 2015–2030
Table 80: East Asia Vegan Cheese Market Volume (Metric Tons) and Forecast by Sales Channel, 2015–2030
Table 81: South Asia Vegan Cheese Market Value (US$ Mn) and Forecast by Country, 2015–2030
Table 82: South Asia Vegan Cheese Market Volume (Metric Tons) and Forecast by Country, 2015–2030
Table 83: South Asia Vegan Cheese Market Value (US$ Mn) and Forecast by Product Type, 2015–2030
Table 84: South Asia Vegan Cheese Market Volume (Metric Tons) and Forecast by Product Type, 2015–2030
Table 85: South Asia Vegan Cheese Market Value (US$ Mn) and Forecast by Nature, 2015–2030
Table 86: South Asia Vegan Cheese Market Volume (Metric Tons) and Forecast by Nature, 2015–2030
Table 87: South Asia Vegan Cheese Market Value (US$ Mn) and Forecast by Form, 2015–2030
Table 88: South Asia Vegan Cheese Market Volume (Metric Tons) and Forecast by Form, 2015–2030
Table 89: South Asia Vegan Cheese Market Value (US$ Mn) and Forecast by Protein Source, 2015–2030
Table 90: South Asia Vegan Cheese Market Volume (Metric Tons) and Forecast by Protein Source, 2015–2030
Table 91: South Asia Vegan Cheese Market Value (US$ Mn) and Forecast by End Use, 2015–2030
Table 92: South Asia Vegan Cheese Market Volume (Metric Tons) and Forecast by End Use, 2015–2030
Table 93: South Asia Vegan Cheese Market Value (US$ Mn) and Forecast by Flavor, 2015–2030
Table 94: South Asia Vegan Cheese Market Volume (Metric Tons) and Forecast by Flavor, 2015–2030
Table 95: South Asia Vegan Cheese Market Value (US$ Mn) and Forecast by Sales Channel, 2015–2030
Table 96: South Asia Vegan Cheese Market Volume (Metric Tons) and Forecast by Sales Channel, 2015–2030
Table 97: Oceania Vegan Cheese Market Value (US$ Mn) and Forecast by Country, 2015–2030
Table 98: Oceania Vegan Cheese Market Volume (Metric Tons) and Forecast by Country, 2015–2030
Table 99: Oceania Vegan Cheese Market Value (US$ Mn) and Forecast by Product Type, 2015–2030
Table 100: Oceania Vegan Cheese Market Volume (Metric Tons) and Forecast by Product Type, 2015–2030
Table 101: Oceania Vegan Cheese Market Value (US$ Mn) and Forecast by Nature, 2015–2030
Table 102: Oceania Vegan Cheese Market Volume (Metric Tons) and Forecast by Nature, 2015–2030
Table 103: Oceania Vegan Cheese Market Value (US$ Mn) and Forecast by Form, 2015–2030
Table 104: Oceania Vegan Cheese Market Volume (Metric Tons) and Forecast by Form, 2015–2030
Table 105: Oceania Vegan Cheese Market Value (US$ Mn) and Forecast by Protein Source, 2015–2030
Table 106: Oceania Vegan Cheese Market Volume (Metric Tons) and Forecast by Protein Source, 2015–2030
Table 107: Oceania Vegan Cheese Market Value (US$ Mn) and Forecast by End Use, 2015–2030
Table 108: Oceania Vegan Cheese Market Volume (Metric Tons) and Forecast by End Use, 2015–2030
Table 109: Oceania Vegan Cheese Market Value (US$ Mn) and Forecast by Flavor, 2015–2030
Table 110: Oceania Vegan Cheese Market Volume (Metric Tons) and Forecast by Flavor, 2015–2030
Table 111: Oceania Vegan Cheese Market Value (US$ Mn) and Forecast by Sales Channel, 2015–2030
Table 112: Oceania Vegan Cheese Market Volume (Metric Tons) and Forecast by Sales Channel, 2015–2030
Table 113: MEA Vegan Cheese Market Value (US$ Mn) and Forecast by Country, 2015–2030
Table 114: MEA Vegan Cheese Market Volume (Metric Tons) and Forecast by Country, 2015–2030
Table 115: MEA Vegan Cheese Market Value (US$ Mn) and Forecast by Product Type, 2015–2030
Table 116: MEA Vegan Cheese Market Volume (Metric Tons) and Forecast by Product Type, 2015–2030
Table 117: MEA Vegan Cheese Market Value (US$ Mn) and Forecast by Nature, 2015–2030
Table 118: MEA Vegan Cheese Market Volume (Metric Tons) and Forecast by Nature, 2015–2030
Table 119: MEA Vegan Cheese Market Value (US$ Mn) and Forecast by Form, 2015–2030
Table 120: MEA Vegan Cheese Market Volume (Metric Tons) and Forecast by Form, 2015–2030
Table 121: MEA Vegan Cheese Market Value (US$ Mn) and Forecast by Protein Source, 2015–2030
Table 122: MEA Vegan Cheese Market Volume (Metric Tons) and Forecast by Protein Source, 2015–2030
Table 123: MEA Vegan Cheese Market Value (US$ Mn) and Forecast by End Use, 2015–2030
Table 124: MEA Vegan Cheese Market Volume (Metric Tons) and Forecast by End Use, 2015–2030
Table 125: MEA Vegan Cheese Market Value (US$ Mn) and Forecast by Flavor, 2015–2030
Table 126: MEA Vegan Cheese Market Volume (Metric Tons) and Forecast by Flavor, 2015–2030
Table 127: MEA Vegan Cheese Market Value (US$ Mn) and Forecast by Sales Channel, 2015–2030
Table 128: MEA Vegan Cheese Market Volume (Metric Tons) and Forecast by Sales Channel, 2015–2030
List of Figures
Figure 1: Global Vegan Cheese Market Incremental Value (US$ Mn), by Region, 2015, 2020 & 2030
Figure 02: Global Vegan Cheese Market Attractiveness, by Region, 2020 to 2030
Figure 03: Global Vegan Cheese Market Y-o-Y Growth, by Region, 2016 to 2030
Figure 04: Global Vegan Cheese Market Attractiveness, by Nature, 2020 to 2030
Figure 05: Global Vegan Cheese Market Incremental Value (US$ Mn), by Nature, 2015, 2020 & 2030
Figure 06: Global Vegan Cheese Market Attractiveness, by Product Type, 2020 to 2030
Figure 07: Global Vegan Cheese Market Incremental Value (US$ Mn), by Product Type, 2015, 2020 & 2030
Figure 08: Global Vegan Cheese Market Attractiveness, by Form, 2020 to 2030
Figure 09: Global Vegan Cheese Market Incremental Value (US$ Mn), by Form, 2015, 2020 & 2030
Figure 10: Global Vegan Cheese Market Attractiveness, by Protein Source, 2020 to 2030
Figure 11: Global Vegan Cheese Market Incremental Value (US$ Mn), by Protein Source, 2015, 2020 & 2030
Figure 12: Global Vegan Cheese Market Attractiveness, by End Use, 2020 to 2030
Figure 13: Global Vegan Cheese Market Incremental Value (US$ Mn), by End Use, 2015, 2020 & 2030
Figure 14: Global Vegan Cheese Market Attractiveness, by Flavor, 2020 to 2030
Figure 15: Global Vegan Cheese Market Incremental Value (US$ Mn), by Flavor, 2015, 2020 & 2030
Figure 16: Global Vegan Cheese Market Attractiveness, by Sales Channel, 2020 to 2030
Figure 17: Global Vegan Cheese Market Incremental Value (US$ Mn), by Sales Channel, 2015, 2020 & 2030
Figure 18: North America Vegan Cheese Market Incremental Value (US$ Mn), by Country, 2015, 2020 & 2030
Figure 19: North America Vegan Cheese Market Attractiveness, by Country, 2020 to 2030
Figure 20: North America Vegan Cheese Market Y-o-Y Growth, by Country, 2016 to 2030
Figure 21: North America Vegan Cheese Market Attractiveness, by Nature, 2020 to 2030
Figure 22: North America Vegan Cheese Market Incremental Value (US$ Mn), by Nature, 2015, 2020 & 2030
Figure 23: North America Vegan Cheese Market Incremental Value (US$ Mn), by Product Type, 2015, 2020 & 2030
Figure 24: North America Vegan Cheese Market Attractiveness, by Product Type, 2020 to 2030
Figure 25: North America Vegan Cheese Market Attractiveness, by Form, 2020 to 2030
Figure 26: North America Vegan Cheese Market Incremental Value (US$ Mn), by Form, 2015, 2020 & 2030
Figure 27: North America Vegan Cheese Market Attractiveness, by Protein Source, 2020 to 2030
Figure 28: North America Vegan Cheese Market Incremental Value (US$ Mn), by Protein Source, 2015, 2020 & 2030
Figure 29: North America Vegan Cheese Market Attractiveness, by End Use, 2020 to 2030
Figure 30: North America Vegan Cheese Market Incremental Value (US$ Mn), by End Use, 2015, 2020 & 2030
Figure 31: North America Vegan Cheese Market Attractiveness, by Flavor, 2020 to 2030
Figure 32: North America Vegan Cheese Market Incremental Value (US$ Mn), by Flavor, 2015, 2020 & 2030
Figure 33: North America Vegan Cheese Market Attractiveness, by Sales Channel, 2020 to 2030
Figure 34: North America Vegan Cheese Market Incremental Value (US$ Mn), by Sales Channel, 2015, 2020 & 2030
Figure 35: Latin America Vegan Cheese Market Incremental Value (US$ Mn), by Country, 2015, 2020 & 2030
Figure 36: Latin America Vegan Cheese Market Attractiveness, by Country, 2020 to 2030
Figure 37: Latin America Vegan Cheese Market Y-o-Y Growth, by Country, 2016 to 2030
Figure 38: Latin America Vegan Cheese Market Attractiveness, by Nature, 2020 to 2030
Figure 39: Latin America Vegan Cheese Market Incremental Value (US$ Mn), by Nature, 2015, 2020 & 2030
Figure 40: Latin America Vegan Cheese Market Attractiveness, by Product Type, 2020 to 2030
Figure 41: Latin America Vegan Cheese Market Incremental Value (US$ Mn), by Product Type, 2015, 2020 & 2030
Figure 42: Latin America Vegan Cheese Market Attractiveness, by Form, 2020 to 2030
Figure 43: Latin America Vegan Cheese Market Incremental Value (US$ Mn), by Form, 2015, 2020 & 2030
Figure 44: Latin America Vegan Cheese Market Attractiveness, by Protein Source, 2020 to 2030
Figure 45: Latin America Vegan Cheese Market Incremental Value (US$ Mn), by Protein Source, 2015, 2020 & 2030
Figure 46: Latin America Vegan Cheese Market Attractiveness, by End Use, 2020 to 2030
Figure 47: Latin America Vegan Cheese Market Incremental Value (US$ Mn), by End Use, 2015, 2020 & 2030
Figure 48: Latin America Vegan Cheese Market Attractiveness, by Flavor, 2020 to 2030
Figure 49: Latin America Vegan Cheese Market Incremental Value (US$ Mn), by Flavor, 2015, 2020 & 2030
Figure 50: Latin America Vegan Cheese Market Attractiveness, by Sales Channel, 2020 to 2030
Figure 51: Latin America Vegan Cheese Market Incremental Value (US$ Mn), by Sales Channel, 2015, 2020 & 2030
Figure 52: Europe Vegan Cheese Market Incremental Value (US$ Mn), by Country, 2015, 2020 & 2030
Figure 53: Europe Vegan Cheese Market Attractiveness, by Country, 2020 to 2030
Figure 54: Europe Vegan Cheese Market Y-o-Y Growth, by Country, 2016 to 2030
Figure 55: Europe Vegan Cheese Market Attractiveness, by Nature, 2020 to 2030
Figure 56: Europe Vegan Cheese Market Incremental Value (US$ Mn), by Nature, 2015, 2020 & 2030
Figure 57: Europe Vegan Cheese Market Attractiveness, by Product Type, 2020 to 2030
Figure 58: Europe Vegan Cheese Market Incremental Value (US$ Mn), by Product Type, 2015, 2020 & 2030
Figure 59: Europe Vegan Cheese Market Attractiveness, by Form, 2020 to 2030
Figure 60: Europe Vegan Cheese Market Incremental Value (US$ Mn), by Form, 2015, 2020 & 2030
Figure 61: Europe Vegan Cheese Market Attractiveness, by Protein Source, 2020 to 2030
Figure 62: Europe Vegan Cheese Market Incremental Value (US$ Mn), by Protein Source, 2015, 2020 & 2030
Figure 63: Europe Vegan Cheese Market Attractiveness, by End Use, 2020 to 2030
Figure 64: Europe Vegan Cheese Market Incremental Value (US$ Mn), by End Use, 2015, 2020 & 2030
Figure 65: Europe Vegan Cheese Market Attractiveness, by Flavor, 2020 to 2030
Figure 66: Europe Vegan Cheese Market Incremental Value (US$ Mn), by Flavor, 2015, 2020 & 2030
Figure 67: Europe Vegan Cheese Market Attractiveness, by Sales Channel, 2020 to 2030
Figure 68: Europe Vegan Cheese Market Incremental Value (US$ Mn), by Sales Channel, 2015, 2020 & 2030
Figure 69: East Asia Vegan Cheese Market Incremental Value (US$ Mn), by Country, 2015, 2020 & 2030
Figure 70: East Asia Vegan Cheese Market Attractiveness, by Country, 2020 to 2030
Figure 71: East Asia Vegan Cheese Market Y-o-Y Growth, by Country, 2016 to 2030
Figure 72: East Asia Vegan Cheese Market Attractiveness, by Nature, 2020 to 2030
Figure 73: East Asia Vegan Cheese Market Incremental Value (US$ Mn), by Nature, 2015, 2020 & 2030
Figure 74: East Asia Vegan Cheese Market Attractiveness, by Product Type, 2020 to 2030
Figure 75: East Asia Vegan Cheese Market Incremental Value (US$ Mn), by Product Type, 2015, 2020 & 2030
Figure 76: East Asia Vegan Cheese Market Attractiveness, by Form, 2020 to 2030
Figure 77: East Asia Vegan Cheese Market Incremental Value (US$ Mn), by Form, 2015, 2020 & 2030
Figure 78: East Asia Vegan Cheese Market Attractiveness, by Protein Source, 2020 to 2030
Figure 79: East Asia Vegan Cheese Market Incremental Value (US$ Mn), by Protein Source, 2015, 2020 & 2030
Figure 80: East Asia Vegan Cheese Market Attractiveness, by End Use, 2020 to 2030
Figure 81: East Asia Vegan Cheese Market Incremental Value (US$ Mn), by End Use, 2015, 2020 & 2030
Figure 82: East Asia Vegan Cheese Market Attractiveness, by Flavor, 2020 to 2030
Figure 83: East Asia Vegan Cheese Market Incremental Value (US$ Mn), by Flavor, 2015, 2020 & 2030
Figure 84: East Asia Vegan Cheese Market Attractiveness, by Sales Channel, 2020 to 2030
Figure 85: East Asia Vegan Cheese Market Incremental Value (US$ Mn), by Sales Channel, 2015, 2020 & 2030
Figure 86: South Asia Vegan Cheese Market Incremental Value (US$ Mn), by Country, 2015, 2020 & 2030
Figure 87: South Asia Vegan Cheese Market Attractiveness, by Country, 2020 to 2030
Figure 88: South Asia Vegan Cheese Market Y-o-Y Growth, by Country, 2016 to 2030
Figure 89: South Asia Vegan Cheese Market Attractiveness, by Nature, 2020 to 2030
Figure 90: South Asia Vegan Cheese Market Incremental Value (US$ Mn), by Nature, 2015, 2020 & 2030
Figure 91: South Asia Vegan Cheese Market Attractiveness, by Product Type, 2020 to 2030
Figure 92: South Asia Vegan Cheese Market Incremental Value (US$ Mn), by Product Type, 2015, 2020 & 2030
Figure 93: South Asia Vegan Cheese Market Attractiveness, by Form, 2020 to 2030
Figure 94: South Asia Vegan Cheese Market Incremental Value (US$ Mn), by Form, 2015, 2020 & 2030
Figure 95: South Asia Vegan Cheese Market Attractiveness, by Protein Source, 2020 to 2030
Figure 96: South Asia Vegan Cheese Market Incremental Value (US$ Mn), by Protein Source, 2015, 2020 & 2030
Figure 97: South Asia Vegan Cheese Market Attractiveness, by End Use, 2020 to 2030
Figure 98: South Asia Vegan Cheese Market Incremental Value (US$ Mn), by End Use, 2015, 2020 & 2030
Figure 99: South Asia Vegan Cheese Market Attractiveness, by Flavor, 2020 to 2030
Figure 100: South Asia Vegan Cheese Market Incremental Value (US$ Mn), by Flavor, 2015, 2020 & 2030
Figure 101: South Asia Vegan Cheese Market Attractiveness, by Sales Channel, 2020 to 2030
Figure 102: South Asia Vegan Cheese Market Incremental Value (US$ Mn), by Sales Channel, 2015, 2020 & 2030
Figure 103: Oceania Vegan Cheese Market Incremental Value (US$ Mn), by Country, 2015, 2020 & 2030
Figure 104: Oceania Vegan Cheese Market Attractiveness, by Country, 2020 to 2030
Figure 105: Oceania Vegan Cheese Market Y-o-Y Growth, by Country, 2016 to 2030
Figure 106: Oceania Vegan Cheese Market Attractiveness, by Nature, 2020 to 2030
Figure 107: Oceania Vegan Cheese Market Incremental Value (US$ Mn), by Nature, 2015, 2020 & 2030
Figure 108: Oceania Vegan Cheese Market Attractiveness, by Product Type, 2020 to 2030
Figure 109: Oceania Vegan Cheese Market Incremental Value (US$ Mn), by Product Type, 2015, 2020 & 2030
Figure 110: Oceania Vegan Cheese Market Attractiveness, by Form, 2020 to 2030
Figure 111: Oceania Vegan Cheese Market Incremental Value (US$ Mn), by Form, 2015, 2020 & 2030
Figure 112: Oceania Vegan Cheese Market Attractiveness, by Protein Source, 2020 to 2030
Figure 113: Oceania Vegan Cheese Market Incremental Value (US$ Mn), by Protein Source, 2015, 2020 & 2030
Figure 114: Oceania Vegan Cheese Market Attractiveness, by End Use, 2020 to 2030
Figure 115: Oceania Vegan Cheese Market Incremental Value (US$ Mn), by End Use, 2015, 2020 & 2030
Figure 116: Oceania Vegan Cheese Market Attractiveness, by Flavor, 2020 to 2030
Figure 117: Oceania Vegan Cheese Market Incremental Value (US$ Mn), by Flavor, 2015, 2020 & 2030
Figure 118: Oceania Vegan Cheese Market Attractiveness, by Sales Channel, 2020 to 2030
Figure 119: Oceania Vegan Cheese Market Incremental Value (US$ Mn), by Sales Channel, 2015, 2020 & 2030
Figure 120: MEA Vegan Cheese Market Incremental Value (US$ Mn), by Country, 2015, 2020 & 2030
Figure 121: MEA Vegan Cheese Market Attractiveness, by Country, 2020 to 2030
Figure 122: MEA Vegan Cheese Market Y-o-Y Growth, by Country, 2016 to 2030
Figure 123: MEA Vegan Cheese Market Attractiveness, by Nature, 2020 to 2030
Figure 124: MEA Vegan Cheese Market Incremental Value (US$ Mn), by Nature, 2015, 2020 & 2030
Figure 125: MEA Vegan Cheese Market Attractiveness, by Product Type, 2020 to 2030
Figure 126: MEA Vegan Cheese Market Incremental Value (US$ Mn), by Product Type, 2015, 2020 & 2030
Figure 127: MEA Vegan Cheese Market Attractiveness, by Form, 2020 to 2030
Figure 128: MEA Vegan Cheese Market Incremental Value (US$ Mn), by Form, 2015, 2020 & 2030
Figure 129: MEA Vegan Cheese Market Attractiveness, by Protein Source, 2020 to 2030
Figure 130: MEA Vegan Cheese Market Incremental Value (US$ Mn), by Protein Source, 2015, 2020 & 2030
Figure 131: MEA Vegan Cheese Market Attractiveness, by End Use, 2020 to 2030
Figure 132: MEA Vegan Cheese Market Incremental Value (US$ Mn), by End Use, 2015, 2020 & 2030
Figure 133: MEA Vegan Cheese Market Attractiveness, by Flavor, 2020 to 2030
Figure 134: MEA Vegan Cheese Market Incremental Value (US$ Mn), by Flavor, 2015, 2020 & 2030
Figure 135: MEA Vegan Cheese Market Attractiveness, by Sales Channel, 2020 to 2030
Figure 136: MEA Vegan Cheese Market Incremental Value (US$ Mn), by Sales Channel, 2015, 2020 & 2030
Copyright © Transparency Market Research, Inc. All Rights reserved
Trust Online

Vegan Cheese Market Forecast, 2020-2030