
Reports
Reports
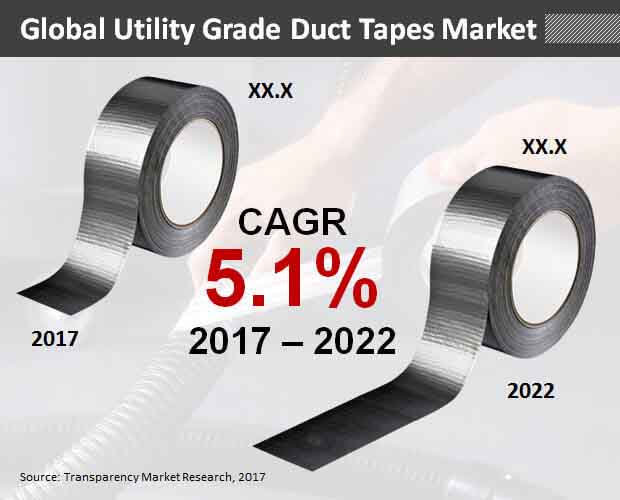
The global utility grade duct tapes market is likely to exhibit steady growth in the coming years due to a number of factors, including the rapid growth of the packaging industry and the construction sector, which account for dominant shares in the global consumption of utility grade duct tapes. Utility grade duct tapes account for a variety of roles in a number of sectors due to their diverse applicability for packaging as well as repairing. Growing availability of environmentally viable utility grade duct tapes is also likely to be a major driver for the global utility grade duct tapes market in the coming years. The utility grade duct tapes market is thus likely to exhibit robust growth over the 2017-2022 forecast period, with Transparency Market Research predicting a strong 5.1% CAGR for the utility grade duct tapes market between 2017 and 2022.
Transparency Market Research estimates the global utility grade duct tapes market to reach a valuation of US$395.1 mn by the end of 2017 and further rise to US$505.6 mn by the end of 2022.
The report segments the global utility grade duct tapes market by application into sealing, repairing, holding, waterproofing, strapping, and others. Of these, repairing is likely to remain the leading application of the global utility grade duct tapes market over the 2017-2022 forecast period. Duct tapes present significant benefits in repairing tasks due to their high adhesive power, especially in the case of advanced modern alternatives, and their easy applicability. Repairing is likely to account for 31.8% of the global utility grade duct tapes market by the end of 2017, with a valuation of US$125.5 mn. The valuation of the repairing segment is likely to rise to US$163.6 mn by the end of 2022, with the segment likely to account for 32.4% of the global utility grade duct tapes market.
Geographically, the global utility grade duct tapes market is segmented into North America, Latin America, Europe, the Middle East and Africa, Asia Pacific except Japan, and Japan. Of these, Europe is likely to remain the dominant contributor to the global utility grade duct tapes market over the 2017-2022 forecast period due to the steady rise in demand for DIY applications in Europe. The utility grade duct tapes market in Europe is likely to exhibit a strong 3.7% CAGR over the 2017-2022 forecast period, rising to a valuation of US$152.5 mn by the end of 2022.
Despite the dominance of Europe in the global utility grade duct tapes market, North America and Asia Pacific except Japan are also likely to exhibit significant promise for the global utility grade duct tapes market due to the rising presence of the market in these regions. The North America utility grade duct tapes market is likely to exhibit a strong 5.9% CAGR between 2017 and 2022, rising to a valuation of US$145.7 mn by the end of 2022. The APEJ market for utility grade duct tapes is likely to rise to US$138.8 mn by the end of 2022 at a strong CAGR of 5.8% over the 2017-2022 forecast period.
Leading companies in the global utility grade duct tapes market include 3M Company, Berry Global Group Inc., Tesa SE Group, Intertape Polymer Group Inc., Shurtape Technologies LLC, Scapa Group Plc, Vibac Group S.p.a., Bolex (Shenzhen) Adhesive Products Co. Ltd., Pro Tapes and Specialties Inc., and Shanghai Yongguan Adhesive Products Co. Ltd.
1. Global Utility Grade Duct Tapes Market - Executive Summary
2. Global Utility Grade Duct Tapes Market Overview
2.1. Introduction
2.1.1. Global Utility Grade Duct Tapes Market Taxonomy
2.1.2. Global Utility Grade Duct Tapes Market Definition
2.2. Global Utility Grade Duct Tapes Market Size (US$ Mn) and Forecast, 2012-2022
2.2.1. Global Utility Grade Duct Tapes Market Y-o-Y Growth
2.3. Global Utility Grade Duct Tapes Market Dynamics
2.4. Supply Chain
2.5. Cost Structure
2.6. Pricing Analysis
2.7. Raw Material Sourcing Strategy and Analysis
2.8. List of Distributors
2.9. Key Participants Market Presence (Intensity Map) By Region
3. Global Utility Grade Duct Tapes Market Analysis and Forecast By End Use Industry Type
3.1. Global Utility Grade Duct Tapes Market Size and Forecast By End Use Industry Type, 2012-2022
3.1.1. Sealing Market Size and Forecast, 2012-2022
3.1.1.1. Revenue (US$ Mn) Comparison, By Region
3.1.1.2. Market Share Comparison, By Region
3.1.1.3. Y-o-Y growth Comparison, By Region
3.1.2. Repairing Market Size and Forecast, 2012-2022
3.1.2.1. Revenue (US$ Mn) Comparison, By Region
3.1.2.2. Market Share Comparison, By Region
3.1.2.3. Y-o-Y growth Comparison, By Region
3.1.3. Holding Market Size and Forecast, 2012-2022
3.1.3.1. Revenue (US$ Mn) Comparison, By Region
3.1.3.2. Market Share Comparison, By Region
3.1.3.3. Y-o-Y growth Comparison, By Region
3.1.4. Waterproofing Market Size and Forecast, 2012-2022
3.1.4.1. Revenue (US$ Mn) Comparison, By Region
3.1.4.2. Market Share Comparison, By Region
3.1.4.3. Y-o-Y growth Comparison, By Region
3.1.5. Strapping Market Size and Forecast, 2012-2022
3.1.5.1. Revenue (US$ Mn) Comparison, By Region
3.1.5.2. Market Share Comparison, By Region
3.1.5.3. Y-o-Y growth Comparison, By Region
3.1.6. Others Market Size and Forecast, 2012-2022
3.1.6.1. Revenue (US$ Mn) Comparison, By Region
3.1.6.2. Market Share Comparison, By Region
3.1.6.3. Y-o-Y growth Comparison, By Region
4. Global Utility Grade Duct Tapes Market Analysis and Forecast By Backing Material Type
4.1. Global Utility Grade Duct Tapes Market Size and Forecast By Backing Material Type, 2012-2022
4.1.1. Plastic Market Size and Forecast, 2012-2022
4.1.1.1. Revenue (US$ Mn) Comparison, By Region
4.1.1.2. Market Share Comparison, By Region
4.1.1.3. Y-o-Y growth Comparison, By Region
4.1.2. Foil Market Size and Forecast, 2012-2022
4.1.2.1. Revenue (US$ Mn) Comparison, By Region
4.1.2.2. Market Share Comparison, By Region
4.1.2.3. Y-o-Y growth Comparison, By Region
4.1.3. Cloth Market Size and Forecast, 2012-2022
4.1.3.1. Revenue (US$ Mn) Comparison, By Region
4.1.3.2. Market Share Comparison, By Region
4.1.3.3. Y-o-Y growth Comparison, By Region
5. Global Utility Grade Duct Tapes Market Analysis and Forecast By End Use Industry
5.1. Global Utility Grade Duct Tapes Market Size and Forecast By End Use Industry, 2012-2022
5.1.1. HVAC Industry Market Size and Forecast, 2012-2022
5.1.1.1. Revenue (US$ Mn) Comparison, By Region
5.1.1.2. Market Share Comparison, By Region
5.1.1.3. Y-o-Y growth Comparison, By Region
5.1.2. Building & Construction Market Size and Forecast, 2012-2022
5.1.2.1. Revenue (US$ Mn) Comparison, By Region
5.1.2.2. Market Share Comparison, By Region
5.1.2.3. Y-o-Y growth Comparison, By Region
5.1.3. Shipping & Logistics Market Size and Forecast, 2012-2022
5.1.3.1. Revenue (US$ Mn) Comparison, By Region
5.1.3.2. Market Share Comparison, By Region
5.1.3.3. Y-o-Y growth Comparison, By Region
5.1.4. DIY Activities Market Size and Forecast, 2012-2022
5.1.4.1. Revenue (US$ Mn) Comparison, By Region
5.1.4.2. Market Share Comparison, By Region
5.1.4.3. Y-o-Y growth Comparison, By Region
5.1.5. Other Industries Market Size and Forecast, 2012-2022
5.1.5.1. Revenue (US$ Mn) Comparison, By Region
5.1.5.2. Market Share Comparison, By Region
5.1.5.3. Y-o-Y growth Comparison, By Region
6. Global Utility Grade Duct Tapes Market Analysis and Forecast By Region
6.1. Global Utility Grade Duct Tapes Market Size and Forecast, 2012-2022
6.1.1. North America Utility Grade Duct Tapes Market Size and Forecast, 2012-2022
6.1.1.1. Revenue (US$ Mn) Comparison, By End Use Industry Type
6.1.1.2. Revenue (US$ Mn) Comparison, By Backing Material Type
6.1.1.3. Revenue (US$ Mn) Comparison, By End Use Industry
6.1.2. Latin America Utility Grade Duct Tapes Market Size and Forecast, 2012-2022
6.1.2.1. Revenue (US$ Mn) Comparison, By End Use Industry Type
6.1.2.2. Revenue (US$ Mn) Comparison, By Backing Material Type
6.1.2.3. Revenue (US$ Mn) Comparison, By End Use Industry
6.1.3. Europe Utility Grade Duct Tapes Market Size and Forecast, 2012-2022
6.1.3.1. Revenue (US$ Mn) Comparison, By End Use Industry Type
6.1.3.2. Revenue (US$ Mn) Comparison, By Backing Material Type
6.1.3.3. Revenue (US$ Mn) Comparison, By End Use Industry
6.1.4. Japan Utility Grade Duct Tapes Market Size and Forecast, 2012-2022
6.1.4.1. Revenue (US$ Mn) Comparison, By End Use Industry Type
6.1.4.2. Revenue (US$ Mn) Comparison, By Backing Material Type
6.1.4.3. Revenue (US$ Mn) Comparison, By End Use Industry
6.1.5. APEJ Utility Grade Duct Tapes Market Size and Forecast, 2012-2022
6.1.5.1. Revenue (US$ Mn) Comparison, By End Use Industry Type
6.1.5.2. Revenue (US$ Mn) Comparison, By Backing Material Type
6.1.5.3. Revenue (US$ Mn) Comparison, By End Use Industry
6.1.6. MEA Utility Grade Duct Tapes Market Size and Forecast, 2012-2022
6.1.6.1. Revenue (US$ Mn) Comparison, By End Use Industry Type
6.1.6.2. Revenue (US$ Mn) Comparison, By Backing Material Type
6.1.6.3. Revenue (US$ Mn) Comparison, By End Use Industry
7. North America Utility Grade Duct Tapes Market Analysis and Forecast, By Country, 2012-2022
7.1. US Utility Grade Duct Tapes Market Size and Forecast, 2012-2022
7.1.1. Revenue (US$ Mn) Comparison, By End Use Industry Type
7.1.2. Revenue (US$ Mn) Comparison, By Backing Material Type
7.1.3. Revenue (US$ Mn) Comparison, By End Use Industry
7.2. Canada Utility Grade Duct Tapes Market Size and Forecast, 2012-2022
7.2.1. Revenue (US$ Mn) Comparison, By End Use Industry Type
7.2.2. Revenue (US$ Mn) Comparison, By Backing Material Type
7.2.3. Revenue (US$ Mn) Comparison, By End Use Industry
8. Latin America Utility Grade Duct Tapes Market Analysis and Forecast, By Country, 2012-2022
8.1. Brazil Utility Grade Duct Tapes Market Size and Forecast, 2012-2022
8.1.1. Revenue (US$ Mn) Comparison, By End Use Industry Type
8.1.2. Revenue (US$ Mn) Comparison, By Backing Material Type
8.1.3. Revenue (US$ Mn) Comparison, By End Use Industry
8.2. Mexico Utility Grade Duct Tapes Market Size and Forecast, 2012-2022
8.2.1. Revenue (US$ Mn) Comparison, By End Use Industry Type
8.2.2. Revenue (US$ Mn) Comparison, By Backing Material Type
8.2.3. Revenue (US$ Mn) Comparison, By End Use Industry
8.3. Rest of Latin America Utility Grade Duct Tapes Market Size and Forecast, 2012-2022
8.3.1. Revenue (US$ Mn) Comparison, By End Use Industry Type
8.3.2. Revenue (US$ Mn) Comparison, By Backing Material Type
8.3.3. Revenue (US$ Mn) Comparison, By End Use Industry
9. Europe Utility Grade Duct Tapes Market Analysis and Forecast, By Country, 2012-2022
9.1. Germany Utility Grade Duct Tapes Market Size and Forecast, 2012-2022
9.1.1. Revenue (US$ Mn) Comparison, By End Use Industry Type
9.1.2. Revenue (US$ Mn) Comparison, By Backing Material Type
9.1.3. Revenue (US$ Mn) Comparison, By End Use Industry
9.2. UK Utility Grade Duct Tapes Market Size and Forecast, 2012-2022
9.2.1. Revenue (US$ Mn) Comparison, By End Use Industry Type
9.2.2. Revenue (US$ Mn) Comparison, By Backing Material Type
9.2.3. Revenue (US$ Mn) Comparison, By End Use Industry
9.3. France Utility Grade Duct Tapes Market Size and Forecast, 2012-2022
9.3.1. Revenue (US$ Mn) Comparison, By End Use Industry Type
9.3.2. Revenue (US$ Mn) Comparison, By Backing Material Type
9.3.3. Revenue (US$ Mn) Comparison, By End Use Industry
9.4. Spain Utility Grade Duct Tapes Market Size and Forecast, 2012-2022
9.4.1. Revenue (US$ Mn) Comparison, By End Use Industry Type
9.4.2. Revenue (US$ Mn) Comparison, By Backing Material Type
9.4.3. Revenue (US$ Mn) Comparison, By End Use Industry
9.5. Italy Utility Grade Duct Tapes Market Size and Forecast, 2012-2022
9.5.1. Revenue (US$ Mn) Comparison, By End Use Industry Type
9.5.2. Revenue (US$ Mn) Comparison, By Backing Material Type
9.5.3. Revenue (US$ Mn) Comparison, By End Use Industry
9.6. Rest of Europe Utility Grade Duct Tapes Market Size and Forecast, 2012-2022
9.6.1. Revenue (US$ Mn) Comparison, By End Use Industry Type
9.6.2. Revenue (US$ Mn) Comparison, By Backing Material Type
9.6.3. Revenue (US$ Mn) Comparison, By End Use Industry
10. Japan Utility Grade Duct Tapes Market Analysis and Forecast, By Country, 2012-2022
10.1. Japan Utility Grade Duct Tapes Market Size and Forecast, 2012-2022
10.1.1. Revenue (US$ Mn) Comparison, By End Use Industry Type
10.1.2. Revenue (US$ Mn) Comparison, By Backing Material Type
10.1.3. Revenue (US$ Mn) Comparison, By End Use Industry
11. APEJ Utility Grade Duct Tapes Market Analysis and Forecast, By Country, 2012-2022
11.1. China Utility Grade Duct Tapes Market Size and Forecast, 2012-2022
11.1.1. Revenue (US$ Mn) Comparison, By End Use Industry Type
11.1.2. Revenue (US$ Mn) Comparison, By Backing Material Type
11.1.3. Revenue (US$ Mn) Comparison, By End Use Industry
11.2. India Utility Grade Duct Tapes Market Size and Forecast, 2012-2022
11.2.1. Revenue (US$ Mn) Comparison, By End Use Industry Type
11.2.2. Revenue (US$ Mn) Comparison, By Backing Material Type
11.2.3. Revenue (US$ Mn) Comparison, By End Use Industry
11.3. Malaysia Utility Grade Duct Tapes Market Size and Forecast, 2012-2022
11.3.1. Revenue (US$ Mn) Comparison, By End Use Industry Type
11.3.2. Revenue (US$ Mn) Comparison, By Backing Material Type
11.3.3. Revenue (US$ Mn) Comparison, By End Use Industry
11.4. Thailand Utility Grade Duct Tapes Market Size and Forecast, 2012-2022
11.4.1. Revenue (US$ Mn) Comparison, By End Use Industry Type
11.4.2. Revenue (US$ Mn) Comparison, By Backing Material Type
11.4.3. Revenue (US$ Mn) Comparison, By End Use Industry
11.5. Australia Utility Grade Duct Tapes Market Size and Forecast, 2012-2022
11.5.1. Revenue (US$ Mn) Comparison, By End Use Industry Type
11.5.2. Revenue (US$ Mn) Comparison, By Backing Material Type
11.5.3. Revenue (US$ Mn) Comparison, By End Use Industry
11.6. Rest of APEJ Utility Grade Duct Tapes Market Size and Forecast, 2012-2022
11.6.1. Revenue (US$ Mn) Comparison, By End Use Industry Type
11.6.2. Revenue (US$ Mn) Comparison, By Backing Material Type
11.6.3. Revenue (US$ Mn) Comparison, By End Use Industry
12. MEA Utility Grade Duct Tapes Market Analysis and Forecast, By Country, 2012-2022
12.1. GCC Countries Utility Grade Duct Tapes Market Size and Forecast, 2012-2022
12.1.1. Revenue (US$ Mn) Comparison, By End Use Industry Type
12.1.2. Revenue (US$ Mn) Comparison, By Backing Material Type
12.1.3. Revenue (US$ Mn) Comparison, By End Use Industry
12.2. South Africa Utility Grade Duct Tapes Market Size and Forecast, 2012-2022
12.2.1. Revenue (US$ Mn) Comparison, By End Use Industry Type
12.2.2. Revenue (US$ Mn) Comparison, By Backing Material Type
12.2.3. Revenue (US$ Mn) Comparison, By End Use Industry
12.3. Nigeria Utility Grade Duct Tapes Market Size and Forecast, 2012-2022
12.3.1. Revenue (US$ Mn) Comparison, By End Use Industry Type
12.3.2. Revenue (US$ Mn) Comparison, By Backing Material Type
12.3.3. Revenue (US$ Mn) Comparison, By End Use Industry
12.4. Rest of MEA Utility Grade Duct Tapes Market Size and Forecast, 2012-2022
12.4.1. Revenue (US$ Mn) Comparison, By End Use Industry Type
12.4.2. Revenue (US$ Mn) Comparison, By Backing Material Type
12.4.3. Revenue (US$ Mn) Comparison, By End Use Industry
13. Global Utility Grade Duct Tapes Market Company Share, Competition Landscape and Company Profiles
13.1. Company Share Analysis
13.2. Competition Landscape
13.3. Company Profiles
13.3.1. 3M Company
13.3.2. Berry Global Group, Inc.
13.3.3. Tesa SE Group
13.3.4. Intertape Polymer Group Inc.
13.3.5. Shurtape Technologies LLC
13.3.6. Scapa Group plc
13.3.7. Vibac Group S.p.a.
13.3.8. Bolex (Shenzhen) Adhesive Products Co. Ltd.
13.3.9. Pro Tapes & Specialties, Inc.
13.3.10. Shanghai Yongguan adhesive products Co,.Ltd
14. Research Methodology
15. Secondary and Primary Sources
16. Assumptions and Acronyms
17. Disclaimer
List of Tables
TABLE 1 Global Utility Grade Duct Tapes Market Value (US$ Mn), 2012-2016
TABLE 2 Global Utility Grade Duct Tapes Market Value (US$ Mn), 2017-2022
TABLE 3 Global Utility Grade Duct Tapes Market Value (US$ Mn) and Y-o-Y, 2015-2022
TABLE 4 Global Sealing Segment Value (US$ Mn), By Region 2012-2016
TABLE 5 Global Sealing Segment Value (US$ Mn), By Region 2017-2022
TABLE 6 Global Sealing Segment Market Share, By Region 2012-2016
TABLE 7 Global Sealing Segment Market Share, By Region 2017-2022
TABLE 8 Global Sealing Segment Y-o-Y, By Region 2015-2022
TABLE 9 Global Repairing Segment Value (US$ Mn), By Region 2012-2016
TABLE 10 Global Repairing Segment Value (US$ Mn), By Region 2017-2022
TABLE 11 Global Repairing Segment Market Share, By Region 2012-2016
TABLE 12 Global Repairing Segment Market Share, By Region 2017-2022
TABLE 13 Global Repairing Segment Y-o-Y, By Region 2015-2022
TABLE 14 Global Holding Segment Value (US$ Mn), By Region 2012-2016
TABLE 15 Global Holding Segment Value (US$ Mn), By Region 2017-2022
TABLE 16 Global Holding Segment Market Share, By Region 2012-2016
TABLE 17 Global Holding Segment Market Share, By Region 2017-2022
TABLE 18 Global Holding Segment Y-o-Y, By Region 2015-2022
TABLE 19 Global Waterproofing Segment Value (US$ Mn), By Region 2012-2016
TABLE 20 Global Waterproofing Segment Value (US$ Mn), By Region 2017-2022
TABLE 21 Global Waterproofing Segment Market Share, By Region 2012-2016
TABLE 22 Global Waterproofing Segment Market Share, By Region 2017-2022
TABLE 23 Global Waterproofing Segment Y-o-Y, By Region 2015-2022
TABLE 24 Global Strapping Segment Value (US$ Mn), By Region 2012-2016
TABLE 25 Global Strapping Segment Value (US$ Mn), By Region 2017-2022
TABLE 26 Global Strapping Segment Market Share, By Region 2012-2016
TABLE 27 Global Strapping Segment Market Share, By Region 2017-2022
TABLE 28 Global Strapping Segment Y-o-Y, By Region 2015-2022
TABLE 29 Global Others Segment Value (US$ Mn), By Region 2012-2016
TABLE 30 Global Others Segment Value (US$ Mn), By Region 2017-2022
TABLE 31 Global Others Segment Market Share, By Region 2012-2016
TABLE 32 Global Others Segment Market Share, By Region 2017-2022
TABLE 33 Global Others Segment Y-o-Y, By Region 2015-2022
TABLE 34 Global Plastic Segment Value (US$ Mn), By Region 2012-2016
TABLE 35 Global Plastic Segment Value (US$ Mn), By Region 2017-2022
TABLE 36 Global Plastic Segment Market Share, By Region 2012-2016
TABLE 37 Global Plastic Segment Market Share, By Region 2017-2022
TABLE 38 Global Plastic Segment Y-o-Y, By Region 2015-2022
TABLE 39 Global Foil Segment Value (US$ Mn), By Region 2012-2016
TABLE 40 Global Foil Segment Value (US$ Mn), By Region 2017-2022
TABLE 41 Global Foil Segment Market Share, By Region 2012-2016
TABLE 42 Global Foil Segment Market Share, By Region 2017-2022
TABLE 43 Global Foil Segment Y-o-Y, By Region 2015-2022
TABLE 44 Global Cloth Segment Value (US$ Mn), By Region 2012-2016
TABLE 45 Global Cloth Segment Value (US$ Mn), By Region 2017-2022
TABLE 46 Global Cloth Segment Market Share, By Region 2012-2016
TABLE 47 Global Cloth Segment Market Share, By Region 2017-2022
TABLE 48 Global Cloth Segment Y-o-Y, By Region 2015-2022
TABLE 49 Global HVAC Industry Segment Value (US$ Mn), By Region 2012-2016
TABLE 50 Global HVAC Industry Segment Value (US$ Mn), By Region 2017-2022
TABLE 51 Global HVAC Industry Segment Market Share, By Region 2012-2016
TABLE 52 Global HVAC Industry Segment Market Share, By Region 2017-2022
TABLE 53 Global HVAC Industry Segment Y-o-Y, By Region 2015-2022
TABLE 54 Global Building & Construction Segment Value (US$ Mn), By Region 2012-2016
TABLE 55 Global Building & Construction Segment Value (US$ Mn), By Region 2017-2022
TABLE 56 Global Building & Construction Segment Market Share, By Region 2012-2016
TABLE 57 Global Building & Construction Segment Market Share, By Region 2017-2022
TABLE 58 Global Building & Construction Segment Y-o-Y, By Region 2015-2022
TABLE 59 Global Shipping & Logistics Segment Value (US$ Mn), By Region 2012-2016
TABLE 60 Global Shipping & Logistics Segment Value (US$ Mn), By Region 2017-2022
TABLE 61 Global Shipping & Logistics Segment Market Share, By Region 2012-2016
TABLE 62 Global Shipping & Logistics Segment Market Share, By Region 2017-2022
TABLE 63 Global Shipping & Logistics Segment Y-o-Y, By Region 2015-2022
TABLE 64 Global DIY Activities Segment Value (US$ Mn), By Region 2012-2016
TABLE 65 Global DIY Activities Segment Value (US$ Mn), By Region 2017-2022
TABLE 66 Global DIY Activities Segment Market Share, By Region 2012-2016
TABLE 67 Global DIY Activities Segment Market Share, By Region 2017-2022
TABLE 68 Global DIY Activities Segment Y-o-Y, By Region 2015-2022
TABLE 69 Global Other Industries Segment Value (US$ Mn), By Region 2012-2016
TABLE 70 Global Other Industries Segment Value (US$ Mn), By Region 2017-2022
TABLE 71 Global Other Industries Segment Market Share, By Region 2012-2016
TABLE 72 Global Other Industries Segment Market Share, By Region 2017-2022
TABLE 73 Global Other Industries Segment Y-o-Y, By Region 2015-2022
TABLE 74 North America Utility Grade Duct Tapes Market Value (US$ Mn), By Application Type 2012-2016
TABLE 75 North America Utility Grade Duct Tapes Market Value (US$ Mn), By Application Type 2017-2022
TABLE 76 North America Utility Grade Duct Tapes Market Value (US$ Mn), By Backing Material Type2012-2016
TABLE 77 North America Utility Grade Duct Tapes Market Value (US$ Mn), By Backing Material Type2017-2022
TABLE 78 North America Utility Grade Duct Tapes Market Value (US$ Mn), By End Use Industry2012-2016
TABLE 79 North America Utility Grade Duct Tapes Market Value (US$ Mn), By End Use Industry2017-2022
TABLE 80 Latin America Utility Grade Duct Tapes Market Value (US$ Mn), By Application Type 2012-2016
TABLE 81 Latin America Utility Grade Duct Tapes Market Value (US$ Mn), By Application Type 2017-2022
TABLE 82 Latin America Utility Grade Duct Tapes Market Value (US$ Mn), By Backing Material Type2012-2016
TABLE 83 Latin America Utility Grade Duct Tapes Market Value (US$ Mn), By Backing Material Type2017-2022
TABLE 84 Latin America Utility Grade Duct Tapes Market Value (US$ Mn), By End Use Industry2012-2016
TABLE 85 Latin America Utility Grade Duct Tapes Market Value (US$ Mn), By End Use Industry2017-2022
TABLE 86 Europe Utility Grade Duct Tapes Market Value (US$ Mn), By Application Type 2012-2016
TABLE 87 Europe Utility Grade Duct Tapes Market Value (US$ Mn), By Application Type 2017-2022
TABLE 88 Europe Utility Grade Duct Tapes Market Value (US$ Mn), By Backing Material Type2012-2016
TABLE 89 Europe Utility Grade Duct Tapes Market Value (US$ Mn), By Backing Material Type2017-2022
TABLE 90 Europe Utility Grade Duct Tapes Market Value (US$ Mn), By End Use Industry2012-2016
TABLE 91 Europe Utility Grade Duct Tapes Market Value (US$ Mn), By End Use Industry2017-2022
TABLE 92 Japan Utility Grade Duct Tapes Market Value (US$ Mn), By Application Type 2012-2016
TABLE 93 Japan Utility Grade Duct Tapes Market Value (US$ Mn), By Application Type 2017-2022
TABLE 94 Japan Utility Grade Duct Tapes Market Value (US$ Mn), By Backing Material Type2012-2016
TABLE 95 Japan Utility Grade Duct Tapes Market Value (US$ Mn), By Backing Material Type2017-2022
TABLE 96 Japan Utility Grade Duct Tapes Market Value (US$ Mn), By End Use Industry2012-2016
TABLE 97 Japan Utility Grade Duct Tapes Market Value (US$ Mn), By End Use Industry2017-2022
TABLE 98 APEJ Utility Grade Duct Tapes Market Value (US$ Mn), By Application Type 2012-2016
TABLE 99 APEJ Utility Grade Duct Tapes Market Value (US$ Mn), By Application Type 2017-2022
TABLE 100 APEJ Utility Grade Duct Tapes Market Value (US$ Mn), By Backing Material Type2012-2016
TABLE 101 APEJ Utility Grade Duct Tapes Market Value (US$ Mn), By Backing Material Type2017-2022
TABLE 102 APEJ Utility Grade Duct Tapes Market Value (US$ Mn), By End Use Industry2012-2016
TABLE 103 APEJ Utility Grade Duct Tapes Market Value (US$ Mn), By End Use Industry2017-2022
TABLE 104 MEA Utility Grade Duct Tapes Market Value (US$ Mn), By Application Type 2012-2016
TABLE 105 MEA Utility Grade Duct Tapes Market Value (US$ Mn), By Application Type 2017-2022
TABLE 106 MEA Utility Grade Duct Tapes Market Value (US$ Mn), By Backing Material Type2012-2016
TABLE 107 MEA Utility Grade Duct Tapes Market Value (US$ Mn), By Backing Material Type2017-2022
TABLE 108 MEA Utility Grade Duct Tapes Market Value (US$ Mn), By End Use Industry2012-2016
TABLE 109 MEA Utility Grade Duct Tapes Market Value (US$ Mn), By End Use Industry2017-2022
TABLE 110 US Utility Grade Duct Tapes Market Value (US$ Mn), By Application Type 2012-2016
TABLE 111 US Utility Grade Duct Tapes Market Value (US$ Mn), By Application Type 2017-2022
TABLE 112 US Utility Grade Duct Tapes Market Value (US$ Mn), By Backing Material Type2012-2016
TABLE 113 US Utility Grade Duct Tapes Market Value (US$ Mn), By Backing Material Type2017-2022
TABLE 114 US Utility Grade Duct Tapes Market Value (US$ Mn), By End Use Industry2012-2016
TABLE 115 US Utility Grade Duct Tapes Market Value (US$ Mn), By End Use Industry2017-2022
TABLE 116 Canada Utility Grade Duct Tapes Market Value (US$ Mn), By Application Type 2012-2016
TABLE 117 Canada Utility Grade Duct Tapes Market Value (US$ Mn), By Application Type 2017-2022
TABLE 118 Canada Utility Grade Duct Tapes Market Value (US$ Mn), By Backing Material Type2012-2016
TABLE 119 Canada Utility Grade Duct Tapes Market Value (US$ Mn), By Backing Material Type2017-2022
TABLE 120 Canada Utility Grade Duct Tapes Market Value (US$ Mn), By End Use Industry2012-2016
TABLE 121 Canada Utility Grade Duct Tapes Market Value (US$ Mn), By End Use Industry2017-2022
TABLE 122 Brazil Utility Grade Duct Tapes Market Value (US$ Mn), By Application Type 2012-2016
TABLE 123 Brazil Utility Grade Duct Tapes Market Value (US$ Mn), By Application Type 2017-2022
TABLE 124 Brazil Utility Grade Duct Tapes Market Value (US$ Mn), By Backing Material Type2012-2016
TABLE 125 Brazil Utility Grade Duct Tapes Market Value (US$ Mn), By Backing Material Type2017-2022
TABLE 126 Brazil Utility Grade Duct Tapes Market Value (US$ Mn), By End Use Industry2012-2016
TABLE 127 Brazil Utility Grade Duct Tapes Market Value (US$ Mn), By End Use Industry2017-2022
TABLE 128 Mexico Utility Grade Duct Tapes Market Value (US$ Mn), By Application Type 2012-2016
TABLE 129 Mexico Utility Grade Duct Tapes Market Value (US$ Mn), By Application Type 2017-2022
TABLE 130 Mexico Utility Grade Duct Tapes Market Value (US$ Mn), By Backing Material Type2012-2016
TABLE 131 Mexico Utility Grade Duct Tapes Market Value (US$ Mn), By Backing Material Type2017-2022
TABLE 132 Mexico Utility Grade Duct Tapes Market Value (US$ Mn), By End Use Industry2012-2016
TABLE 133 Mexico Utility Grade Duct Tapes Market Value (US$ Mn), By End Use Industry2017-2022
TABLE 134 Rest of Latin America Utility Grade Duct Tapes Market Value (US$ Mn), By Application Type 2012-2016
TABLE 135 Rest of Latin America Utility Grade Duct Tapes Market Value (US$ Mn), By Application Type 2017-2022
TABLE 136 Rest of Latin America Utility Grade Duct Tapes Market Value (US$ Mn), By Backing Material Type2012-2016
TABLE 137 Rest of Latin America Utility Grade Duct Tapes Market Value (US$ Mn), By Backing Material Type2017-2022
TABLE 138 Rest of Latin America Utility Grade Duct Tapes Market Value (US$ Mn), By End Use Industry2012-2016
TABLE 139 Rest of Latin America Utility Grade Duct Tapes Market Value (US$ Mn), By End Use Industry2017-2022
TABLE 140 Germany Utility Grade Duct Tapes Market Value (US$ Mn), By Application Type 2012-2016
TABLE 141 Germany Utility Grade Duct Tapes Market Value (US$ Mn), By Application Type 2017-2022
TABLE 142 Germany Utility Grade Duct Tapes Market Value (US$ Mn), By Backing Material Type2012-2016
TABLE 143 Germany Utility Grade Duct Tapes Market Value (US$ Mn), By Backing Material Type2017-2022
TABLE 144 Germany Utility Grade Duct Tapes Market Value (US$ Mn), By End Use Industry2012-2016
TABLE 145 Germany Utility Grade Duct Tapes Market Value (US$ Mn), By End Use Industry2017-2022
TABLE 146 UK Utility Grade Duct Tapes Market Value (US$ Mn), By Application Type 2012-2016
TABLE 147 UK Utility Grade Duct Tapes Market Value (US$ Mn), By Application Type 2017-2022
TABLE 148 UK Utility Grade Duct Tapes Market Value (US$ Mn), By Backing Material Type2012-2016
TABLE 149 UK Utility Grade Duct Tapes Market Value (US$ Mn), By Backing Material Type2017-2022
TABLE 150 UK Utility Grade Duct Tapes Market Value (US$ Mn), By End Use Industry2012-2016
TABLE 151 UK Utility Grade Duct Tapes Market Value (US$ Mn), By End Use Industry2017-2022
TABLE 152 France Utility Grade Duct Tapes Market Value (US$ Mn), By Application Type 2012-2016
TABLE 153 France Utility Grade Duct Tapes Market Value (US$ Mn), By Application Type 2017-2022
TABLE 154 France Utility Grade Duct Tapes Market Value (US$ Mn), By Backing Material Type2012-2016
TABLE 155 France Utility Grade Duct Tapes Market Value (US$ Mn), By Backing Material Type2017-2022
TABLE 156 France Utility Grade Duct Tapes Market Value (US$ Mn), By End Use Industry2012-2016
TABLE 157 France Utility Grade Duct Tapes Market Value (US$ Mn), By End Use Industry2017-2022
TABLE 158 Spain Utility Grade Duct Tapes Market Value (US$ Mn), By Application Type 2012-2016
TABLE 159 Spain Utility Grade Duct Tapes Market Value (US$ Mn), By Application Type 2017-2022
TABLE 160 Spain Utility Grade Duct Tapes Market Value (US$ Mn), By Backing Material Type2012-2016
TABLE 161 Spain Utility Grade Duct Tapes Market Value (US$ Mn), By Backing Material Type2017-2022
TABLE 162 Spain Utility Grade Duct Tapes Market Value (US$ Mn), By End Use Industry2012-2016
TABLE 163 Spain Utility Grade Duct Tapes Market Value (US$ Mn), By End Use Industry2017-2022
TABLE 164 Italy Utility Grade Duct Tapes Market Value (US$ Mn), By Application Type 2012-2016
TABLE 165 Italy Utility Grade Duct Tapes Market Value (US$ Mn), By Application Type 2017-2022
TABLE 166 Italy Utility Grade Duct Tapes Market Value (US$ Mn), By Backing Material Type2012-2016
TABLE 167 Italy Utility Grade Duct Tapes Market Value (US$ Mn), By Backing Material Type2017-2022
TABLE 168 Italy Utility Grade Duct Tapes Market Value (US$ Mn), By End Use Industry2012-2016
TABLE 169 Italy Utility Grade Duct Tapes Market Value (US$ Mn), By End Use Industry2017-2022
TABLE 170 Rest of Europe Utility Grade Duct Tapes Market Value (US$ Mn), By Application Type 2012-2016
TABLE 171 Rest of Europe Utility Grade Duct Tapes Market Value (US$ Mn), By Application Type 2017-2022
TABLE 172 Rest of Europe Utility Grade Duct Tapes Market Value (US$ Mn), By Backing Material Type2012-2016
TABLE 173 Rest of Europe Utility Grade Duct Tapes Market Value (US$ Mn), By Backing Material Type2017-2022
TABLE 174 Rest of Europe Utility Grade Duct Tapes Market Value (US$ Mn), By End Use Industry2012-2016
TABLE 175 Rest of Europe Utility Grade Duct Tapes Market Value (US$ Mn), By End Use Industry2017-2022
TABLE 176 Japan Utility Grade Duct Tapes Market Value (US$ Mn), By Application Type 2012-2016
TABLE 177 Japan Utility Grade Duct Tapes Market Value (US$ Mn), By Application Type 2017-2022
TABLE 178 Japan Utility Grade Duct Tapes Market Value (US$ Mn), By Backing Material Type2012-2016
TABLE 179 Japan Utility Grade Duct Tapes Market Value (US$ Mn), By Backing Material Type2017-2022
TABLE 180 Japan Utility Grade Duct Tapes Market Value (US$ Mn), By End Use Industry2012-2016
TABLE 181 Japan Utility Grade Duct Tapes Market Value (US$ Mn), By End Use Industry2017-2022
TABLE 182 China Utility Grade Duct Tapes Market Value (US$ Mn), By Application Type 2012-2016
TABLE 183 China Utility Grade Duct Tapes Market Value (US$ Mn), By Application Type 2017-2022
TABLE 184 China Utility Grade Duct Tapes Market Value (US$ Mn), By Backing Material Type2012-2016
TABLE 185 China Utility Grade Duct Tapes Market Value (US$ Mn), By Backing Material Type2017-2022
TABLE 186 China Utility Grade Duct Tapes Market Value (US$ Mn), By End Use Industry2012-2016
TABLE 187 China Utility Grade Duct Tapes Market Value (US$ Mn), By End Use Industry2017-2022
TABLE 188 India Utility Grade Duct Tapes Market Value (US$ Mn), By Application Type 2012-2016
TABLE 189 India Utility Grade Duct Tapes Market Value (US$ Mn), By Application Type 2017-2022
TABLE 190 India Utility Grade Duct Tapes Market Value (US$ Mn), By Backing Material Type2012-2016
TABLE 191 India Utility Grade Duct Tapes Market Value (US$ Mn), By Backing Material Type2017-2022
TABLE 192 India Utility Grade Duct Tapes Market Value (US$ Mn), By End Use Industry2012-2016
TABLE 193 India Utility Grade Duct Tapes Market Value (US$ Mn), By End Use Industry2017-2022
TABLE 194 Malaysia Utility Grade Duct Tapes Market Value (US$ Mn), By Application Type 2012-2016
TABLE 195 Malaysia Utility Grade Duct Tapes Market Value (US$ Mn), By Application Type 2017-2022
TABLE 196 Malaysia Utility Grade Duct Tapes Market Value (US$ Mn), By Backing Material Type2012-2016
TABLE 197 Malaysia Utility Grade Duct Tapes Market Value (US$ Mn), By Backing Material Type2017-2022
TABLE 198 Malaysia Utility Grade Duct Tapes Market Value (US$ Mn), By End Use Industry2012-2016
TABLE 199 Malaysia Utility Grade Duct Tapes Market Value (US$ Mn), By End Use Industry2017-2022
TABLE 200 Thailand Utility Grade Duct Tapes Market Value (US$ Mn), By Application Type 2012-2016
TABLE 201 Thailand Utility Grade Duct Tapes Market Value (US$ Mn), By Application Type 2017-2022
TABLE 202 Thailand Utility Grade Duct Tapes Market Value (US$ Mn), By Backing Material Type2012-2016
TABLE 203 Thailand Utility Grade Duct Tapes Market Value (US$ Mn), By Backing Material Type2017-2022
TABLE 204 Thailand Utility Grade Duct Tapes Market Value (US$ Mn), By End Use Industry2012-2016
TABLE 205 Thailand Utility Grade Duct Tapes Market Value (US$ Mn), By End Use Industry2017-2022
TABLE 206 Australia Utility Grade Duct Tapes Market Value (US$ Mn), By Application Type 2012-2016
TABLE 207 Australia Utility Grade Duct Tapes Market Value (US$ Mn), By Application Type 2017-2022
TABLE 208 Australia Utility Grade Duct Tapes Market Value (US$ Mn), By Backing Material Type2012-2016
TABLE 209 Australia Utility Grade Duct Tapes Market Value (US$ Mn), By Backing Material Type2017-2022
TABLE 210 Australia Utility Grade Duct Tapes Market Value (US$ Mn), By End Use Industry2012-2016
TABLE 211 Australia Utility Grade Duct Tapes Market Value (US$ Mn), By End Use Industry2017-2022
TABLE 212 Rest of APEJ Utility Grade Duct Tapes Market Value (US$ Mn), By Application Type 2012-2016
TABLE 213 Rest of APEJ Utility Grade Duct Tapes Market Value (US$ Mn), By Application Type 2017-2022
TABLE 214 Rest of APEJ Utility Grade Duct Tapes Market Value (US$ Mn), By Backing Material Type2012-2016
TABLE 215 Rest of APEJ Utility Grade Duct Tapes Market Value (US$ Mn), By Backing Material Type2017-2022
TABLE 216 Rest of APEJ Utility Grade Duct Tapes Market Value (US$ Mn), By End Use Industry2012-2016
TABLE 217 Rest of APEJ Utility Grade Duct Tapes Market Value (US$ Mn), By End Use Industry2017-2022
TABLE 218 GCC Countries Utility Grade Duct Tapes Market Value (US$ Mn), By Application Type 2012-2016
TABLE 219 GCC Countries Utility Grade Duct Tapes Market Value (US$ Mn), By Application Type 2017-2022
TABLE 220 GCC Countries Utility Grade Duct Tapes Market Value (US$ Mn), By Backing Material Type2012-2016
TABLE 221 GCC Countries Utility Grade Duct Tapes Market Value (US$ Mn), By Backing Material Type2017-2022
TABLE 222 GCC Countries Utility Grade Duct Tapes Market Value (US$ Mn), By End Use Industry2012-2016
TABLE 223 GCC Countries Utility Grade Duct Tapes Market Value (US$ Mn), By End Use Industry2017-2022
TABLE 224 South Africa Utility Grade Duct Tapes Market Value (US$ Mn), By Application Type 2012-2016
TABLE 225 South Africa Utility Grade Duct Tapes Market Value (US$ Mn), By Application Type 2017-2022
TABLE 226 South Africa Utility Grade Duct Tapes Market Value (US$ Mn), By Backing Material Type2012-2016
TABLE 227 South Africa Utility Grade Duct Tapes Market Value (US$ Mn), By Backing Material Type2017-2022
TABLE 228 South Africa Utility Grade Duct Tapes Market Value (US$ Mn), By End Use Industry2012-2016
TABLE 229 South Africa Utility Grade Duct Tapes Market Value (US$ Mn), By End Use Industry2017-2022
TABLE 230 Nigeria Utility Grade Duct Tapes Market Value (US$ Mn), By Application Type 2012-2016
TABLE 231 Nigeria Utility Grade Duct Tapes Market Value (US$ Mn), By Application Type 2017-2022
TABLE 232 Nigeria Utility Grade Duct Tapes Market Value (US$ Mn), By Backing Material Type2012-2016
TABLE 233 Nigeria Utility Grade Duct Tapes Market Value (US$ Mn), By Backing Material Type2017-2022
TABLE 234 Nigeria Utility Grade Duct Tapes Market Value (US$ Mn), By End Use Industry2012-2016
TABLE 235 Nigeria Utility Grade Duct Tapes Market Value (US$ Mn), By End Use Industry2017-2022
TABLE 236 Rest of MEA Utility Grade Duct Tapes Market Value (US$ Mn), By Application Type 2012-2016
TABLE 237 Rest of MEA Utility Grade Duct Tapes Market Value (US$ Mn), By Application Type 2017-2022
TABLE 238 Rest of MEA Utility Grade Duct Tapes Market Value (US$ Mn), By Backing Material Type2012-2016
TABLE 239 Rest of MEA Utility Grade Duct Tapes Market Value (US$ Mn), By Backing Material Type2017-2022
TABLE 240 Rest of MEA Utility Grade Duct Tapes Market Value (US$ Mn), By End Use Industry2012-2016
TABLE 241 Rest of MEA Utility Grade Duct Tapes Market Value (US$ Mn), By End Use Industry2017-2022
List of Figures
FIG. 1 Global Utility Grade Duct Tapes Market Value (US$ Mn), 2012-2016
FIG. 2 Global Utility Grade Duct Tapes Market Value (US$ Mn) Forecast, 2017-2022
FIG. 3 Global Utility Grade Duct Tapes Market Value (US$ Mn) and Y-o-Y, 2015-2022
FIG. 4 Global Sealing Segment Market Value (US$ Mn) By Region, 2012-2016
FIG. 5 Global Sealing Segment Market Value (US$ Mn) By Region, 2017-2022
FIG. 6 Global Sealing Segment Y-o-Y Growth Rate, By Region, 2015-2022
FIG. 7 Global Repairing Segment Market Value (US$ Mn) By Region, 2012-2016
FIG. 8 Global Repairing Segment Market Value (US$ Mn) By Region, 2017-2022
FIG. 9 Global Repairing Segment Y-o-Y Growth Rate, By Region, 2015-2022
FIG. 10 Global Holding Segment Market Value (US$ Mn) By Region, 2012-2016
FIG. 11 Global Holding Segment Market Value (US$ Mn) By Region, 2017-2022
FIG. 12 Global Holding Segment Y-o-Y Growth Rate, By Region, 2015-2022
FIG. 13 Global Waterproofing Segment Market Value (US$ Mn) By Region, 2012-2016
FIG. 14 Global Waterproofing Segment Market Value (US$ Mn) By Region, 2017-2022
FIG. 15 Global Waterproofing Segment Y-o-Y Growth Rate, By Region, 2015-2022
FIG. 16 Global Strapping Segment Market Value (US$ Mn) By Region, 2012-2016
FIG. 17 Global Strapping Segment Market Value (US$ Mn) By Region, 2017-2022
FIG. 18 Global Strapping Segment Y-o-Y Growth Rate, By Region, 2015-2022
FIG. 19 Global Others Segment Market Value (US$ Mn) By Region, 2012-2016
FIG. 20 Global Others Segment Market Value (US$ Mn) By Region, 2017-2022
FIG. 21 Global Others Segment Y-o-Y Growth Rate, By Region, 2015-2022
FIG. 22 Global Plastic Segment Market Value (US$ Mn) By Region, 2012-2016
FIG. 23 Global Plastic Segment Market Value (US$ Mn) By Region, 2017-2022
FIG. 24 Global Plastic Segment Y-o-Y Growth Rate, By Region, 2015-2022
FIG. 25 Global Foil Segment Market Value (US$ Mn) By Region, 2012-2016
FIG. 26 Global Foil Segment Market Value (US$ Mn) By Region, 2017-2022
FIG. 27 Global Foil Segment Y-o-Y Growth Rate, By Region, 2015-2022
FIG. 28 Global Cloth Segment Market Value (US$ Mn) By Region, 2012-2016
FIG. 29 Global Cloth Segment Market Value (US$ Mn) By Region, 2017-2022
FIG. 30 Global Cloth Segment Y-o-Y Growth Rate, By Region, 2015-2022
FIG. 31 Global HVAC Industry Segment Market Value (US$ Mn) By Region, 2012-2016
FIG. 32 Global HVAC Industry Segment Market Value (US$ Mn) By Region, 2017-2022
FIG. 33 Global HVAC Industry Segment Y-o-Y Growth Rate, By Region, 2015-2022
FIG. 34 Global Building & Construction Segment Market Value (US$ Mn) By Region, 2012-2016
FIG. 35 Global Building & Construction Segment Market Value (US$ Mn) By Region, 2017-2022
FIG. 36 Global Building & Construction Segment Y-o-Y Growth Rate, By Region, 2015-2022
FIG. 37 Global Shipping & Logistics Segment Market Value (US$ Mn) By Region, 2012-2016
FIG. 38 Global Shipping & Logistics Segment Market Value (US$ Mn) By Region, 2017-2022
FIG. 39 Global Shipping & Logistics Segment Y-o-Y Growth Rate, By Region, 2015-2022
FIG. 40 Global DIY Activities Segment Market Value (US$ Mn) By Region, 2012-2016
FIG. 41 Global DIY Activities Segment Market Value (US$ Mn) By Region, 2017-2022
FIG. 42 Global DIY Activities Segment Y-o-Y Growth Rate, By Region, 2015-2022
FIG. 43 Global Other Industries Segment Market Value (US$ Mn) By Region, 2012-2016
FIG. 44 Global Other Industries Segment Market Value (US$ Mn) By Region, 2017-2022
FIG. 45 Global Other Industries Segment Y-o-Y Growth Rate, By Region, 2015-2022
FIG. 46 North America Utility Grade Duct Tapes Market Value (US$ Mn), By Application Type 2012-2016
FIG. 47 North America Utility Grade Duct Tapes Market Value (US$ Mn), By Application Type 2017-2022
FIG. 48 North America Utility Grade Duct Tapes Market Value (US$ Mn), By Backing Material Type2012-2016
FIG. 49 North America Utility Grade Duct Tapes Market Value (US$ Mn), By Backing Material Type2017-2022
FIG. 50 North America Utility Grade Duct Tapes Market Value (US$ Mn), By End Use Industry2012-2016
FIG. 51 North America Utility Grade Duct Tapes Market Value (US$ Mn), By End Use Industry2017-2022
FIG. 52 Latin America Utility Grade Duct Tapes Market Value (US$ Mn), By Application Type 2012-2016
FIG. 53 Latin America Utility Grade Duct Tapes Market Value (US$ Mn), By Application Type 2017-2022
FIG. 54 Latin America Utility Grade Duct Tapes Market Value (US$ Mn), By Backing Material Type2012-2016
FIG. 55 Latin America Utility Grade Duct Tapes Market Value (US$ Mn), By Backing Material Type2017-2022
FIG. 56 Latin America Utility Grade Duct Tapes Market Value (US$ Mn), By End Use Industry2012-2016
FIG. 57 Latin America Utility Grade Duct Tapes Market Value (US$ Mn), By End Use Industry2017-2022
FIG. 58 Europe Utility Grade Duct Tapes Market Value (US$ Mn), By Application Type 2012-2016
FIG. 59 Europe Utility Grade Duct Tapes Market Value (US$ Mn), By Application Type 2017-2022
FIG. 60 Europe Utility Grade Duct Tapes Market Value (US$ Mn), By Backing Material Type2012-2016
FIG. 61 Europe Utility Grade Duct Tapes Market Value (US$ Mn), By Backing Material Type2017-2022
FIG. 62 Europe Utility Grade Duct Tapes Market Value (US$ Mn), By End Use Industry2012-2016
FIG. 63 Europe Utility Grade Duct Tapes Market Value (US$ Mn), By End Use Industry2017-2022
FIG. 64 Japan Utility Grade Duct Tapes Market Value (US$ Mn), By Application Type 2012-2016
FIG. 65 Japan Utility Grade Duct Tapes Market Value (US$ Mn), By Application Type 2017-2022
FIG. 66 Japan Utility Grade Duct Tapes Market Value (US$ Mn), By Backing Material Type2012-2016
FIG. 67 Japan Utility Grade Duct Tapes Market Value (US$ Mn), By Backing Material Type2017-2022
FIG. 68 Japan Utility Grade Duct Tapes Market Value (US$ Mn), By End Use Industry2012-2016
FIG. 69 Japan Utility Grade Duct Tapes Market Value (US$ Mn), By End Use Industry2017-2022
FIG. 70 APEJ Utility Grade Duct Tapes Market Value (US$ Mn), By Application Type 2012-2016
FIG. 71 APEJ Utility Grade Duct Tapes Market Value (US$ Mn), By Application Type 2017-2022
FIG. 72 APEJ Utility Grade Duct Tapes Market Value (US$ Mn), By Backing Material Type2012-2016
FIG. 73 APEJ Utility Grade Duct Tapes Market Value (US$ Mn), By Backing Material Type2017-2022
FIG. 74 APEJ Utility Grade Duct Tapes Market Value (US$ Mn), By End Use Industry2012-2016
FIG. 75 APEJ Utility Grade Duct Tapes Market Value (US$ Mn), By End Use Industry2017-2022
FIG. 76 MEA Utility Grade Duct Tapes Market Value (US$ Mn), By Application Type 2012-2016
FIG. 77 MEA Utility Grade Duct Tapes Market Value (US$ Mn), By Application Type 2017-2022
FIG. 78 MEA Utility Grade Duct Tapes Market Value (US$ Mn), By Backing Material Type2012-2016
FIG. 79 MEA Utility Grade Duct Tapes Market Value (US$ Mn), By Backing Material Type2017-2022
FIG. 80 MEA Utility Grade Duct Tapes Market Value (US$ Mn), By End Use Industry2012-2016
FIG. 81 MEA Utility Grade Duct Tapes Market Value (US$ Mn), By End Use Industry2017-2022
Copyright © Transparency Market Research, Inc. All Rights reserved
Trust Online

Utility Grade Duct Tapes Market