
Reports
Reports
Savvy participants in the global tonic water market are pitching flavored products to customers in order to up demand and sales. To that end, they are pouring money into research and development of innovative products.
Majorly fuelling the global market for tonic water is the rising disposable income of people on account of industrialization and economic growth. Rapid urbanization too plays a role in stoking demand for it has resulted in increasing intake of alcohol to which tonic water is often added. Apart from that the surging popularity of social media and the internet has had a positive influence on the market too.
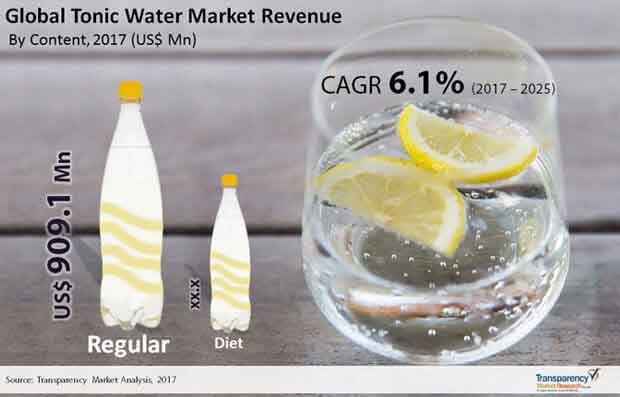
As study by Transparency Market Research projects the global tonic water market to pull in a revenue of US$2.45 bn by 2025-end by rising at a CAGR of 6.1% from 2017 to 2025. The report estimated the market was worth US$1.52 bn in 2017.
The global tonic water market can be segmented based on different parameters. Depending upon application, for example, it can be divided into direct consumption and alcoholic drinks. Of them, the segment of alcoholic drinks grosses most of the revenue in the market on account of the increasing alcohol intake worldwide. This, in turn, has resulted from the changing lifestyles leading to increasing social gatherings and parties, and the popularity of social media and internet, and the growing perception that alcoholic drinks relaxes the mind. The tonic water market in alcoholic drink segment is forecasted to clock a higher CAGR of 6.6% between 2017 and 2025 to become worth US$1.87 bn by 2025, while in direct consumption segment is predicted to rise at a 4.7% CAGR in the same period to attain a value of US$578.4 mn by 2025.
Depending upon the sales channel again, the global market for tonic water can be divided into direct sales and retail sales. The retail sales segment is further divided into modern trade, convenience stores, online retailing, and other retailing formats. The direct sales segment is predicted to expand at a higher CAGR of 7.5% CAGR from 2017 to 2025, while the retail sales segment is expected to register a 5.4% CAGR in the forecast period.
Geographically, North America, Latin America, Asia Pacific, Europe, and the Middle East and Africa are the key regions studied in the report. At present North America and Europe market dominate the global market for tonic water volume-wise. By 2025, the two regions are expected to collectively account for 67% share in the global market. This is because of the surging popularity of gin and vodka in Europe, with which tonic water is usually added.
Asia Pacific is another key market for tonic water which is expected to rise at a steady CAGR of 5.7% during the period between 2017 and 2027 on the back of rapid industrialization and urbanization – the two phenomena that have increased the disposable incomes of people and changed their lifestyles leading to more alcohol intake. Latin America is expected to expand at a CAGR of 4.8% because of changing lifestyles, rising urbanization and increasing per capita income in this region.
Some of the prominent participants in the global tonic water market are Fentimans Ltd., The Coca-Cola Company, Diageo Plc., Q Drinks, White Rock Products Corp., Powell And Mahoney LLC, Fevertree Drinks PLC, Monster Beverage Corporation, MBG International Premium Brands GmbH, East Imperial Superior Beverages, JACK RUDY COCKTAIL CO., Boylan Bottling Co Inc., Casalbor, S.L., Sygama SA, Luscombe Drinks, and Bradley’s Tonic Co.
Tonic water is either mixed with alcoholic drinks or consumed directly. Traditionally, tonic water products are water when combined with gin, whisky, and coffee. Over the past few decades, a few countries have started producing tonic water indigenous, perhaps the most popular is Indian tonic water. Growing popularity of gin in beverages in worldwide populations is a key trend in the expansion of avenues in the tonic water. Another related trend is the growing demand for flavoured beverages. These trends have been increasingly fuelled by the social media fads and aggressive promotion of some brands. Over the years, these brands have been able to launch some exciting products to allure prospective consumers. The growing range of high-quality tonic waters is a key development shaping the emerging trajectories in the tonic water. Consumers are pairing with some of the exotic summer drinks to try something new as refreshments. They are extensively being mixed with quinine. In mature markets, the narrative of tonic water is passing across the borders, which is expanding the horizon for brands in the tonic water. Such brands increasingly leverage the attractiveness of local flavors to promote their products. They can be paired with the variety of spirits.
The COVID-19-led lockdowns has triggered industries to realign their tactical, operational, and strategic frameworks, including in tonic water market. The pandemic has unlocked some new avenues on the back of the growing focus of consumers on their wellbeing and health. Also, in recent months, the possibilities in the tonic water have expanded with people getting attracted to exotic beverages to maintain their health as well satisfy their unique appetites. Further, brands are leveraging digital channels to not just advertise their products by inflating their ad spends, but are using these to reach larger mass. In developing economies, thus, the market is expected to see new demand potential, such as in rural populations if the products are priced competitively.
1. Executive Summary
2. Market Introduction
2.1. Market Definition
2.2. Market Taxonomy
3. Global Tonic Water Market Analysis Scenario
3.1. Pricing Analysis
3.1.1. Pricing Assumptions
3.1.2. Price Projections Per Region
3.2. Market Size (US$ Mn) and Volume (MT) Forecast
3.2.1. Market Size (US$ Mn) and Volume (MT) Y-o-Y Growth
3.2.2. Absolute $ Opportunity
3.3. Industry Value and Supply Chain Analysis
3.3.1. Value Chain
3.3.2. List and Role of Key Participants
4. Market Dynamics
4.1. Macro-economic Factors
4.2. Drivers
4.2.1. Supply Side
4.2.2. Demand Side
4.3. Restraints
4.4. Opportunity
4.5. Trends
4.6. Forecast Factors – Relevance and Impact
5. Global Tonic Water Market Analysis and Forecast, By Region
5.1. Introduction
5.1.1. Basis Point Share (BPS) Analysis, By Region
5.1.2. Y-o-Y Growth Projections, By Region
5.2. Market Size (US$ Mn) and Volume (MT) Forecast, By Region
5.2.1. North America
5.2.2. Europe
5.2.3. APAC
5.2.4. Latin America
5.2.5. Middle East and Africa
5.3. Market Attractiveness Analysis, By Region
6. Global Tonic Water Market Analysis and Forecast, By Content
6.1. Introduction
6.1.1. Basis Point Share (BPS) Analysis, By Content
6.1.2. Y-o-Y Growth Projections, By Content
6.2. Market Size (US$ Mn) and Volume (MT) Forecast, By Content
6.2.1.1. Regular
6.2.1.2. Diet
6.2.2. Market Attractiveness Analysis, By Content
6.3. Prominent Trends
7. Global Tonic Water Market Analysis and Forecast, By Product Type
7.1. Introduction
7.1.1. Basis Point Share (BPS) Analysis, By Product Type
7.1.2. Y-o-Y Growth Projections, By Product Type
7.2. Market Size (US$ Mn) and Volume (MT) Forecast, By Product Type
7.2.1. Non-Flavored
7.2.2. Flavored
7.2.3. Market Attractiveness Analysis, By Product Type
7.3. Prominent Trends
8. Global Tonic Water Market Analysis and Forecast, By Application
8.1. Introduction
8.1.1. Basis Point Share (BPS) Analysis, By Application
8.1.2. Y-o-Y Growth Projections, By Application
8.2. Market Size (US$ Mn) and Volume (MT) Forecast, By Application
8.2.1. Alcoholic Drinks
8.2.2. Direct Consumption
8.3. Market Attractiveness Analysis, By Application
8.4. Prominent Trends
9. Global Tonic Water Market Analysis and Forecast, By Sales Channel
9.1. Introduction
9.1.1. Basis Point Share (BPS) Analysis, By Sales Channel
9.1.2. Y-o-Y Growth Projections, By Sales Channel
9.2. Market Size (US$ Mn) and Volume (MT) Forecast Sales Channel
9.2.1. Direct Sales
9.2.2. Retail Sales
9.2.2.1. Modern Stores
9.2.2.2. Convenience Stores
9.2.2.3. Online Retailing
9.2.2.4. Others
9.3. Market Attractiveness Analysis, By Sales Channel
9.4. Prominent Trends
10. North America Tonic Water Market Analysis and Forecast
10.1. Introduction
10.1.1. Basis Point Share (BPS) Analysis, By Country
10.1.2. Y-o-Y Growth Projections, By Country
10.1.3. Key Trends
10.2. Market Size (US$ Mn) and Volume (MT) Forecast, By Country
10.2.1. U.S.
10.2.2. Canada
10.3.Market Size (US$ Mn) and Volume (MT) Forecast, By Content
10.3.1.1. Regular
10.3.1.2. Diet
10.4. Market Size (US$ Mn) and Volume (MT) Forecast, By Product Type
10.4.1. Non-Flavored
10.4.2. Flavored
10.5. Market Size (US$ Mn) and Volume (MT) Forecast, By Application
10.5.1. Alcoholic Drinks
10.5.2. Direct Consumption
10.6. Market Size (US$ Mn) and Volume (MT) Forecast, By Sales Channel
10.6.1. Direct Sales
10.6.2. Retail Sales
10.6.2.1. Modern Stores
10.6.2.2. Convenience Stores
10.6.2.3. Online Retails
10.6.2.4. Other Retail Format
10.7. Market Attractiveness Analysis
10.7.1. By Content
10.7.2. By Product Type
10.7.3. By Application
10.7.4. By Sales Channel
10.7.5. By Country
10.8. Prominent Trends
10.9. Drivers and Restraints: Impact Analysis
11. Latin America Tonic Water Market Analysis and Forecast
11.1. Introduction
11.1.1. Basis Point Share (BPS) Analysis, By Country
11.1.2. Y-o-Y Growth Projections, By Country
11.1.3. Key Trends
11.2. Market Size (US$ Mn) and Volume (MT) Forecast, By Country
11.2.1. Brazil
11.2.2. Mexico
11.2.3. Rest of Latin America
11.3.Market Size (US$ Mn) and Volume (MT) Forecast, By Content
11.3.1.1. Regular
11.3.1.2. Diet
11.4. Market Size (US$ Mn) and Volume (MT) Forecast, By Product Type
11.4.1. Non-Flavored
11.4.2. Flavored
11.5. Market Size (US$ Mn) and Volume (MT) Forecast, By Application
11.5.1. Alcoholic Drinks
11.5.2. Direct Consumption
11.6. Market Size (US$ Mn) and Volume (MT) Forecast, By Sales Channel
11.6.1. Direct Sales
11.6.2. Retail Sales
11.6.2.1. Modern Stores
11.6.2.2. Convenience Stores
11.6.2.3. Online Retails
11.6.2.4. Other Retail Format
11.7. Market Attractiveness Analysis
11.7.1. By Content
11.7.2. By Product Type
11.7.3. By Application
11.7.4. By Sales Channel
11.7.5. By Country
11.8. Prominent Trends
11.9. Drivers and Restraints: Impact Analysis
12. Europe Tonic Water Market Analysis and Forecast
12.1. Introduction
12.1.1. Basis Point Share (BPS) Analysis, By Country
12.1.2. Y-o-Y Growth Projections, By Country
12.1.3. Key Trends
12.2. Market Size (US$ Mn) and Volume (MT) Forecast, By Country
12.2.1. U.K.
12.2.2. Italy
12.2.3. Spain
12.2.4. France
12.2.5. Germany
12.2.6. NORDIC
12.2.7. BENELUX
12.2.8. Russia
12.2.9. Poland
12.2.10. Rest of Europe
12.3.Market Size (US$ Mn) and Volume (MT) Forecast, By Content
12.3.1.1. Regular
12.3.1.2. Diet
12.4. Market Size (US$ Mn) and Volume (MT) Forecast, By Product Type
12.4.1. Non-Flavored
12.4.2. Flavored
12.5. Market Size (US$ Mn) and Volume (MT) Forecast, By Application
12.5.1. Alcoholic Drinks
12.5.2. Direct Consumption
12.6. Market Size (US$ Mn) and Volume (MT) Forecast, By Sales Channel
12.6.1. Direct Sales
12.6.2. Retail Sales
12.6.2.1. Modern Stores
12.6.2.2. Convenience Stores
12.6.2.3. Online Retails
12.6.2.4. Other Retail Format
12.7. Market Attractiveness Analysis
12.7.1. By Content
12.7.2. By Product Type
12.7.3. By Application
12.7.4. By Sales Channel
12.7.5. By Country
12.8. Prominent Trends
12.9. Drivers and Restraints: Impact Analysis
13. APAC Tonic Water Market Analysis and Forecast
13.1. Introduction
13.1.1. Basis Point Share (BPS) Analysis, By Country
13.1.2. Y-o-Y Growth Projections, By Country
13.1.3. Key Trends
13.2. Market Size (US$ Mn) and Volume (MT) Forecast, By Country
13.2.1. India
13.2.2. China
13.2.3. ASEAN
13.2.4. Australia & New Zealand
13.2.5. Japan
13.2.6. Rest of APAC
13.3.Market Size (US$ Mn) and Volume (MT) Forecast, By Content
13.3.1.1. Regular
13.3.1.2. Diet
13.4. Market Size (US$ Mn) and Volume (MT) Forecast, By Product Type
13.4.1. Non-Flavored
13.4.2. Flavored
13.5. Market Size (US$ Mn) and Volume (MT) Forecast, By Application
13.5.1. Alcoholic Drinks
13.5.2. Direct Consumption
13.6. Market Size (US$ Mn) and Volume (MT) Forecast, By Sales Channel
13.6.1. Direct Sales
13.6.2. Retail Sales
13.6.2.1. Modern Stores
13.6.2.2. Convenience Stores
13.6.2.3. Online Retails
13.6.2.4. Other Retail Format
13.7. Market Attractiveness Analysis
13.7.1. By Content
13.7.2. By Product Type
13.7.3. By Application
13.7.4. By Sales Channel
13.7.5. By Country
13.8. Prominent Trends
13.9. Drivers and Restraints: Impact Analysis
14. Middle East and Africa Tonic Water Market Analysis and Forecast
14.1. Introduction
14.1.1. Basis Point Share (BPS) Analysis, By Country
14.1.2. Y-o-Y Growth Projections, By Country
14.1.3. Key Trends
14.2. Market Size (US$ Mn) and Volume (MT) Forecast, By Country
14.2.1. GCC
14.2.2. South Africa
14.2.3. Rest of MEA
14.3.Market Size (US$ Mn) and Volume (MT) Forecast, By Content
14.3.1.1. Regular
14.3.1.2. Diet
14.4. Market Size (US$ Mn) and Volume (MT) Forecast, By Product Type
14.4.1. Non-Flavored
14.4.2. Flavored
14.5. Market Size (US$ Mn) and Volume (MT) Forecast, By Application
14.5.1. Alcoholic Drinks
14.5.2. Direct Consumption
14.6. Market Size (US$ Mn) and Volume (MT) Forecast, By Sales Channel
14.6.1. Direct Sales
14.6.2. Retail Sales
14.6.2.1. Modern Stores
14.6.2.2. Convenience Stores
14.6.2.3. Online Retails
14.6.2.4. Other Retail Format
14.7. Market Attractiveness Analysis
14.7.1. By Content
14.7.2. By Product Type
14.7.3. By Application
14.7.4. By Sales Channel
14.7.5. By Country
14.8. Prominent Trends
14.9. Drivers and Restraints: Impact Analysis
15. Competition Landscape
15.1. Competition Dashboard
15.2. Market Structure
15.3. Company Profiles (Details–Overview, Product Offerings, Financials, Strategy, Recent Developments)
15.3.1. Fentimans Ltd.
15.3.2. The Coca-Cola Company
15.3.3. Diageo Plc.
15.3.4. Q Drinks
15.3.5. White Rock Products Corp.
15.3.6. Thomas Henry GmbH & Co. KG
15.3.7. Powell And Mahoney LLC
15.3.8. Fevertree Drinks PLC
15.3.9. Dr. Pepper Snapple Group, Inc.
15.3.10. Monster Beverage Corporation
15.3.11. MBG International Premium Brands GmbH
15.3.12. East Imperial Superior Beverages
15.3.13. JACK RUDY COCKTAIL CO.
15.3.14. Boylan Bottling Co Inc.
15.3.15. Casalbor, S.L.
15.3.16. LLANLLYR WATER CO LTD
15.3.17. Shasta Beverages, Inc.
15.3.18. Sygama SA
15.3.19. Luscombe Drinks
15.3.20. Bradley’s Tonic Co.
16. Assumptions and Acronyms Used
17. Research Methodology
List of Tables
Table 01: Global Tonic Water Market Size (US$ Mn) and Volume ('000 Liters) Forecast, by Region, 2016–2025
Table 02: Global Tonic Water Market Size (US$ Mn) and Volume ('000 Liters) Forecast, by Content, 2016–2025
Table 03: Global Tonic Water Market Size (US$ Mn) and Volume ('000 Liters) Forecast, by Product Type, 2016–2025
Table 04: Global Tonic Water Market Size (US$ Mn) and Volume ('000 Liters) Forecast, by Application, 2016–2025
Table 05: Global Tonic Water Market Size (US$ Mn) and Volume ('000 Liters) Forecast, by Sales Channel, 2016–2025
Table 06: Global Tonic Water Market Size (US$ Mn) and Volume ('000 Liters) Forecast, by Retail Sales Segment, 2016–2025
Table 07: North America Tonic Water Market Size (US$ Mn) and Volume ('000 Liters) Forecast, by Country, 2016–2025
Table 08: North America Tonic Water Market Size (US$ Mn) and Volume ('000 Liters) Forecast, by Content, 2016–2025
Table 09: North America Tonic Water Market Size (US$ Mn) and Volume ('000 Liters) Forecast, by Product Type, 2016–2025
Table 10: North America Tonic Water Market Size (US$ Mn) and Volume ('000 Liters) Forecast, by Application, 2016–2025
Table 11: North America Tonic Water Market Size (US$ Mn) and Volume ('000 Liters) Forecast, by Sales Channel, 2016–2025
Table 12: North America Tonic Water Market Size (US$ Mn) and Volume ('000 Liters) Forecast, by Retail Sales Segment, 2016–2025
Table 13: Latin America Tonic Water Market Size (US$ Mn) and Volume ('000 Liters) Forecast, by Country, 2016–2025
Table 14: Latin America Tonic Water Market Size (US$ Mn) and Volume ('000 Liters) Forecast, by Content, 2016–2025
Table 15: Latin America Tonic Water Market Size (US$ Mn) and Volume ('000 Liters) Forecast, by Product Type, 2016–2025
Table 16: Latin America Tonic Water Market Size (US$ Mn) and Volume ('000 Liters) Forecast, by Application, 2016–2025
Table 17: Latin America Tonic Water Market Size (US$ Mn) and Volume ('000 Liters) Forecast, by Sales Channel, 2016–2025
Table 18: Latin America Tonic Water Market Size (US$ Mn) and Volume ('000 Liters) Forecast, by Retail Sales Segment, 2016–2025
Table 19: Europe Tonic Water Volume ('000 Liters) Forecast, by Country, 2016–2025
Table 20: Europe Tonic Water Market Size (US$ Mn) Forecast, by Country, 2016–2025
Table 21: Europe Tonic Water Market Size (US$ Mn) and Volume ('000 Liters) Forecast, by Content, 2016–2025
Table 22: Europe Tonic Water Market Size (US$ Mn) and Volume ('000 Liters) Forecast, by Product Type, 2016–2025
Table 23: Europe Tonic Water Market Size (US$ Mn) and Volume ('000 Liters) Forecast, by Application, 2016–2025
Table 24: Europe Tonic Water Market Size (US$ Mn) and Volume ('000 Liters) Forecast, by Sales Channel, 2016–2025
Table 25: Europe Tonic Water Market Size (US$ Mn) and Volume ('000 Liters) Forecast, by Retail Sales Segment, 2016–2025
Table 26: Latin America Tonic Water Market Size (US$ Mn) and Volume ('000 Liters) Forecast, by Country, 2016–2025
Table 27: APAC Tonic Water Market Size (US$ Mn) and Volume ('000 Liters) Forecast, by Content, 2016–2025
Table 28: APAC Tonic Water Market Size (US$ Mn) and Volume ('000 Liters) Forecast, by Product Type, 2016–2025
Table 29: APAC Tonic Water Market Size (US$ Mn) and Volume ('000 Liters) Forecast, by Application, 2016–2025
Table 30: APAC Tonic Water Market Size (US$ Mn) and Volume ('000 Liters) Forecast, by Sales Channel, 2016–2025
Table 31: APAC Tonic Water Market Size (US$ Mn) and Volume ('000 Liters) Forecast, by Retail Sales Segment, 2016–2025
Table 32: MEA Tonic Water Market Size (US$ Mn) and Volume ('000 Liters) Forecast, by Country, 2016–2025
Table 33: MEA Tonic Water Market Size (US$ Mn) and Volume ('000 Liters) Forecast, by Content, 2016–2025
Table 34: MEA Tonic Water Market Size (US$ Mn) and Volume ('000 Liters) Forecast, by Product Type, 2016–2025
Table 35: MEA Tonic Water Market Size (US$ Mn) and Volume ('000 Liters) Forecast, by Application, 2016–2025
Table 36: MEA Tonic Water Market Size (US$ Mn) and Volume ('000 Liters) Forecast, by Sales Channel, 2016–2025
Table 37: MEA Tonic Water Market Size (US$ Mn) and Volume ('000 Liters) Forecast, by Retail Sales Segment, 2016–2025
List of Figures
Figure 01: Global Tonic Water Market Value (US$ Mn) and Volume ('000 Liters) Forecast, 2016–2025
Figure 02: Global Tonic Water Market Absolute $ Opportunity (US$ Mn), 2016?2025
Figure 03: Global Tonic Water Market Share (%) & BPS Analysis, by Region, 2017 & 2025
Figure 04: Global Tonic Water Market Y-o-Y Growth (%), by Region, 2016–2025
Figure 05: North America Tonic Water Market Absolute $ Opportunity (US$ Mn), 2017–2025
Figure 06: Latin America Tonic Water Market Absolute $ Opportunity (US$ Mn), 2017–2025
Figure 07: Europe Tonic Water Market Absolute $ Opportunity (US$ Mn), 2017–2025
Figure 08: APAC Tonic Water Market Absolute $ Opportunity (US$ Mn), 2017–2025
Figure 09: MEA Tonic Water Market Absolute $ Opportunity (US$ Mn), 2017–2025
Figure 10: Global Tonic Water Market Attractiveness Analysis, by Region, 2017 & 2025
Figure 11: Global Tonic Water Market Share (%) & BPS Analysis, By Content, 2017 & 2025
Figure 12: Global Tonic Water Market Y-o-Y Growth (%), By Content, 2016–2025
Figure 13: Global Tonic Water Market Absolute $ Opportunity (US$ Mn), By Regular Segment, 2017–2025
Figure 14: : Global Tonic Water Market Absolute $ Opportunity (US$ Mn), By Diet Segment, 2017–2025
Figure 15: Global Tonic Water Market Attractiveness Analysis, by Content, 2017 & 2025
Figure 16: Global Tonic Water Market Share (%) & BPS Analysis, by Product Type, 2017 & 2025
Figure 17: Global Tonic Water Market Y-o-Y Growth (%), By Product Type, 2016–2025
Figure 18: Global Tonic Water Market Absolute $ Opportunity (US$ Mn), By Non-Flavored Segment, 2017–2025
Figure 19: : Global Tonic Water Market Absolute $ Opportunity (US$ Mn), By Flavored Segment, 2017–2025
Figure 20: Global Tonic Water Market Attractiveness Analysis, by Product Type, 2017 & 2025
Figure 21: Global Tonic Water Market Share (%) & BPS Analysis, by Application, 2017 & 2025
Figure 22: Global Tonic Water Market Y-o-Y Growth (%), By Application, 2016–2025
Figure 23: Global Tonic Water Market Absolute $ Opportunity (US$ Mn), By Alcoholic Drinks Segment, 2017–2025
Figure 24: : Global Tonic Water Market Absolute $ Opportunity (US$ Mn), By Direct Consumption Segment, 2017–2025
Figure 25: Global Tonic Water Market Attractiveness Analysis, by Application, 2017 & 2025
Figure 26: Global Tonic Water Market Share (%) & BPS Analysis, by Sales Channel, 2017 & 2025
Figure 27: Global Tonic Water Market Y-o-Y Growth (%), By Sales Channel, 2016–2025
Figure 28: Global Tonic Water Market Absolute $ Opportunity (US$ Mn), By Direct Sales Segment, 2017–2025
Figure 29: : Global Tonic Water Market Absolute $ Opportunity (US$ Mn), By Retail Sales Segment, 2017–2025
Figure 30: Global Tonic Water Market Attractiveness Analysis, by Sales Channel, 2017 & 2025
Figure 31: North America Tonic Water Market, Value Share (%), By Country (2016)
Figure 32: North America Tonic Water Market, Value Share (%), By Content (2016)
Figure 33: North America Tonic Water Market, Value Share (%), By Product Type (2016)
Figure 34: North America Tonic Water Market, Value Share (%), By Application (2016)
Figure 35: North America Tonic Water Market Value (US$ Mn), By Sales Channel (2016)
Figure 36: North America Tonic Water Market Value (US$ Mn) and Volume ('000 Liters) Forecast, 2016–2025
Figure 37: North America Tonic Water Market Absolute $ Opportunity (US$ Mn), 2016?2025
Figure 38: North America Tonic Water Market Share (%) & BPS Analysis, By Country, 2017 & 2025
Figure 39: North America Tonic Water Market Y-o-Y Growth (%), By Country, 2016–2025
Figure 40: U.S. Tonic Water Market Absolute $ Opportunity (US$ Mn), 2017–2025
Figure 41: Canada Tonic Water Market Absolute $ Opportunity (US$ Mn), 2017–2025
Figure 42: North America Tonic Water Market Share (%) & BPS Analysis, By Content, 2017 & 2025
Figure 43: North America Tonic Water Market Y-o-Y Growth (%), By Content, 2016–2025
Figure 44: North America Tonic Water Market Absolute $ Opportunity (US$ Mn), By Regular Segment, 2017–2025
Figure 45: North America Tonic Water Market Absolute $ Opportunity (US$ Mn), By Diet Segment, 2017–2025
Figure 46: North America Tonic Water Market Share (%) & BPS Analysis, by Product Type, 2017 & 2025
Figure 47: North America Tonic Water Market Y-o-Y Growth (%), By Product Type, 2016–2025
Figure 48: North America Tonic Water Market Absolute $ Opportunity (US$ Mn), By Non-Flavored Segment, 2017–2025
Figure 49: North America Tonic Water Market Absolute $ Opportunity (US$ Mn), By Flavored Segment, 2017–2025
Figure 50: North America Tonic Water Market Share (%) & BPS Analysis, by Application, 2017 & 2025
Figure 51: North America Tonic Water Market Y-o-Y Growth (%), By Application, 2016–2025
Figure 52: North America Tonic Water Market Absolute $ Opportunity (US$ Mn), By Alcoholic Drinks Segment, 2017–2025
Figure 53: North America Tonic Water Market Absolute $ Opportunity (US$ Mn), By Direct Consumption Segment, 2017–2025
Figure 54: North America Tonic Water Market Share (%) & BPS Analysis, by Sales Channel, 2017 & 2025
Figure 55: North America Tonic Water Market Y-o-Y Growth (%), By Sales Channel, 2016–2025
Figure 56: North America Tonic Water Market Absolute $ Opportunity (US$ Mn), By Direct Sales Segment, 2017–2025
Figure 57: North America Tonic Water Market Absolute $ Opportunity (US$ Mn), By Retail Sales Segment, 2017–2025
Figure 58: North America Tonic Water Market Attractiveness Analysis, by Country, 2017 & 2025
Figure 59: North America Tonic Water Market Attractiveness Analysis, by Content, 2017 & 2025
Figure 60: North America Tonic Water Market Attractiveness Analysis, by Product Type, 2017 & 2025
Figure 61: North America Tonic Water Market Attractiveness Analysis, by Application, 2017 & 2025
Figure 62: North America Tonic Water Market Attractiveness Analysis, by Sales Channel, 2017 & 2025
Figure 63: Latin America Tonic Water Market, Value Share (%), By Country (2016)
Figure 64: Latin America Tonic Water Market, Value Share (%), By Content (2016)
Figure 65: Latin America Tonic Water Market, Value Share (%), By Product Type (2016)
Figure 66: Latin America Tonic Water Market, Value Share (%), By Application (2016)
Figure 67: Latin America Tonic Water Market Value (US$ Mn), By Sales Channel (2016)
Figure 68: Latin America Tonic Water Market Value (US$ Mn) and Volume ('000 Liters) Forecast, 2016–2025
Figure 69: Latin America Tonic Water Market Absolute $ Opportunity (US$ Mn), 2016?2025
Figure 70: Latin America Tonic Water Market Share (%) & BPS Analysis, By Country, 2017 & 2025
Figure 71: Latin America Tonic Water Market Y-o-Y Growth (%), By Country, 2016–2025
Figure 72: Brazil Tonic Water Market Absolute $ Opportunity (US$ Mn), 2017–2025
Figure 73: Mexico Tonic Water Market Absolute $ Opportunity (US$ Mn), 2017–2025
Figure 74: Rest of Latin America Tonic Water Market Absolute $ Opportunity (US$ Mn), 2017–2025
Figure 75: Latin America Tonic Water Market Share (%) & BPS Analysis, By Content, 2017 & 2025
Figure 76: Latin America Tonic Water Market Y-o-Y Growth (%), By Content, 2016–2025
Figure 77: Latin America Tonic Water Market Absolute $ Opportunity (US$ Mn), By Regular Segment, 2017–2025
Figure 78: Latin America Tonic Water Market Absolute $ Opportunity (US$ Mn), By Diet Segment, 2017–2025
Figure 79: Latin America Tonic Water Market Share (%) & BPS Analysis, by Product Type, 2017 & 2025
Figure 80: Latin America Tonic Water Market Y-o-Y Growth (%), By Product Type, 2016–2025
Figure 81: Latin America Tonic Water Market Absolute $ Opportunity (US$ Mn), By Non-Flavored Segment, 2017–2025
Figure 82: Latin America Tonic Water Market Absolute $ Opportunity (US$ Mn), By Flavored Segment, 2017–2025
Figure 83: Latin America Tonic Water Market Share (%) & BPS Analysis, by Application, 2017 & 2025
Figure 84: Latin America Tonic Water Market Y-o-Y Growth (%), By Application, 2016–2025
Figure 85: Latin America Tonic Water Market Absolute $ Opportunity (US$ Mn), By Alcoholic Drinks Segment, 2017–2025
Figure 86: Latin America Tonic Water Market Absolute $ Opportunity (US$ Mn), By Direct Consumption Segment, 2017–2025
Figure 87: Latin America Tonic Water Market Share (%) & BPS Analysis, by Sales Channel, 2017 & 2025
Figure 88: Latin America Tonic Water Market Y-o-Y Growth (%), By Sales Channel, 2016–2025
Figure 89: Latin America Tonic Water Market Absolute $ Opportunity (US$ Mn), By Direct Sales Segment, 2017–2025
Figure 90: Latin America Tonic Water Market Absolute $ Opportunity (US$ Mn), By Retail Sales Segment, 2017–2025
Figure 91: Latin America Tonic Water Market Attractiveness Analysis, by Country, 2017 & 2025
Figure 92: Latin America Tonic Water Market Attractiveness Analysis, by Content, 2017 & 2025
Figure 93: Latin America Tonic Water Market Attractiveness Analysis, by Product Type, 2017 & 2025
Figure 94: Latin America Tonic Water Market Attractiveness Analysis, by Application, 2017 & 2025
Figure 95: Latin America Tonic Water Market Attractiveness Analysis, by Sales Channel, 2017 & 2025
Figure 96: Europe Tonic Water Market, Value Share (%), By Country (2016)
Figure 97: Europe Tonic Water Market, Value Share (%), By Content (2016)
Figure 98: Europe Tonic Water Market, Value Share (%), By Product Type (2016)
Figure 99: Europe Tonic Water Market, Value Share (%), By Application (2016)
Figure 100: Europe Tonic Water Market Value (US$ Mn), By Sales Channel (2016)
Figure 101: Europe Tonic Water Market Value (US$ Mn) and Volume ('000 Liters) Forecast, 2016–2025
Figure 102: Europe Tonic Water Market Absolute $ Opportunity (US$ Mn), 2016?2025
Figure 103: Europe Tonic Water Market Share (%) & BPS Analysis, By Country, 2017 & 2025
Figure 104: Europe Tonic Water Market Y-o-Y Growth (%), By Country, 2016–2025
Figure 105: U.K. Tonic Water Market Absolute $ Opportunity (US$ Mn), 2017–2025
Figure 106: Italy Tonic Water Market Absolute $ Opportunity (US$ Mn), 2017–2025
Figure 107: Spain Tonic Water Market Absolute $ Opportunity (US$ Mn), 2017–2025
Figure 108: France Tonic Water Market Absolute $ Opportunity (US$ Mn), 2017–2025
Figure 109: Germany Tonic Water Market Absolute $ Opportunity (US$ Mn), 2017–2025
Figure 110: NORDIC Tonic Water Market Absolute $ Opportunity (US$ Mn), 2017–2025
Figure 111: BENELUX Tonic Water Market Absolute $ Opportunity (US$ Mn), 2017–2025
Figure 112: Russia Tonic Water Market Absolute $ Opportunity (US$ Mn), 2017–2025
Figure 113: Poland Tonic Water Market Absolute $ Opportunity (US$ Mn), 2017–2025
Figure 114: Rest of Europe Tonic Water Market Absolute $ Opportunity (US$ Mn), 2017–2025
Figure 115: Europe Tonic Water Market Share (%) & BPS Analysis, By Content, 2017 & 2025
Figure 116: Europe Tonic Water Market Y-o-Y Growth (%), By Content, 2016–2025
Figure 117: Europe Tonic Water Market Absolute $ Opportunity (US$ Mn), By Regular Segment, 2017–2025
Figure 118: Europe Tonic Water Market Absolute $ Opportunity (US$ Mn), By Diet Segment, 2017–2025
Figure 119: Europe Tonic Water Market Share (%) & BPS Analysis, by Product Type, 2017 & 2025
Figure 120: Europe Tonic Water Market Y-o-Y Growth (%), By Product Type, 2016–2025
Figure 121: Europe Tonic Water Market Absolute $ Opportunity (US$ Mn), By Non-Flavored Segment, 2017–2025
Figure 122: Europe Tonic Water Market Absolute $ Opportunity (US$ Mn), By Flavored Segment, 2017–2025
Figure 123: Europe Tonic Water Market Share (%) & BPS Analysis, by Application, 2017 & 2025
Figure 124: Europe Tonic Water Market Y-o-Y Growth (%), By Application, 2016–2025
Figure 125: Europe Tonic Water Market Absolute $ Opportunity (US$ Mn), By Alcoholic Drinks Segment, 2017–2025
Figure 126: Europe Tonic Water Market Absolute $ Opportunity (US$ Mn), By Direct Consumption Segment, 2017–2025
Figure 127: Europe Tonic Water Market Share (%) & BPS Analysis, by Sales Channel, 2017 & 2025
Figure 128: Europe Tonic Water Market Y-o-Y Growth (%), By Sales Channel, 2016–2025
Figure 129: Europe Tonic Water Market Absolute $ Opportunity (US$ Mn), By Direct Sales Segment, 2017–2025
Figure 130: Europe Tonic Water Market Absolute $ Opportunity (US$ Mn), By Retail Sales Segment, 2017–2025
Figure 131: Europe Tonic Water Market Attractiveness Analysis, by Country, 2017 & 2025
Figure 132: Europe Tonic Water Market Attractiveness Analysis, by Content, 2017 & 2025
Figure 133: Europe Tonic Water Market Attractiveness Analysis, by Product Type, 2017 & 2025
Figure 134: Europe Tonic Water Market Attractiveness Analysis, by Application, 2017 & 2025
Figure 135: Europe Tonic Water Market Attractiveness Analysis, by Sales Channel, 2017 & 2025
Figure 136: APAC Tonic Water Market, Value Share (%), By Country (2016)
Figure 137: APAC Tonic Water Market, Value Share (%), By Content (2016)
Figure 138: APAC Tonic Water Market, Value Share (%), By Product Type (2016)
Figure 139: APAC Tonic Water Market, Value Share (%), By Application (2016)
Figure 140: APAC Tonic Water Market Value (US$ Mn), By Sales Channel (2016)
Figure 141: APAC Tonic Water Market Value (US$ Mn) and Volume ('000 Liters) Forecast, 2016–2025
Figure 142: APAC Tonic Water Market Absolute $ Opportunity (US$ Mn), 2016?2025
Figure 143: APAC Tonic Water Market Share (%) & BPS Analysis, By Country, 2017 & 2025
Figure 144: APAC Tonic Water Market Y-o-Y Growth (%), By Country, 2016–2025
Figure 145: India Tonic Water Market Absolute $ Opportunity (US$ Mn), 2017–2025
Figure 146: China Tonic Water Market Absolute $ Opportunity (US$ Mn), 2017–2025
Figure 147: ASEAN Tonic Water Market Absolute $ Opportunity (US$ Mn), 2017–2025
Figure 148: Australia & New Zealand Tonic Water Market Absolute $ Opportunity (US$ Mn), 2017–2025
Figure 149: Japan Tonic Water Market Absolute $ Opportunity (US$ Mn), 2017–2025
Figure 150: Rest of APAC Tonic Water Market Absolute $ Opportunity (US$ Mn), 2017–2025
Figure 151: APAC Tonic Water Market Share (%) & BPS Analysis, By Content, 2017 & 2025
Figure 152: APAC Tonic Water Market Y-o-Y Growth (%), By Content, 2016–2025
Figure 153: APAC Tonic Water Market Absolute $ Opportunity (US$ Mn), By Regular Segment, 2017–2025
Figure 154: APAC Tonic Water Market Absolute $ Opportunity (US$ Mn), By Diet Segment, 2017–2025
Figure 155: APAC Tonic Water Market Share (%) & BPS Analysis, by Product Type, 2017 & 2025
Figure 156: APAC Tonic Water Market Y-o-Y Growth (%), By Product Type, 2016–2025
Figure 157: APAC Tonic Water Market Absolute $ Opportunity (US$ Mn), By Non-Flavored Segment, 2017–2025
Figure 158: APAC Tonic Water Market Absolute $ Opportunity (US$ Mn), By Flavored Segment, 2017–2025
Figure 159: APAC Tonic Water Market Share (%) & BPS Analysis, by Application, 2017 & 2025
Figure 160: APAC Tonic Water Market Y-o-Y Growth (%), By Application, 2016–2025
Figure 161: APAC Tonic Water Market Absolute $ Opportunity (US$ Mn), By Alcoholic Drinks Segment, 2017–2025
Figure 162: APAC Tonic Water Market Absolute $ Opportunity (US$ Mn), By Direct Consumption Segment, 2017–2025
Figure 163: APAC Tonic Water Market Share (%) & BPS Analysis, by Sales Channel, 2017 & 2025
Figure 164: APAC Tonic Water Market Y-o-Y Growth (%), By Sales Channel, 2016–2025
Figure 165: APAC Tonic Water Market Absolute $ Opportunity (US$ Mn), By Direct Sales Segment, 2017–2025
Figure 166: APAC Tonic Water Market Absolute $ Opportunity (US$ Mn), By Retail Sales Segment, 2017–2025
Figure 167: APAC Tonic Water Market Attractiveness Analysis, by Country, 2017 & 2025
Figure 168: APAC Tonic Water Market Attractiveness Analysis, by Content, 2017 & 2025
Figure 169: APAC Tonic Water Market Attractiveness Analysis, by Product Type, 2017 & 2025
Figure 170: APAC Tonic Water Market Attractiveness Analysis, by Application, 2017 & 2025
Figure 171: APAC Tonic Water Market Attractiveness Analysis, by Sales Channel, 2017 & 2025
Figure 172: MEA Tonic Water Market, Value Share (%), By Country (2016)
Figure 173: MEA Tonic Water Market, Value Share (%), By Content (2016)
Figure 174: MEA Tonic Water Market, Value Share (%), By Product Type (2016)
Figure 175: MEA Tonic Water Market, Value Share (%), By Application (2016)
Figure 176: MEA Tonic Water Market Value (US$ Mn), By Sales Channel (2016)
Figure 177: MEA Tonic Water Market Value (US$ Mn) and Volume ('000 Liters) Forecast, 2016–2025
Figure 178: MEA Tonic Water Market Absolute $ Opportunity (US$ Mn), 2016?2025
Figure 179: MEA Tonic Water Market Share (%) & BPS Analysis, By Country, 2017 & 2025
Figure 180: MEA Tonic Water Market Y-o-Y Growth (%), By Country, 2016–2025
Figure 181: GCC Tonic Water Market Absolute $ Opportunity (US$ Mn), 2017–2025
Figure 182: South Africa Tonic Water Market Absolute $ Opportunity (US$ Mn), 2017–2025
Figure 183: Rest of MEA Tonic Water Market Absolute $ Opportunity (US$ Mn), 2017–2025
Figure 184: MEA Tonic Water Market Share (%) & BPS Analysis, By Content, 2017 & 2025
Figure 185: MEA Tonic Water Market Y-o-Y Growth (%), By Content, 2016–2025
Figure 186: MEA Tonic Water Market Absolute $ Opportunity (US$ Mn), By Regular Segment, 2017–2025
Figure 187: MEA Tonic Water Market Absolute $ Opportunity (US$ Mn), By Diet Segment, 2017–2025
Figure 188: MEA Tonic Water Market Share (%) & BPS Analysis, by Product Type, 2017 & 2025
Figure 189: MEA Tonic Water Market Y-o-Y Growth (%), By Product Type, 2016–2025
Figure 190: MEA Tonic Water Market Absolute $ Opportunity (US$ Mn), By Non-Flavored Segment, 2017–2025
Figure 191: MEA Tonic Water Market Absolute $ Opportunity (US$ Mn), By Flavored Segment, 2017–2025
Figure 192: MEA Tonic Water Market Share (%) & BPS Analysis, by Application, 2017 & 2025
Figure 193: MEA Tonic Water Market Y-o-Y Growth (%), By Application, 2016–2025
Figure 194: MEA Tonic Water Market Absolute $ Opportunity (US$ Mn), By Alcoholic Drinks Segment, 2017–2025
Figure 195: MEA Tonic Water Market Absolute $ Opportunity (US$ Mn), By Direct Consumption Segment, 2017–2025
Figure 196: MEA Tonic Water Market Share (%) & BPS Analysis, by Sales Channel, 2017 & 2025
Figure 197: MEA Tonic Water Market Y-o-Y Growth (%), By Sales Channel, 2016–2025
Figure 198: MEA Tonic Water Market Absolute $ Opportunity (US$ Mn), By Direct Sales Segment, 2017–2025
Figure 199: MEA Tonic Water Market Absolute $ Opportunity (US$ Mn), By Retail Sales Segment, 2017–2025
Figure 200: MEA Tonic Water Market Attractiveness Analysis, by Country, 2017 & 2025
Figure 201: MEA Tonic Water Market Attractiveness Analysis, by Content, 2017 & 2025
Figure 202: MEA Tonic Water Market Attractiveness Analysis, by Product Type, 2017 & 2025
Figure 203: MEA Tonic Water Market Attractiveness Analysis, by Application, 2017 & 2025
Figure 204: MEA Tonic Water Market Attractiveness Analysis, by Sales Channel, 2017 & 2025
Copyright © Transparency Market Research, Inc. All Rights reserved
Trust Online

Tonic Water Market