
Reports
Reports
Thawing systems are utilized for defrosting biological samples in pharmaceutical companies, diagnostic centers, biotechnology, and biobanks. Thawing comes under the primary manufacturing processes in the biopharmaceutical industry. Thawing systems comprise of containers and thaw bags for process development. Thawing systems benefit the research and development process by minimizing the amount of sample required.
Biopharmaceutical Industries Driving Demand for Thawing Systems
Demand for thawing system is largely driven by the biopharmaceutical industry. Biopharmaceutical companies that are involved in the production of drugs require thawing systems for transporting and storing pharmaceutical products & services. Factors such as short process cycles and sterile designs have led end-users to increasingly opt for thawing systems. Various bio-repositories across the globe are making high investments in expanding their storage capacities. In addition, thawed cells current find extensive use in the analysis and treatment of diseases such as cancer and diabetes. Growing number of road accidents, trauma cases, and emergencies have further driven the demand for biological samples, which in turn require thawing systems for storage and transport purposes.
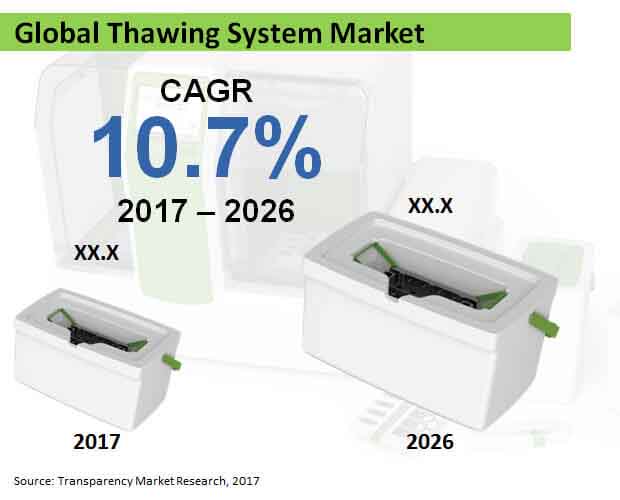
However, small- & medium-sized companies find it difficult to invest in thawing systems on the back of their high cost. In addition, multiple thawing system are less optimal operationally for large batch size of samples. High cost of automation is further inhibiting expansion of the thawing system market. According to Transparency Market Research (TMR), the global thawing system market will register a CAGR of over 10% throughout the forecast period (2017-2026). Revenues from worldwide sales of thawing systems are estimated to reach approximately US$ 350 Mn by 2026-end.
Automated thawing systems to outgrow manual thawing systems by 2026-end
Low cost of manual thawing systems is the primary reason why they are increasingly being preferred by healthcare settings. Manual thawing system is expected to be the dominant product in the market in 2017. However, advanced applications of automated thawing systems have spurred their demand across the biopharmaceutical companies as well as research institutes, owing to their high efficacy and effectiveness. Automated thawing systems are projected to outgrow manual thawing systems in terms of revenues by 2026-end.
Increasing incidences of blood related disorders such as rare blood disorders have driven the demand for blood for treatment and surgical purposes. In addition, growing number of accidents and trauma cases necessitate blood transfusions, along with demand for cryopreserved blood products. These factors have made blood to be the most lucrative sample type segment in the global thawing systems market. Semen will also remain a lucrative sample in the market, with sales projected to exhibit the highest CAGR through 2026.
Blood Banks & Transfusion Centers to Remain Leading End-Users of Thawing Systems
According to the CDC, in the U.S., over 20 Mn and 25 Mn adults were diagnosed with cancer and heart disease respectively in 2013. In addition, according to the WHO, over 350 Mn surgeries were performed worldwide in 2012, and this number is further estimated to rise significantly in the near future. Surgical procedures apropos to cancer and organ transplant require blood transfusion, which in turn results into demand for blood. This has further spurred demand for thawing systems in blood banks & transfusion centers. Blood banks & transfusion centers are expected to remain the most remunerative end-user of thawing systems, followed by hospitals & diagnostic centers. These two end-users are projected to account for nearly equal revenue share of the market by 2026-end.
Pharmaceutical and biotechnology companies in North America significantly invest in drug discovery & development activities. In addition, government in the region provides large capital for development of biobanks, in a bid to improve the supply and storage of blood to healthcare settings. These factors influence the thawing systems market in North America. North America will continue to be the most attractive region for growth of the thawing system market. Asia-Pacific excluding Japan (APEJ) is also expected to remain remunerative for the market growth, and is projected to trail behind North America in terms of sales expansion.
Competition Tracking
Key market participants identified by TMR’s report include BioCision, LLC, Cytotherm Lp, Barkey GmbH & Co. KG, Boekel Industries, Inc., Helmer, Inc., Cardinal Health, Inc., General Electric Company, and Sartorius Aktiengesellschaft.
Growth in Research Activities in Healthcare Sector Drives Demand Opportunities in Thawing System Market
Thawing system refers to a device used for defrosting biological samples such as blood, semen, embryo, and ovum. These systems are made up of two main components, namely thaw bags for process development and containers. Thawing systems are widely used in blood banks, diagnostic centers, pharmaceutical companies, biobanks, and biotechnology institutes. Thus, increased use of this device in abovementioned end-users is projected to fuel the demand opportunities for vendors in the global thawing system market in the forthcoming years.
Automatic and manual are the two models available in the global thawing system market. In the biopharmaceutical industry, thawing is considered a key manufacturing process. Apart from this, these thawing systems are gaining traction across various research institutes. One of the key reasons attributed to this popularity of thawing systems is their ability to help in performing the research and development process in the small amount of sample.
The thawing system is widely used in blood banks and transfusion centers. In recent few years, there is remarkable growth in number of surgeries related to cancer and organ transplant, which require blood in large amounts. Thus, increased number of surgeries is projected to drive sales opportunities in the global thawing system market in the upcoming years. Apart from this, the market is likely to be driven by the growing number of accident cases in all worldwide locations.
The recent COVID-19 epidemic has resulted into a worldwide healthcare crisis. Owing to this scenario, the healthcare sector across the globe has shifted its focus of service delivery. Numerous hospitals across the globe had to halt or postpone non-emergency surgical procedures as well as in-hospital therapies. These healthcare providers are concentrating toward offering emergency healthcare to patients infected with coronavirus. Thus, decreased number of surgeries all across the globe is impacting adversely on the sales of the global thawing system market.
1. Global Economic Outlook
2. Global Thawing System Market - Executive Summary
3. Global Thawing System Market Overview
3.1. Introduction
3.1.1. Global Thawing System Market Taxonomy
3.1.2. Global Thawing System Market Definition
3.2. Global Thawing System Market Size (US$ Mn) and Forecast, 2012-2026
3.2.1. Global Thawing System Market Y-o-Y Growth
3.3. Global Thawing System Market Dynamics
3.4. Supply Chain
3.5. Cost Structure
3.6. Pricing Analysis
3.7. PESTLE Analysis
3.8. List of Distributors
3.9. Key Participants Market Presence (Intensity Map) By Region
4. Global Thawing System Market Analysis and Forecast 2012-2026
4.1. Global Thawing System Market Size and Forecast By Product Type, 2012-2026
4.1.1. Manual Market Size and Forecast, 2012-2026
4.1.1.1. Revenue (US$ Mn) Comparison, By Region
4.1.1.2. Market Share Comparison, By Region
4.1.1.3. Y-o-Y growth Comparison, By Region
4.1.2. Automated Market Size and Forecast, 2012-2026
4.1.2.1. Revenue (US$ Mn) Comparison, By Region
4.1.2.2. Market Share Comparison, By Region
4.1.2.3. Y-o-Y growth Comparison, By Region
4.2. Global Thawing System Market Size and Forecast By End User, 2012-2026
4.2.1. Blood Banks & Transfusion Centers Market Size and Forecast, 2012-2026
4.2.1.1. Revenue (US$ Mn) Comparison, By Region
4.2.1.2. Market Share Comparison, By Region
4.2.1.3. Y-o-Y growth Comparison, By Region
4.2.2. Hospitals & Diagnostic Centers Market Size and Forecast, 2012-2026
4.2.2.1. Revenue (US$ Mn) Comparison, By Region
4.2.2.2. Market Share Comparison, By Region
4.2.2.3. Y-o-Y growth Comparison, By Region
4.2.3. Academic and Research Institutes Market Size and Forecast, 2012-2026
4.2.3.1. Revenue (US$ Mn) Comparison, By Region
4.2.3.2. Market Share Comparison, By Region
4.2.3.3. Y-o-Y growth Comparison, By Region
4.2.4. Bio& Pharmaceutical Industries Market Size and Forecast, 2012-2026
4.2.4.1. Revenue (US$ Mn) Comparison, By Region
4.2.4.2. Market Share Comparison, By Region
4.2.4.3. Y-o-Y growth Comparison, By Region
4.2.5. Other End Users Market Size and Forecast, 2012-2026
4.2.5.1. Revenue (US$ Mn) Comparison, By Region
4.2.5.2. Market Share Comparison, By Region
4.2.5.3. Y-o-Y growth Comparison, By Region
4.3. Global Thawing System Market Size and Forecast By Sample Type, 2012-2026
4.3.1. Blood Market Size and Forecast, 2012-2026
4.3.1.1. Revenue (US$ Mn) Comparison, By Region
4.3.1.2. Market Share Comparison, By Region
4.3.1.3. Y-o-Y growth Comparison, By Region
4.3.2. Embryo & Ovum Market Size and Forecast, 2012-2026
4.3.2.1. Revenue (US$ Mn) Comparison, By Region
4.3.2.2. Market Share Comparison, By Region
4.3.2.3. Y-o-Y growth Comparison, By Region
4.3.3. Semen Market Size and Forecast, 2012-2026
4.3.3.1. Revenue (US$ Mn) Comparison, By Region
4.3.3.2. Market Share Comparison, By Region
4.3.3.3. Y-o-Y growth Comparison, By Region
4.3.4. Others Market Size and Forecast, 2012-2026
4.3.4.1. Revenue (US$ Mn) Comparison, By Region
4.3.4.2. Market Share Comparison, By Region
4.3.4.3. Y-o-Y growth Comparison, By Region
5. North America Thawing System Market Size and Forecast, 2012-2026
5.1. North America Outlook
5.2. North America Parent Market Outlook
5.3. North America Target Market Outlook
5.4. Revenue (US$ Mn) Comparison, By Country
5.4.1. US Market Size and Forecast (US$ Mn), 2012-2026
5.4.2. Canada Market Size and Forecast (US$ Mn), 2012-2026
5.5. Revenue (US$ Mn) Comparison, By Product Type
5.6. Revenue (US$ Mn) Comparison, By End User
5.7. Revenue (US$ Mn) Comparison, By Sample Type
6. Latin America Thawing System Market Size and Forecast, 2012-2026
6.1. Latin America Outlook
6.2. Latin America Parent Market Outlook
6.3. Latin America Target Market Outlook
6.4. Revenue (US$ Mn) Comparison, By Country
6.4.1. Brazil Market Size and Forecast (US$ Mn), 2012-2026
6.4.2. Mexico Market Size and Forecast (US$ Mn), 2012-2026
6.4.3. Rest of Latin America Market Size and Forecast (US$ Mn), 2012-2026
6.5. Revenue (US$ Mn) Comparison, By Product Type
6.6. Revenue (US$ Mn) Comparison, By End User
6.7. Revenue (US$ Mn) Comparison, By Sample Type
7. Europe Thawing System Market Size and Forecast, 2012-2026
7.1. Europe Outlook
7.2. Europe Parent Market Outlook
7.3. Europe Target Market Outlook
7.4. Revenue (US$ Mn) Comparison, By Country
7.4.1. Germany Market Size and Forecast (US$ Mn), 2012-2026
7.4.2. UK Market Size and Forecast (US$ Mn), 2012-2026
7.4.3. France Market Size and Forecast (US$ Mn), 2012-2026
7.4.4. Spain Market Size and Forecast (US$ Mn), 2012-2026
7.4.5. Italy Market Size and Forecast (US$ Mn), 2012-2026
7.4.6. Rest of Europe Market Size and Forecast (US$ Mn), 2012-2026
7.5. Revenue (US$ Mn) Comparison, By Product Type
7.6. Revenue (US$ Mn) Comparison, By End User
7.7. Revenue (US$ Mn) Comparison, By Sample Type
8. Japan Thawing System Market Size and Forecast, 2012-2026
8.1. Japan Outlook
8.2. Japan Parent Market Outlook
8.3. Japan Target Market Outlook
8.4. Revenue (US$ Mn) Comparison, By Country
8.4.1. Japan Market Size and Forecast (US$ Mn), 2012-2026
8.5. Revenue (US$ Mn) Comparison, By Product Type
8.6. Revenue (US$ Mn) Comparison, By End User
8.7. Revenue (US$ Mn) Comparison, By Sample Type
9. APEJ Thawing System Market Size and Forecast, 2012-2026
9.1. APEJ Outlook
9.2. APEJ Parent Market Outlook
9.3. APEJ Target Market Outlook
9.4. Revenue (US$ Mn) Comparison, By Country
9.4.1. China Market Size and Forecast (US$ Mn), 2012-2026
9.4.2. India Market Size and Forecast (US$ Mn), 2012-2026
9.4.3. Australia Market Size and Forecast (US$ Mn), 2012-2026
9.4.4. Thailand Market Size and Forecast (US$ Mn), 2012-2026
9.4.5. Singapore Market Size and Forecast (US$ Mn), 2012-2026
9.4.6. Rest of APEJ Market Size and Forecast (US$ Mn), 2012-2026
9.5. Revenue (US$ Mn) Comparison, By Product Type
9.6. Revenue (US$ Mn) Comparison, By End User
9.7. Revenue (US$ Mn) Comparison, By Sample Type
10. MEA Thawing System Market Size and Forecast, 2012-2026
10.1. MEA Outlook
10.2. MEA Parent Market Outlook
10.3. MEA Target Market Outlook
10.4. Revenue (US$ Mn) Comparison, By Country
10.4.1. GCC Countries Market Size and Forecast (US$ Mn), 2012-2026
10.4.2. South Africa Market Size and Forecast (US$ Mn), 2012-2026
10.4.3. Nigeria Market Size and Forecast (US$ Mn), 2012-2026
10.4.4. Rest of MEA Market Size and Forecast (US$ Mn), 2012-2026
10.5. Revenue (US$ Mn) Comparison, By Product Type
10.6. Revenue (US$ Mn) Comparison, By End User
10.7. Revenue (US$ Mn) Comparison, By Sample Type
11. Global Thawing System Market Company Share, Competition Landscape and Company Profiles
11.1. Company Share Analysis
11.2. Competition Landscape
11.3. Company Profiles
11.3.1. Sartorius Aktiengesellschaft
11.3.2. General Electric Company
11.3.3. Cardinal Health, Inc
11.3.4. Sarstedt AG & Co
11.3.5. Helmer, Inc
11.3.6. Boekel Industries, Inc
11.3.7. Barkey GmbH & Co. KG
11.3.8. MedCision, Inc
11.3.9. Cytotherm Lp
11.3.10. BioCision, LLC
12. Research Methodology
13. Secondary and Primary Sources
14. Assumptions and Acronyms
15. Disclaimer
List of Table
TABLE 1 Global Thawing System Market Value (US$ Mn), 2012-2017
TABLE 2 Global Thawing System Market Value (US$ Mn), 2018-2026
TABLE 3 Global Thawing System Market Value (US$ Mn) and Y-o-Y, 2017-2026
TABLE 4 Global Manual Segment Value (US$ Mn), By Region 2012-2017
TABLE 5 Global Manual Segment Value (US$ Mn), By Region 2018-2026
TABLE 6 Global Manual Segment Market Share, By Region 2012-2017
TABLE 7 Global Manual Segment Market Share, By Region 2018-2026
TABLE 8 Global Manual Segment Y-o-Y, By Region 2017-2026
TABLE 9 Global Automated Segment Value (US$ Mn), By Region 2012-2017
TABLE 10 Global Automated Segment Value (US$ Mn), By Region 2018-2026
TABLE 11 Global Automated Segment Market Share, By Region 2012-2017
TABLE 12 Global Automated Segment Market Share, By Region 2018-2026
TABLE 13 Global Automated Segment Y-o-Y, By Region 2017-2026
TABLE 14 Global Blood Banks & Transfusion Centers Segment Value (US$ Mn), By Region 2012-2017
TABLE 15 Global Blood Banks & Transfusion Centers Segment Value (US$ Mn), By Region 2018-2026
TABLE 16 Global Blood Banks & Transfusion Centers Segment Market Share, By Region 2012-2017
TABLE 17 Global Blood Banks & Transfusion Centers Segment Market Share, By Region 2018-2026
TABLE 18 Global Blood Banks & Transfusion Centers Segment Y-o-Y, By Region 2017-2026
TABLE 19 Global Hospitals & Diagnostic Centers Segment Value (US$ Mn), By Region 2012-2017
TABLE 20 Global Hospitals & Diagnostic Centers Segment Value (US$ Mn), By Region 2018-2026
TABLE 21 Global Hospitals & Diagnostic Centers Segment Market Share, By Region 2012-2017
TABLE 22 Global Hospitals & Diagnostic Centers Segment Market Share, By Region 2018-2026
TABLE 23 Global Hospitals & Diagnostic Centers Segment Y-o-Y, By Region 2017-2026
TABLE 24 Global Academic and Research Institutes Segment Value (US$ Mn), By Region 2012-2017
TABLE 25 Global Academic and Research Institutes Segment Value (US$ Mn), By Region 2018-2026
TABLE 26 Global Academic and Research Institutes Segment Market Share, By Region 2012-2017
TABLE 27 Global Academic and Research Institutes Segment Market Share, By Region 2018-2026
TABLE 28 Global Academic and Research Institutes Segment Y-o-Y, By Region 2017-2026
TABLE 29 Global Biotechnology & Pharmaceutical Industries Segment Value (US$ Mn), By Region 2012-2017
TABLE 30 Global Biotechnology & Pharmaceutical Industries Segment Value (US$ Mn), By Region 2018-2026
TABLE 31 Global Biotechnology & Pharmaceutical Industries Segment Market Share, By Region 2012-2017
TABLE 32 Global Biotechnology & Pharmaceutical Industries Segment Market Share, By Region 2018-2026
TABLE 33 Global Biotechnology & Pharmaceutical Industries Segment Y-o-Y, By Region 2017-2026
TABLE 34 Global Other End Users Segment Value (US$ Mn), By Region 2012-2017
TABLE 35 Global Other End Users Segment Value (US$ Mn), By Region 2018-2026
TABLE 36 Global Other End Users Segment Market Share, By Region 2012-2017
TABLE 37 Global Other End Users Segment Market Share, By Region 2018-2026
TABLE 38 Global Other End Users Segment Y-o-Y, By Region 2017-2026
TABLE 39 Global Blood Segment Value (US$ Mn), By Region 2012-2017
TABLE 40 Global Blood Segment Value (US$ Mn), By Region 2018-2026
TABLE 41 Global Blood Segment Market Share, By Region 2012-2017
TABLE 42 Global Blood Segment Market Share, By Region 2018-2026
TABLE 43 Global Blood Segment Y-o-Y, By Region 2017-2026
TABLE 44 Global Embryo & Ovum Segment Value (US$ Mn), By Region 2012-2017
TABLE 45 Global Embryo & Ovum Segment Value (US$ Mn), By Region 2018-2026
TABLE 46 Global Embryo & Ovum Segment Market Share, By Region 2012-2017
TABLE 47 Global Embryo & Ovum Segment Market Share, By Region 2018-2026
TABLE 48 Global Embryo & Ovum Segment Y-o-Y, By Region 2017-2026
TABLE 49 Global Semen Segment Value (US$ Mn), By Region 2012-2017
TABLE 50 Global Semen Segment Value (US$ Mn), By Region 2018-2026
TABLE 51 Global Semen Segment Market Share, By Region 2012-2017
TABLE 52 Global Semen Segment Market Share, By Region 2018-2026
TABLE 53 Global Semen Segment Y-o-Y, By Region 2017-2026
TABLE 54 Global Others Segment Value (US$ Mn), By Region 2012-2017
TABLE 55 Global Others Segment Value (US$ Mn), By Region 2018-2026
TABLE 56 Global Others Segment Market Share, By Region 2012-2017
TABLE 57 Global Others Segment Market Share, By Region 2018-2026
TABLE 58 Global Others Segment Y-o-Y, By Region 2017-2026
TABLE 59 North America Current Expenditure on Health, (% of GDP), by Country, 2010 – 2016
TABLE 60 North America Per Capita Health Expenditure (US$ PPP), by Country, 2010 - 2016
TABLE 61 North America Per Capita Healthcare Expenditure Y-o-Y Growth (in Real terms %), by Country, 2010 - 2016
TABLE 62 North America Out-of-Pocket Healthcare Expenditure, % of Healthcare Expenditure, by Country, 2010 - 2016
TABLE 63 North America Per Capita Healthcare Expenditure (at Current Price, in US$), by Country, 2010 - 2016
TABLE 64 North America Thawing System Market Value (US$ Mn), By Country 2012-2017
TABLE 65 North America Thawing System Market Value (US$ Mn), By Country 2018-2026
TABLE 66 North America Thawing System Market Value (US$ Mn), By Product Type 2012-2017
TABLE 67 North America Thawing System Market Value (US$ Mn), By Product Type 2018-2026
TABLE 68 North America Thawing System Market Value (US$ Mn), By End User 2012-2017
TABLE 69 North America Thawing System Market Value (US$ Mn), By End User 2018-2026
TABLE 70 North America Thawing System Market Value (US$ Mn), By Sample Type 2012-2017
TABLE 71 North America Thawing System Market Value (US$ Mn), By Sample Type 2018-2026
TABLE 72 Latin America Current Expenditure on Health, (% of GDP), by Country, 2010 – 2016
TABLE 73 Latin America Per Capita Health Expenditure (US$ PPP), by Country, 2010 - 2016
TABLE 74 Latin America Per Capita Healthcare Expenditure Y-o-Y Growth (in Real terms %), by Country, 2010 - 2016
TABLE 75 Latin America Out-of-Pocket Healthcare Expenditure, % of Healthcare Expenditure, by Country, 2010 - 2016
TABLE 76 Latin America Per Capita Healthcare Expenditure (at Current Price, in US$), by Country, 2010 - 2016
TABLE 77 Latin America Thawing System Market Value (US$ Mn), By Country 2012-2017
TABLE 78 Latin America Thawing System Market Value (US$ Mn), By Country 2018-2026
TABLE 79 Latin America Thawing System Market Value (US$ Mn), By Product Type 2012-2017
TABLE 80 Latin America Thawing System Market Value (US$ Mn), By Product Type 2018-2026
TABLE 81 Latin America Thawing System Market Value (US$ Mn), By End User 2012-2017
TABLE 82 Latin America Thawing System Market Value (US$ Mn), By End User 2018-2026
TABLE 83 Latin America Thawing System Market Value (US$ Mn), By Sample Type 2012-2017
TABLE 84 Latin America Thawing System Market Value (US$ Mn), By Sample Type 2018-2026
TABLE 85 Europe Current Expenditure on Health, (% of GDP), by Country, 2010 – 2016
TABLE 86 Europe Per Capita Health Expenditure (US$ PPP), by Country, 2010 - 2016
TABLE 87 Europe Per Capita Healthcare Expenditure Y-o-Y Growth (in Real terms %), by Country, 2010 - 2016
TABLE 88 Europe Out-of-Pocket Healthcare Expenditure, % of Healthcare Expenditure, by Country, 2010 - 2016
TABLE 89 Europe Per Capita Healthcare Expenditure (at Current Price, in US$), by Country, 2010 - 2016
TABLE 90 Europe Thawing System Market Value (US$ Mn), By Country 2012-2017
TABLE 91 Europe Thawing System Market Value (US$ Mn), By Country 2018-2026
TABLE 92 Europe Thawing System Market Value (US$ Mn), By Product Type 2012-2017
TABLE 93 Europe Thawing System Market Value (US$ Mn), By Product Type 2018-2026
TABLE 94 Europe Thawing System Market Value (US$ Mn), By End User 2012-2017
TABLE 95 Europe Thawing System Market Value (US$ Mn), By End User 2018-2026
TABLE 96 Europe Thawing System Market Value (US$ Mn), By Sample Type 2012-2017
TABLE 97 Europe Thawing System Market Value (US$ Mn), By Sample Type 2018-2026
TABLE 98 Japan Current Expenditure on Health, (% of GDP), by Country, 2010 – 2016
TABLE 99 Japan Per Capita Health Expenditure (US$ PPP), by Country, 2010 - 2016
TABLE 100 Japan Per Capita Healthcare Expenditure Y-o-Y Growth (in Real terms %), by Country, 2010 - 2016
TABLE 101 Japan Out-of-Pocket Healthcare Expenditure, % of Healthcare Expenditure, by Country, 2010 - 2016
TABLE 102 Japan Per Capita Healthcare Expenditure (at Current Price, in US$), by Country, 2010 - 2016
TABLE 103 Japan Thawing System Market Value (US$ Mn), By Country 2012-2017
TABLE 104 Japan Thawing System Market Value (US$ Mn), By Country 2018-2026
TABLE 105 Japan Thawing System Market Value (US$ Mn), By Product Type 2012-2017
TABLE 106 Japan Thawing System Market Value (US$ Mn), By Product Type 2018-2026
TABLE 107 Japan Thawing System Market Value (US$ Mn), By End User 2012-2017
TABLE 108 Japan Thawing System Market Value (US$ Mn), By End User 2018-2026
TABLE 109 Japan Thawing System Market Value (US$ Mn), By Sample Type 2012-2017
TABLE 110 Japan Thawing System Market Value (US$ Mn), By Sample Type 2018-2026
TABLE 111 APEJ Current Expenditure on Health, (% of GDP), by Country, 2010 – 2016
TABLE 112 APEJ Per Capita Health Expenditure (US$ PPP), by Country, 2010 - 2016
TABLE 113 APEJ Per Capita Healthcare Expenditure Y-o-Y Growth (in Real terms %), by Country, 2010 - 2016
TABLE 114 APEJ Out-of-Pocket Healthcare Expenditure, % of Healthcare Expenditure, by Country, 2010 - 2016
TABLE 115 APEJ Per Capita Healthcare Expenditure (at Current Price, in US$), by Country, 2010 - 2016
TABLE 116 APEJ Thawing System Market Value (US$ Mn), By Country 2012-2017
TABLE 117 APEJ Thawing System Market Value (US$ Mn), By Country 2018-2026
TABLE 118 APEJ Thawing System Market Value (US$ Mn), By Product Type 2012-2017
TABLE 119 APEJ Thawing System Market Value (US$ Mn), By Product Type 2018-2026
TABLE 120 APEJ Thawing System Market Value (US$ Mn), By End User 2012-2017
TABLE 121 APEJ Thawing System Market Value (US$ Mn), By End User 2018-2026
TABLE 122 APEJ Thawing System Market Value (US$ Mn), By Sample Type 2012-2017
TABLE 123 APEJ Thawing System Market Value (US$ Mn), By Sample Type 2018-2026
TABLE 124 MEA Current Expenditure on Health, (% of GDP), by Country, 2010 – 2016
TABLE 125 MEA Per Capita Health Expenditure (US$ PPP), by Country, 2010 - 2016
TABLE 126 MEA Per Capita Healthcare Expenditure Y-o-Y Growth (in Real terms %), by Country, 2010 - 2016
TABLE 127 MEA Out-of-Pocket Healthcare Expenditure, % of Healthcare Expenditure, by Country, 2010 - 2016
TABLE 128 MEA Per Capita Healthcare Expenditure (at Current Price, in US$), by Country, 2010 - 2016
TABLE 129 MEA Thawing System Market Value (US$ Mn), By Country 2012-2017
TABLE 130 MEA Thawing System Market Value (US$ Mn), By Country 2018-2026
TABLE 131 MEA Thawing System Market Value (US$ Mn), By Product Type 2012-2017
TABLE 132 MEA Thawing System Market Value (US$ Mn), By Product Type 2018-2026
TABLE 133 MEA Thawing System Market Value (US$ Mn), By End User 2012-2017
TABLE 134 MEA Thawing System Market Value (US$ Mn), By End User 2018-2026
TABLE 135 MEA Thawing System Market Value (US$ Mn), By Sample Type 2012-2017
TABLE 136 MEA Thawing System Market Value (US$ Mn), By Sample Type 2018-2026
List of Figure
FIG. 1 Global Thawing System Market Value (US$ Mn), 2012-2017
FIG. 2 Global Thawing System Market Value (US$ Mn) Forecast, 2018-2026
FIG. 3 Global Thawing System Market Value (US$ Mn) and Y-o-Y, 2017-2026
FIG. 4 Global Manual Segment Market Value (US$ Mn) By Region, 2012-2017
FIG. 5 Global Manual Segment Market Value (US$ Mn) By Region, 2018-2026
FIG. 6 Global Manual Segment Y-o-Y Growth Rate, By Region, 2017-2026
FIG. 7 Global Automated Segment Market Value (US$ Mn) By Region, 2012-2017
FIG. 8 Global Automated Segment Market Value (US$ Mn) By Region, 2018-2026
FIG. 9 Global Automated Segment Y-o-Y Growth Rate, By Region, 2017-2026
FIG. 10 Global Blood Banks & Transfusion Centers Segment Market Value (US$ Mn) By Region, 2012-2017
FIG. 11 Global Blood Banks & Transfusion Centers Segment Market Value (US$ Mn) By Region, 2018-2026
FIG. 12 Global Blood Banks & Transfusion Centers Segment Y-o-Y Growth Rate, By Region, 2017-2026
FIG. 13 Global Hospitals & Diagnostic Centers Segment Market Value (US$ Mn) By Region, 2012-2017
FIG. 14 Global Hospitals & Diagnostic Centers Segment Market Value (US$ Mn) By Region, 2018-2026
FIG. 15 Global Hospitals & Diagnostic Centers Segment Y-o-Y Growth Rate, By Region, 2017-2026
FIG. 16 Global Academic and Research Institutes Segment Market Value (US$ Mn) By Region, 2012-2017
FIG. 17 Global Academic and Research Institutes Segment Market Value (US$ Mn) By Region, 2018-2026
FIG. 18 Global Academic and Research Institutes Segment Y-o-Y Growth Rate, By Region, 2017-2026
FIG. 19 Global Biotechnology & Pharmaceutical Industries Segment Market Value (US$ Mn) By Region, 2012-2017
FIG. 20 Global Biotechnology & Pharmaceutical Industries Segment Market Value (US$ Mn) By Region, 2018-2026
FIG. 21 Global Biotechnology & Pharmaceutical Industries Segment Y-o-Y Growth Rate, By Region, 2017-2026
FIG. 22 Global Other End Users Segment Market Value (US$ Mn) By Region, 2012-2017
FIG. 23 Global Other End Users Segment Market Value (US$ Mn) By Region, 2018-2026
FIG. 24 Global Other End Users Segment Y-o-Y Growth Rate, By Region, 2017-2026
FIG. 25 Global Blood Segment Market Value (US$ Mn) By Region, 2012-2017
FIG. 26 Global Blood Segment Market Value (US$ Mn) By Region, 2018-2026
FIG. 27 Global Blood Segment Y-o-Y Growth Rate, By Region, 2017-2026
FIG. 28 Global Embryo & Ovum Segment Market Value (US$ Mn) By Region, 2012-2017
FIG. 29 Global Embryo & Ovum Segment Market Value (US$ Mn) By Region, 2018-2026
FIG. 30 Global Embryo & Ovum Segment Y-o-Y Growth Rate, By Region, 2017-2026
FIG. 31 Global Semen Segment Market Value (US$ Mn) By Region, 2012-2017
FIG. 32 Global Semen Segment Market Value (US$ Mn) By Region, 2018-2026
FIG. 33 Global Semen Segment Y-o-Y Growth Rate, By Region, 2017-2026
FIG. 34 Global Others Segment Market Value (US$ Mn) By Region, 2012-2017
FIG. 35 Global Others Segment Market Value (US$ Mn) By Region, 2018-2026
FIG. 36 Global Others Segment Y-o-Y Growth Rate, By Region, 2017-2026
FIG. 37 North America Thawing System Market Value (US$ Mn), By Country 2012-2017
FIG. 38 North America Thawing System Market Value (US$ Mn), By Country 2018-2026
FIG. 39 North America Thawing System Market Value (US$ Mn), By Product Type 2012-2017
FIG. 40 North America Thawing System Market Value (US$ Mn), By Product Type 2018-2026
FIG. 41 North America Thawing System Market Value (US$ Mn), By End User 2012-2017
FIG. 42 North America Thawing System Market Value (US$ Mn), By End User 2018-2026
FIG. 43 North America Thawing System Market Value (US$ Mn), By Sample Type 2012-2017
FIG. 44 North America Thawing System Market Value (US$ Mn), By Sample Type 2018-2026
FIG. 45 Latin America Thawing System Market Value (US$ Mn), By Country 2012-2017
FIG. 46 Latin America Thawing System Market Value (US$ Mn), By Country 2018-2026
FIG. 47 Latin America Thawing System Market Value (US$ Mn), By Product Type 2012-2017
FIG. 48 Latin America Thawing System Market Value (US$ Mn), By Product Type 2018-2026
FIG. 49 Latin America Thawing System Market Value (US$ Mn), By End User 2012-2017
FIG. 50 Latin America Thawing System Market Value (US$ Mn), By End User 2018-2026
FIG. 51 Latin America Thawing System Market Value (US$ Mn), By Sample Type 2012-2017
FIG. 52 Latin America Thawing System Market Value (US$ Mn), By Sample Type 2018-2026
FIG. 53 Europe Thawing System Market Value (US$ Mn), By Country 2012-2017
FIG. 54 Europe Thawing System Market Value (US$ Mn), By Country 2018-2026
FIG. 55 Europe Thawing System Market Value (US$ Mn), By Product Type 2012-2017
FIG. 56 Europe Thawing System Market Value (US$ Mn), By Product Type 2018-2026
FIG. 57 Europe Thawing System Market Value (US$ Mn), By End User 2012-2017
FIG. 58 Europe Thawing System Market Value (US$ Mn), By End User 2018-2026
FIG. 59 Europe Thawing System Market Value (US$ Mn), By Sample Type 2012-2017
FIG. 60 Europe Thawing System Market Value (US$ Mn), By Sample Type 2018-2026
FIG. 61 Japan Thawing System Market Value (US$ Mn), By Country 2012-2017
FIG. 62 Japan Thawing System Market Value (US$ Mn), By Country 2018-2026
FIG. 63 Japan Thawing System Market Value (US$ Mn), By Product Type 2012-2017
FIG. 64 Japan Thawing System Market Value (US$ Mn), By Product Type 2018-2026
FIG. 65 Japan Thawing System Market Value (US$ Mn), By Sample Type 2012-2017
FIG. 66 Japan Thawing System Market Value (US$ Mn), By End User 2018-2026
FIG. 67 Japan Thawing System Market Value (US$ Mn), By Sample Type 2012-2017
FIG. 68 Japan Thawing System Market Value (US$ Mn), By Sample Type 2018-2026
FIG. 69 APEJ Thawing System Market Value (US$ Mn), By Country 2012-2017
FIG. 70 APEJ Thawing System Market Value (US$ Mn), By Country 2018-2026
FIG. 71 APEJ Thawing System Market Value (US$ Mn), By Product Type 2012-2017
FIG. 72 APEJ Thawing System Market Value (US$ Mn), By Product Type 2018-2026
FIG. 73 APEJ Thawing System Market Value (US$ Mn), By End User 2012-2017
FIG. 74 APEJ Thawing System Market Value (US$ Mn), By End User 2018-2026
FIG. 75 APEJ Thawing System Market Value (US$ Mn), By Sample Type 2012-2017
FIG. 76 APEJ Thawing System Market Value (US$ Mn), By Sample Type 2018-2026
FIG. 77 MEA Thawing System Market Value (US$ Mn), By Country 2012-2017
FIG. 78 MEA Thawing System Market Value (US$ Mn), By Country 2018-2026
FIG. 79 MEA Thawing System Market Value (US$ Mn), By Product Type 2012-2017
FIG. 80 MEA Thawing System Market Value (US$ Mn), By Product Type 2018-2026
FIG. 81 MEA Thawing System Market Value (US$ Mn), By End User 2012-2017
FIG. 82 MEA Thawing System Market Value (US$ Mn), By End User 2018-2026
FIG. 83 MEA Thawing System Market Value (US$ Mn), By Sample Type 2012-2017
FIG. 84 MEA Thawing System Market Value (US$ Mn), By Sample Type 2018-2026
Copyright © Transparency Market Research, Inc. All Rights reserved
Trust Online

Thawing System Market