
Reports
Reports
India, being one of the largest automotive industries in the world, is likely to experience an increase in exports for automotive components in the financial year of 2022 according to the Automotive Component Manufacturers Association (ACMA). Such trends are translating into potential revenue opportunities for companies in the test automation systems for powertrain dynamometer market. Auto components companies are resuming their capital expenditure plans with expectations of growth in new technology vehicle sales and a recovery in domestic sales.
There is a growing need for developing alternate and localized supply chains to mitigate disruption impact in the India test automation systems for powertrain dynamometer market. Indian automotive companies are tapping revenue opportunities for auto component exports in North America, Europe and even China. They are increasing efforts to tackle challenges such as shortage of semiconductor chips impacting vehicle production.
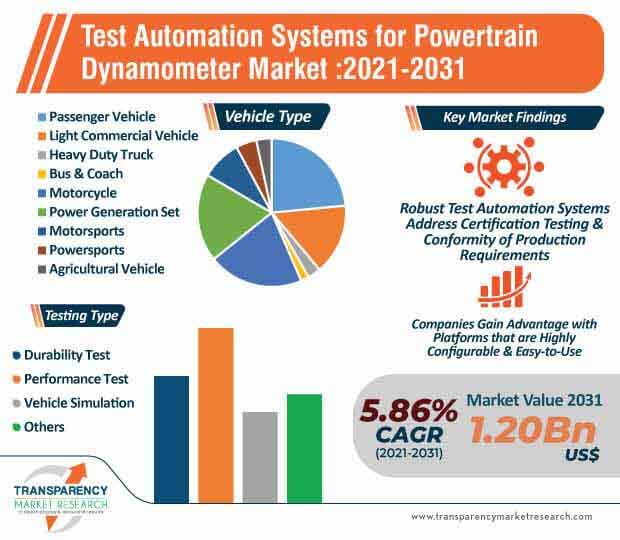
The test automation systems for powertrain dynamometer market is expected to reach US$ 1.20 Bn by 2031. Horiba, Ltd. - a Japanese manufacturer of precision instruments for measurement and analysis, is publicizing its STARS VETS test automation system for emission testing. Companies are developing platforms that align with chassis, engine and powertrain dynamometers.
Leading-edge test automation systems provide test cycle execution, emissions equipment control, results calculation, and reporting in compliance with the different legislative standards throughout the global regions. There is a growing demand for flexible designs in test automation systems for powertrain dynamometers with a wide range of customization. These systems address various requirements for R&D, certification testing, and COP (Conformity of Production).
The test automation systems for powertrain dynamometer market is projected to advance at a modest CAGR of 5.86% during the forecast period. Since automobiles are complex machines, companies need to address high competition to develop platforms that cater to meticulous requirements of automakers. Millbrook Proving Ground - an English vehicle testing center located at Millbrook, Bedfordshire, is exploring opportunity in this challenge to publicize its Revolutionary Engineering Professional System (REPS), test system automation software that deploys data acquisition.
Companies in the test automation systems for powertrain dynamometer market are innovating in platforms that are robust, flexible, customizable, and tailored to the needs of testing applications. They are increasing the availability of platforms that are highly configurable and easy to use.
High-speed data collection and high resolution are preferred in test automation systems for powertrain dynamometers. Sierra Instruments - a manufacturer of flow meter devices & mass controllers, is offering its CADET V14 Premium control, automation, and datalogging platform for automotive testing. There is a growing the demand for high performance professional automotive software systems with a dedicated I/O control and monitoring function.
Companies in the test automation systems for powertrain dynamometer market are developing platforms that enable operational personnel to easily compile test programs and automatically protect the test facility against out of limit operation. They are innovating in platforms that help to record data during testing and analyze the data during or at the completion of a test.
Analysts’ Viewpoint
Companies in the India test automation systems for powertrain dynamometer market are increasing efforts to address issues related to high raw material prices and high fuel prices, which are affecting vehicle production amid ongoing coronavirus pandemic. The competitive market landscape is challenging companies to develop platforms that incorporate fully configurable control modes. Hence, companies should develop automation software platforms and systems that provide configurable displays, buttons and indictors. They should innovate in secure test automation systems for powertrain dynamometers that provide authentication for managing user and access rights. Web-based and VNC (Virtual Network Computing)-based remote access is preferred in test automation systems. These platforms are capable of running different types of tests including part failures and speed tests.
|
Attribute |
Detail |
|
Market Size Value in 2020 |
US$ 638.70 Mn |
|
Market Forecast Value in 2031 |
US$ 1.20 Bn |
|
Growth Rate (CAGR) |
5.86% |
|
Forecast Period |
2021-2031 |
|
Quantitative Units |
US$ Mn for Value |
|
Research Scope |
The report covers regional and global test automation systems for powertrain dynamometer market size along with key factors influencing the market |
|
Report Coverage |
Executive Summary, Market Overview, Global Market, Regional Market, Competition Landscape |
|
Format |
Electronic (PDF) |
|
Market Segmentation |
|
|
Regions Covered |
|
|
Countries Covered |
|
|
Companies Profiled |
|
|
Customization Scope |
Available upon Request |
|
Pricing |
Available upon Request |
Test Automation Systems for Powertrain Dynamometer holds a majority of market share US$ 638.70 Mn in 2020 and is projected to reach US$ 1.20 Bn by 2031
The Test Automation Systems for Powertrain Dynamometer market revenue is projected to register a CAGR of 5.86% during the forecast period.
Based on the vehicle type, the passenger vehicle segment held a major share of the global test automation systems for powertrain dynamometer market and Based on the testing type, the performance test segment held a notable share of the market.
Increasing demand for optimization of testing infrastructure to comply with changing regulations is driving the growth of global test automation systems for powertrain dynamometer market.
Companies such as Horiba Automotive, Power Test Inc., A&D Technology, SAKOR Technologies Inc., FEV Europe GmbH, Sierra Instruments, Dyne Systems Inc., Integral Powertrain, AIP GmbH & Co. KG, AVL GmbH, Unico LLC, SAJ TEST PLANT PVT. LTD., MAHLE Powertrain, Taylor Dynamometer, Rototest, KRATZER AUTOMATION AG, and Systems Technology Group, Inc are the leaders in Test Automation Systems for Powertrain Dynamometer industry.
1. Preface
1.1. About TMR
1.2. Market Coverage / Taxonomy
2. Executive Summary
2.1. Global Market Outlook
2.1.1. Market Size, US$ Mn, 2017-2031
2.2. TMR Analysis and Recommendations
2.3. Competitive Dashboard Analysis
3. Market Overview
3.1. Market Definition / Scope / Limitations
3.2. Market Dynamics
3.2.1. Drivers
3.2.2. Restraints
3.2.3. Opportunity
3.3. Market Factor Analysis
3.3.1. Porter’s Five Force Analysis
3.3.2. SWOT Analysis
3.4. Regulatory Scenario
3.5. Key Trend Analysis
3.6. Value Chain Analysis
3.7. Vendor Matrix
3.8. Gross Margin Analysis
3.9. Cost Structure Analysis
3.10. Profit Margin Analysis
4. COVID-19 Impact Analysis – Test Automation Systems for Powertrain Dynamometer Market
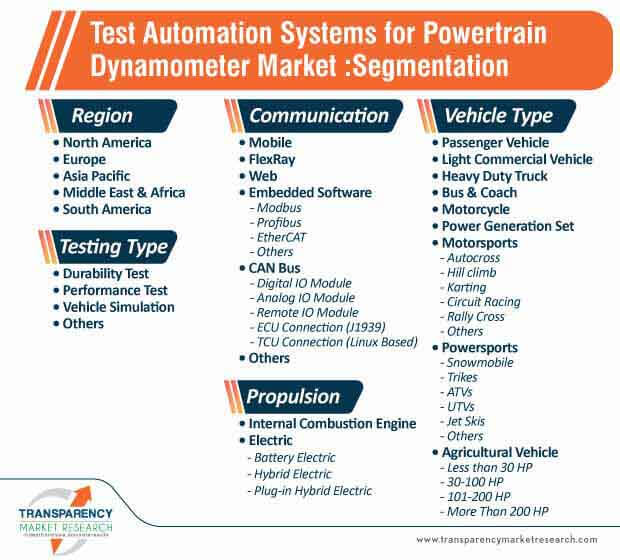
5. Global Test Automation Systems for Powertrain Dynamometer Market, by Communication
5.1. Market Snapshot
5.1.1. Introduction, Definition, and Key Findings
5.1.2. Market Growth & Y-o-Y Projections
5.1.3. Base Point Share Analysis
5.2. Global Test Automation Systems for Powertrain Dynamometer Market Value (US$ Mn) Analysis & Forecast, by Communication, 2017‒2031
5.2.1. Mobile
5.2.2. FlexRay
5.2.3. Web
5.2.4. Embedded Software
5.2.4.1. Modbus
5.2.4.2. Profibus
5.2.4.3. EtherCAT
5.2.4.4. Others
5.2.5. CAN Bus
5.2.5.1. Digital IO Module
5.2.5.2. Analog IO Module
5.2.5.3. Remote IO Module
5.2.5.4. ECU Connection (J1939)
5.2.5.5. TCU Connection (Linux Based)
5.2.6. Others
6. Global Test Automation Systems for Powertrain Dynamometer Market, by Vehicle Type
6.1. Market Snapshot
6.1.1. Introduction, Definition, and Key Findings
6.1.2. Market Growth & Y-o-Y Projections
6.1.3. Base Point Share Analysis
6.2. Global Test Automation Systems for Powertrain Dynamometer Market Value (US$ Mn) Analysis & Forecast, by Vehicle Type, 2017‒2031
6.2.1. Passenger Vehicle
6.2.2. Light Commercial Vehicle
6.2.3. Heavy Duty Truck
6.2.4. Bus & Coach
6.2.5. Motorcycle
6.2.6. Power Generation Set
6.2.7. Motorsport
6.2.7.1. Autocross
6.2.7.2. Hill climb
6.2.7.3. Karting
6.2.7.4. Circuit Racing
6.2.7.5. Rally Cross
6.2.7.6. Others
6.2.8. Powersports
6.2.8.1. Snowmobile
6.2.8.2. Trikes
6.2.8.3. ATVs
6.2.8.4. UTVs
6.2.8.5. Jet Skis
6.2.8.6. Others
6.2.9. Agriculture Vehicle
6.2.9.1. Less than 30 HP
6.2.9.2. 30-100 HP
6.2.9.3. 101-200 HP
6.2.9.4. More Than 200 HP
7. Global Test Automation Systems for Powertrain Dynamometer Market, by Propulsion
7.1. Market Snapshot
7.1.1. Introduction, Definition, and Key Findings
7.1.2. Market Growth & Y-o-Y Projections
7.1.3. Base Point Share Analysis
7.2. Global Test Automation Systems for Powertrain Dynamometer Market Value (US$ Mn) Analysis & Forecast, by Propulsion, 2017‒2031
7.2.1. Internal Combustion Engine
7.2.2. Electric
7.2.2.1. Battery Electric
7.2.2.2. Hybrid Electric
7.2.2.3. Plug-in Hybrid Electric
8. Global Test Automation Systems for Powertrain Dynamometer Market, by Testing Type
8.1. Market Snapshot
8.1.1. Introduction, Definition, and Key Findings
8.1.2. Market Growth & Y-o-Y Projections
8.1.3. Base Point Share Analysis
8.2. Global Test Automation Systems for Powertrain Dynamometer Market Value (US$ Mn) Analysis & Forecast, by Testing Type, 2017‒2031
8.2.1. Durability Test
8.2.2. Performance Test
8.2.3. Vehicle Simulation
8.2.4. Others
9. Global Test Automation Systems for Powertrain Dynamometer Market, by Region
9.1. Market Snapshot
9.1.1. Introduction, Definition, and Key Findings
9.1.2. Market Growth & Y-o-Y Projections
9.1.3. Base Point Share Analysis
9.2. Global Test Automation Systems for Powertrain Dynamometer Market Value (US$ Mn) Analysis & Forecast, by Region, 2017‒2031
9.2.1. North America
9.2.2. Europe
9.2.3. Asia Pacific
9.2.4. Middle East & Africa
9.2.5. South America
10. North America Test Automation Systems for Powertrain Dynamometer Market
10.1. Market Snapshot
10.2. North America Test Automation Systems for Powertrain Dynamometer Market Value (US$ Mn) Analysis & Forecast, by Communication, 2017‒2031
10.2.1. Mobile
10.2.2. FlexRay
10.2.3. Web
10.2.4. Embedded Software
10.2.4.1. Modbus
10.2.4.2. Profibus
10.2.4.3. EtherCAT
10.2.4.4. Others
10.2.5. CAN Bus
10.2.5.1. Digital IO Module
10.2.5.2. Analog IO Module
10.2.5.3. Remote IO Module
10.2.5.4. ECU Connection (J1939)
10.2.5.5. TCU Connection (Linux Based)
10.2.6. Others
10.3. North America Test Automation Systems for Powertrain Dynamometer Market Value (US$ Mn) Analysis & Forecast, by Vehicle Type, 2017‒2031
10.3.1. Passenger Vehicle
10.3.2. Light Commercial Vehicle
10.3.3. Heavy Duty Truck
10.3.4. Bus & Coach
10.3.5. Motorcycle
10.3.6. Power Generation Set
10.3.7. Motorsport
10.3.7.1. Autocross
10.3.7.2. Hill climb
10.3.7.3. Karting
10.3.7.4. Circuit Racing
10.3.7.5. Rally Cross
10.3.7.6. Others
10.3.8. Powersports
10.3.8.1. Snowmobile
10.3.8.2. Trikes
10.3.8.3. ATVs
10.3.8.4. UTVs
10.3.8.5. Jet Skis
10.3.8.6. Others
10.3.9. Agriculture Vehicle
10.3.9.1. Less than 30 HP
10.3.9.2. 30-100 HP
10.3.9.3. 101-200 HP
10.3.9.4. More Than 200 HP
10.4. North America Test Automation Systems for Powertrain Dynamometer Market Value (US$ Mn) Analysis & Forecast, by Propulsion, 2017‒2031
10.4.1. Internal Combustion Engine
10.4.2. Electric
10.4.2.1. Battery Electric
10.4.2.2. Hybrid Electric
10.4.2.3. Plug-in Hybrid Electric
10.5. North America Test Automation Systems for Powertrain Dynamometer Market Value (US$ Mn) Analysis & Forecast, by Testing Type, 2017‒2031
10.5.1. Durability Test
10.5.2. Performance Test
10.5.3. Vehicle Simulation
10.5.4. Others
10.6. North America Test Automation Systems for Powertrain Dynamometer Market Value (US$ Mn) Analysis & Forecast, by Country, 2017‒2031
10.6.1. The U. S.
10.6.2. Canada
10.6.3. Mexico
10.7. U.S. Test Automation Systems for Powertrain Dynamometer Market
10.7.1. U.S. Test Automation Systems for Powertrain Dynamometer Market Value (US$ Mn) Analysis & Forecast, by Communication, 2017‒2031
10.7.1.1. Mobile
10.7.1.2. FlexRay
10.7.1.3. Web
10.7.1.4. Embedded Software
10.7.1.4.1. Modbus
10.7.1.4.2. Profibus
10.7.1.4.3. EtherCAT
10.7.1.4.4. Others
10.7.1.5. CAN Bus
10.7.1.5.1. Digital IO Module
10.7.1.5.2. Analog IO Module
10.7.1.5.3. Remote IO Module
10.7.1.5.4. ECU Connection (J1939)
10.7.1.5.5. TCU Connection (Linux Based)
10.7.1.6. Others
10.7.2. U.S. Test Automation Systems for Powertrain Dynamometer Market Value (US$ Mn) Analysis & Forecast, by Vehicle Type, 2017‒2031
10.7.2.1. Passenger Vehicle
10.7.2.2. Light Commercial Vehicle
10.7.2.3. Heavy Duty Truck
10.7.2.4. Bus & Coach
10.7.2.5. Motorcycle
10.7.2.6. Power Generation Set
10.7.2.7. Motorsport
10.7.2.7.1. Autocross
10.7.2.7.2. Hill climb
10.7.2.7.3. Karting
10.7.2.7.4. Circuit Racing
10.7.2.7.5. Rally Cross
10.7.2.7.6. Others
10.7.2.8. Powersports
10.7.2.8.1. Snowmobile
10.7.2.8.2. Trikes
10.7.2.8.3. ATVs
10.7.2.8.4. UTVs
10.7.2.8.5. Jet Skis
10.7.2.8.6. Others
10.7.2.9. Agriculture Vehicle
10.7.2.9.1. Less than 30 HP
10.7.2.9.2. 30-100 HP
10.7.2.9.3. 101-200 HP
10.7.2.9.4. More Than 200 HP
10.7.3. U.S. Test Automation Systems for Powertrain Dynamometer Market Value (US$ Mn) Analysis & Forecast, by Propulsion, 2017‒2031
10.7.3.1. Internal Combustion Engine
10.7.3.2. Electric
10.7.3.2.1. Battery Electric
10.7.3.2.2. Hybrid Electric
10.7.3.2.3. Plug-in Hybrid Electric
10.7.4. U.S. Test Automation Systems for Powertrain Dynamometer Market Value (US$ Mn) Analysis & Forecast, by Testing Type, 2017‒2031
10.7.4.1. Durability Test
10.7.4.2. Performance Test
10.7.4.3. Vehicle Simulation
10.7.4.4. Others
10.8. Canada Test Automation Systems for Powertrain Dynamometer Market
10.8.1. Canada Test Automation Systems for Powertrain Dynamometer Market Value (US$ Mn) Analysis & Forecast, by Communication, 2017‒2031
10.8.1.1. Mobile
10.8.1.2. FlexRay
10.8.1.3. Web
10.8.1.4. Embedded Software
10.8.1.4.1. Modbus
10.8.1.4.2. Profibus
10.8.1.4.3. EtherCAT
10.8.1.4.4. Others
10.8.1.5. CAN Bus
10.8.1.5.1. Digital IO Module
10.8.1.5.2. Analog IO Module
10.8.1.5.3. Remote IO Module
10.8.1.5.4. ECU Connection (J1939)
10.8.1.5.5. TCU Connection (Linux Based)
10.8.1.6. Others
10.8.2. Canada Test Automation Systems for Powertrain Dynamometer Market Value (US$ Mn) Analysis & Forecast, by Vehicle Type, 2017‒2031
10.8.2.1. Passenger Vehicle
10.8.2.2. Light Commercial Vehicle
10.8.2.3. Heavy Duty Truck
10.8.2.4. Bus & Coach
10.8.2.5. Motorcycle
10.8.2.6. Power Generation Set
10.8.2.7. Motorsport
10.8.2.7.1. Autocross
10.8.2.7.2. Hill climb
10.8.2.7.3. Karting
10.8.2.7.4. Circuit Racing
10.8.2.7.5. Rally Cross
10.8.2.7.6. Others
10.8.2.8. Powersports
10.8.2.8.1. Snowmobile
10.8.2.8.2. Trikes
10.8.2.8.3. ATVs
10.8.2.8.4. UTVs
10.8.2.8.5. Jet Skis
10.8.2.8.6. Others
10.8.2.9. Agriculture Vehicle
10.8.2.9.1. Less than 30 HP
10.8.2.9.2. 30-100 HP
10.8.2.9.3. 101-200 HP
10.8.2.9.4. More Than 200 HP
10.8.3. Canada Test Automation Systems for Powertrain Dynamometer Market Value (US$ Mn) Analysis & Forecast, by Propulsion, 2017‒2031
10.8.3.1. Internal Combustion Engine
10.8.3.2. Electric
10.8.3.2.1. Battery Electric
10.8.3.2.2. Hybrid Electric
10.8.3.2.3. Plug-in Hybrid Electric
10.8.4. Canada Test Automation Systems for Powertrain Dynamometer Market Value (US$ Mn) Analysis & Forecast, by Testing Type, 2017‒2031
10.8.4.1. Durability Test
10.8.4.2. Performance Test
10.8.4.3. Vehicle Simulation
10.8.4.4. Others
10.9. Mexico Test Automation Systems for Powertrain Dynamometer Market
10.9.1. Mexico Test Automation Systems for Powertrain Dynamometer Market Value (US$ Mn) Analysis & Forecast, by Communication, 2017‒2031
10.9.1.1. Mobile
10.9.1.2. FlexRay
10.9.1.3. Web
10.9.1.4. Embedded Software
10.9.1.4.1. Modbus
10.9.1.4.2. Profibus
10.9.1.4.3. EtherCAT
10.9.1.4.4. Others
10.9.1.5. CAN Bus
10.9.1.5.1. Digital IO Module
10.9.1.5.2. Analog IO Module
10.9.1.5.3. Remote IO Module
10.9.1.5.4. ECU Connection (J1939)
10.9.1.5.5. TCU Connection (Linux Based)
10.9.1.6. Others
10.9.2. Mexico Test Automation Systems for Powertrain Dynamometer Market Value (US$ Mn) Analysis & Forecast, by Vehicle Type, 2017‒2031
10.9.2.1. Passenger Vehicle
10.9.2.2. Light Commercial Vehicle
10.9.2.3. Heavy Duty Truck
10.9.2.4. Bus & Coach
10.9.2.5. Motorcycle
10.9.2.6. Power Generation Set
10.9.2.7. Motorsport
10.9.2.7.1. Autocross
10.9.2.7.2. Hill climb
10.9.2.7.3. Karting
10.9.2.7.4. Circuit Racing
10.9.2.7.5. Rally Cross
10.9.2.7.6. Others
10.9.2.8. Powersports
10.9.2.8.1. Snowmobile
10.9.2.8.2. Trikes
10.9.2.8.3. ATVs
10.9.2.8.4. UTVs
10.9.2.8.5. Jet Skis
10.9.2.8.6. Others
10.9.2.9. Agriculture Vehicle
10.9.2.9.1. Less than 30 HP
10.9.2.9.2. 30-100 HP
10.9.2.9.3. 101-200 HP
10.9.2.9.4. More Than 200 HP
10.9.3. Mexico Test Automation Systems for Powertrain Dynamometer Market Value (US$ Mn) Analysis & Forecast, by Propulsion, 2017‒2031
10.9.3.1. Internal Combustion Engine
10.9.3.2. Electric
10.9.3.2.1. Battery Electric
10.9.3.2.2. Hybrid Electric
10.9.3.2.3. Plug-in Hybrid Electric
10.9.4. Mexico Test Automation Systems for Powertrain Dynamometer Market Value (US$ Mn) Analysis & Forecast, by Testing Type, 2017‒2031
10.9.4.1. Durability Test
10.9.4.2. Performance Test
10.9.4.3. Vehicle Simulation
10.9.4.4. Others
11. Europe Test Automation Systems for Powertrain Dynamometer Market
11.1. Market Snapshot
11.2. Europe Test Automation Systems for Powertrain Dynamometer Market Value (US$ Mn) Analysis & Forecast, by Communication, 2017‒2031
11.2.1. Mobile
11.2.2. FlexRay
11.2.3. Web
11.2.4. Embedded Software
11.2.4.1. Modbus
11.2.4.2. Profibus
11.2.4.3. EtherCAT
11.2.4.4. Others
11.2.5. CAN Bus
11.2.5.1. Digital IO Module
11.2.5.2. Analog IO Module
11.2.5.3. Remote IO Module
11.2.5.4. ECU Connection (J1939)
11.2.5.5. TCU Connection (Linux Based)
11.2.6. Others
11.3. Europe Test Automation Systems for Powertrain Dynamometer Market Value (US$ Mn) Analysis & Forecast, by Vehicle Type, 2017‒2031
11.3.1. Passenger Vehicle
11.3.2. Light Commercial Vehicle
11.3.3. Heavy Duty Truck
11.3.4. Bus & Coach
11.3.5. Motorcycle
11.3.6. Power Generation Set
11.3.7. Motorsport
11.3.7.1. Autocross
11.3.7.2. Hill climb
11.3.7.3. Karting
11.3.7.4. Circuit Racing
11.3.7.5. Rally Cross
11.3.7.6. Others
11.3.8. Powersports
11.3.8.1. Snowmobile
11.3.8.2. Trikes
11.3.8.3. ATVs
11.3.8.4. UTVs
11.3.8.5. Jet Skis
11.3.8.6. Others
11.3.9. Agriculture Vehicle
11.3.9.1. Less than 30 HP
11.3.9.2. 30-100 HP
11.3.9.3. 101-200 HP
11.3.9.4. More Than 200 HP
11.4. Europe Test Automation Systems for Powertrain Dynamometer Market Value (US$ Mn) Analysis & Forecast, by Propulsion, 2017‒2031
11.4.1. Internal Combustion Engine
11.4.2. Electric
11.4.2.1. Battery Electric
11.4.2.2. Hybrid Electric
11.4.2.3. Plug-in Hybrid Electric
11.5. Europe Test Automation Systems for Powertrain Dynamometer Market Value (US$ Mn) Analysis & Forecast, by Testing Type, 2017‒2031
11.5.1. Durability Test
11.5.2. Performance Test
11.5.3. Vehicle Simulation
11.5.4. Others
11.6. Europe Test Automation Systems for Powertrain Dynamometer Market Value (US$ Mn) Analysis & Forecast, by Country & Sub-region, 2017‒2031
11.6.1. Germany
11.6.2. U. K.
11.6.3. France
11.6.4. Italy
11.6.5. Spain
11.6.6. Nordic Countries
11.6.7. Russia & CIS
11.6.8. Rest of Europe
11.7. Germany Test Automation Systems for Powertrain Dynamometer Market
11.7.1. Germany Test Automation Systems for Powertrain Dynamometer Market Value (US$ Mn) Analysis & Forecast, by Communication, 2017‒2031
11.7.1.1. Mobile
11.7.1.2. FlexRay
11.7.1.3. Web
11.7.1.4. Embedded Software
11.7.1.4.1. Modbus
11.7.1.4.2. Profibus
11.7.1.4.3. EtherCAT
11.7.1.4.4. Others
11.7.1.5. CAN Bus
11.7.1.5.1. Digital IO Module
11.7.1.5.2. Analog IO Module
11.7.1.5.3. Remote IO Module
11.7.1.5.4. ECU Connection (J1939)
11.7.1.5.5. TCU Connection (Linux Based)
11.7.1.6. Others
11.7.2. Germany Test Automation Systems for Powertrain Dynamometer Market Value (US$ Mn) Analysis & Forecast, by Vehicle Type, 2017‒2031
11.7.2.1. Passenger Vehicle
11.7.2.2. Light Commercial Vehicle
11.7.2.3. Heavy Duty Truck
11.7.2.4. Bus & Coach
11.7.2.5. Motorcycle
11.7.2.6. Power Generation Set
11.7.2.7. Motorsport
11.7.2.7.1. Autocross
11.7.2.7.2. Hill climb
11.7.2.7.3. Karting
11.7.2.7.4. Circuit Racing
11.7.2.7.5. Rally Cross
11.7.2.7.6. Others
11.7.2.8. Powersports
11.7.2.8.1. Snowmobile
11.7.2.8.2. Trikes
11.7.2.8.3. ATVs
11.7.2.8.4. UTVs
11.7.2.8.5. Jet Skis
11.7.2.8.6. Others
11.7.2.9. Agriculture Vehicle
11.7.2.9.1. Less than 30 HP
11.7.2.9.2. 30-100 HP
11.7.2.9.3. 101-200 HP
11.7.2.9.4. More Than 200 HP
11.7.3. Germany Test Automation Systems for Powertrain Dynamometer Market Value (US$ Mn) Analysis & Forecast, by Propulsion, 2017‒2031
11.7.3.1. Internal Combustion Engine
11.7.3.2. Electric
11.7.3.2.1. Battery Electric
11.7.3.2.2. Hybrid Electric
11.7.3.2.3. Plug-in Hybrid Electric
11.7.4. Germany Test Automation Systems for Powertrain Dynamometer Market Value (US$ Mn) Analysis & Forecast, by Testing Type, 2017‒2031
11.7.4.1. Durability Test
11.7.4.2. Performance Test
11.7.4.3. Vehicle Simulation
11.7.4.4. Others
11.8. U.K. Test Automation Systems for Powertrain Dynamometer Market
11.8.1. U.K. Test Automation Systems for Powertrain Dynamometer Market Value (US$ Mn) Analysis & Forecast, by Communication, 2017‒2031
11.8.1.1. Mobile
11.8.1.2. FlexRay
11.8.1.3. Web
11.8.1.4. Embedded Software
11.8.1.4.1. Modbus
11.8.1.4.2. Profibus
11.8.1.4.3. EtherCAT
11.8.1.4.4. Others
11.8.1.5. CAN Bus
11.8.1.5.1. Digital IO Module
11.8.1.5.2. Analog IO Module
11.8.1.5.3. Remote IO Module
11.8.1.5.4. ECU Connection (J1939)
11.8.1.5.5. TCU Connection (Linux Based)
11.8.1.6. Others
11.8.2. U.K. Test Automation Systems for Powertrain Dynamometer Market Value (US$ Mn) Analysis & Forecast, by Vehicle Type, 2017‒2031
11.8.2.1. Passenger Vehicle
11.8.2.2. Light Commercial Vehicle
11.8.2.3. Heavy Duty Truck
11.8.2.4. Bus & Coach
11.8.2.5. Motorcycle
11.8.2.6. Power Generation Set
11.8.2.7. Motorsport
11.8.2.7.1. Autocross
11.8.2.7.2. Hill climb
11.8.2.7.3. Karting
11.8.2.7.4. Circuit Racing
11.8.2.7.5. Rally Cross
11.8.2.7.6. Others
11.8.2.8. Powersports
11.8.2.8.1. Snowmobile
11.8.2.8.2. Trikes
11.8.2.8.3. ATVs
11.8.2.8.4. UTVs
11.8.2.8.5. Jet Skis
11.8.2.8.6. Others
11.8.2.9. Agriculture Vehicle
11.8.2.9.1. Less than 30 HP
11.8.2.9.2. 30-100 HP
11.8.2.9.3. 101-200 HP
11.8.2.9.4. More Than 200 HP
11.8.3. U.K. Test Automation Systems for Powertrain Dynamometer Market Value (US$ Mn) Analysis & Forecast, by Propulsion, 2017‒2031
11.8.3.1. Internal Combustion Engine
11.8.3.2. Electric
11.8.3.2.1. Battery Electric
11.8.3.2.2. Hybrid Electric
11.8.3.2.3. Plug-in Hybrid Electric
11.8.4. U.K. Test Automation Systems for Powertrain Dynamometer Market Value (US$ Mn) Analysis & Forecast, by Testing Type, 2017‒2031
11.8.4.1. Durability Test
11.8.4.2. Performance Test
11.8.4.3. Vehicle Simulation
11.8.4.4. Others
11.9. France Test Automation Systems for Powertrain Dynamometer Market
11.9.1. France Test Automation Systems for Powertrain Dynamometer Market Value (US$ Mn) Analysis & Forecast, by Communication, 2017‒2031
11.9.1.1. Mobile
11.9.1.2. FlexRay
11.9.1.3. Web
11.9.1.4. Embedded Software
11.9.1.4.1. Modbus
11.9.1.4.2. Profibus
11.9.1.4.3. EtherCAT
11.9.1.4.4. Others
11.9.1.5. CAN Bus
11.9.1.5.1. Digital IO Module
11.9.1.5.2. Analog IO Module
11.9.1.5.3. Remote IO Module
11.9.1.5.4. ECU Connection (J1939)
11.9.1.5.5. TCU Connection (Linux Based)
11.9.1.6. Others
11.9.2. France Test Automation Systems for Powertrain Dynamometer Market Value (US$ Mn) Analysis & Forecast, by Vehicle Type, 2017‒2031
11.9.2.1. Passenger Vehicle
11.9.2.2. Light Commercial Vehicle
11.9.2.3. Heavy Duty Truck
11.9.2.4. Bus & Coach
11.9.2.5. Motorcycle
11.9.2.6. Power Generation Set
11.9.2.7. Motorsport
11.9.2.7.1. Autocross
11.9.2.7.2. Hill climb
11.9.2.7.3. Karting
11.9.2.7.4. Circuit Racing
11.9.2.7.5. Rally Cross
11.9.2.7.6. Others
11.9.2.8. Powersports
11.9.2.8.1. Snowmobile
11.9.2.8.2. Trikes
11.9.2.8.3. ATVs
11.9.2.8.4. UTVs
11.9.2.8.5. Jet Skis
11.9.2.8.6. Others
11.9.2.9. Agriculture Vehicle
11.9.2.9.1. Less than 30 HP
11.9.2.9.2. 30-100 HP
11.9.2.9.3. 101-200 HP
11.9.2.9.4. More Than 200 HP
11.9.3. France Test Automation Systems for Powertrain Dynamometer Market Value (US$ Mn) Analysis & Forecast, by Propulsion, 2017‒2031
11.9.3.1. Internal Combustion Engine
11.9.3.2. Electric
11.9.3.2.1. Battery Electric
11.9.3.2.2. Hybrid Electric
11.9.3.2.3. Plug-in Hybrid Electric
11.9.4. France Test Automation Systems for Powertrain Dynamometer Market Value (US$ Mn) Analysis & Forecast, by Testing Type, 2017‒2031
11.9.4.1. Durability Test
11.9.4.2. Performance Test
11.9.4.3. Vehicle Simulation
11.9.4.4. Others
11.10. Italy Test Automation Systems for Powertrain Dynamometer Market
11.10.1. Italy Test Automation Systems for Powertrain Dynamometer Market Value (US$ Mn) Analysis & Forecast, by Communication, 2017‒2031
11.10.1.1. Mobile
11.10.1.2. FlexRay
11.10.1.3. Web
11.10.1.4. Embedded Software
11.10.1.4.1. Modbus
11.10.1.4.2. Profibus
11.10.1.4.3. EtherCAT
11.10.1.4.4. Others
11.10.1.5. CAN Bus
11.10.1.5.1. Digital IO Module
11.10.1.5.2. Analog IO Module
11.10.1.5.3. Remote IO Module
11.10.1.5.4. ECU Connection (J1939)
11.10.1.5.5. TCU Connection (Linux Based)
11.10.1.6. Others
11.10.2. Italy Test Automation Systems for Powertrain Dynamometer Market Value (US$ Mn) Analysis & Forecast, by Vehicle Type, 2017‒2031
11.10.2.1. Passenger Vehicle
11.10.2.2. Light Commercial Vehicle
11.10.2.3. Heavy Duty Truck
11.10.2.4. Bus & Coach
11.10.2.5. Motorcycle
11.10.2.6. Power Generation Set
11.10.2.7. Motorsport
11.10.2.7.1. Autocross
11.10.2.7.2. Hill climb
11.10.2.7.3. Karting
11.10.2.7.4. Circuit Racing
11.10.2.7.5. Rally Cross
11.10.2.7.6. Others
11.10.2.8. Powersports
11.10.2.8.1. Snowmobile
11.10.2.8.2. Trikes
11.10.2.8.3. ATVs
11.10.2.8.4. UTVs
11.10.2.8.5. Jet Skis
11.10.2.8.6. Others
11.10.2.9. Agriculture Vehicle
11.10.2.9.1. Less than 30 HP
11.10.2.9.2. 30-100 HP
11.10.2.9.3. 101-200 HP
11.10.2.9.4. More Than 200 HP
11.10.3. Italy Test Automation Systems for Powertrain Dynamometer Market Value (US$ Mn) Analysis & Forecast, by Propulsion, 2017‒2031
11.10.3.1. Internal Combustion Engine
11.10.3.2. Electric
11.10.3.2.1. Battery Electric
11.10.3.2.2. Hybrid Electric
11.10.3.2.3. Plug-in Hybrid Electric
11.10.4. Italy Test Automation Systems for Powertrain Dynamometer Market Value (US$ Mn) Analysis & Forecast, by Testing Type, 2017‒2031
11.10.4.1. Durability Test
11.10.4.2. Performance Test
11.10.4.3. Vehicle Simulation
11.10.4.4. Others
11.11. Spain Test Automation Systems for Powertrain Dynamometer Market
11.11.1. Spain Test Automation Systems for Powertrain Dynamometer Market Value (US$ Mn) Analysis & Forecast, by Communication, 2017‒2031
11.11.1.1. Mobile
11.11.1.2. FlexRay
11.11.1.3. Web
11.11.1.4. Embedded Software
11.11.1.4.1. Modbus
11.11.1.4.2. Profibus
11.11.1.4.3. EtherCAT
11.11.1.4.4. Others
11.11.1.5. CAN Bus
11.11.1.5.1. Digital IO Module
11.11.1.5.2. Analog IO Module
11.11.1.5.3. Remote IO Module
11.11.1.5.4. ECU Connection (J1939)
11.11.1.5.5. TCU Connection (Linux Based)
11.11.1.6. Others
11.11.2. Spain Test Automation Systems for Powertrain Dynamometer Market Value (US$ Mn) Analysis & Forecast, by Vehicle Type, 2017‒2031
11.11.2.1. Passenger Vehicle
11.11.2.2. Light Commercial Vehicle
11.11.2.3. Heavy Duty Truck
11.11.2.4. Bus & Coach
11.11.2.5. Motorcycle
11.11.2.6. Power Generation Set
11.11.2.7. Motorsport
11.11.2.7.1. Autocross
11.11.2.7.2. Hill climb
11.11.2.7.3. Karting
11.11.2.7.4. Circuit Racing
11.11.2.7.5. Rally Cross
11.11.2.7.6. Others
11.11.2.8. Powersports
11.11.2.8.1. Snowmobile
11.11.2.8.2. Trikes
11.11.2.8.3. ATVs
11.11.2.8.4. UTVs
11.11.2.8.5. Jet Skis
11.11.2.8.6. Others
11.11.2.9. Agriculture Vehicle
11.11.2.9.1. Less than 30 HP
11.11.2.9.2. 30-100 HP
11.11.2.9.3. 101-200 HP
11.11.2.9.4. More Than 200 HP
11.11.3. Spain Test Automation Systems for Powertrain Dynamometer Market Value (US$ Mn) Analysis & Forecast, by Propulsion, 2017‒2031
11.11.3.1. Internal Combustion Engine
11.11.3.2. Electric
11.11.3.2.1. Battery Electric
11.11.3.2.2. Hybrid Electric
11.11.3.2.3. Plug-in Hybrid Electric
11.11.4. Spain Test Automation Systems for Powertrain Dynamometer Market Value (US$ Mn) Analysis & Forecast, by Testing Type, 2017‒2031
11.11.4.1. Durability Test
11.11.4.2. Performance Test
11.11.4.3. Vehicle Simulation
11.11.4.4. Others
11.12. Nordic Countries Test Automation Systems for Powertrain Dynamometer Market
11.12.1. Nordic Countries Test Automation Systems for Powertrain Dynamometer Market Value (US$ Mn) Analysis & Forecast, by Communication, 2017‒2031
11.12.1.1. Mobile
11.12.1.2. FlexRay
11.12.1.3. Web
11.12.1.4. Embedded Software
11.12.1.4.1. Modbus
11.12.1.4.2. Profibus
11.12.1.4.3. EtherCAT
11.12.1.4.4. Others
11.12.1.5. CAN Bus
11.12.1.5.1. Digital IO Module
11.12.1.5.2. Analog IO Module
11.12.1.5.3. Remote IO Module
11.12.1.5.4. ECU Connection (J1939)
11.12.1.5.5. TCU Connection (Linux Based)
11.12.1.6. Others
11.12.2. Nordic Countries Test Automation Systems for Powertrain Dynamometer Market Value (US$ Mn) Analysis & Forecast, by Vehicle Type, 2017‒2031
11.12.2.1. Passenger Vehicle
11.12.2.2. Light Commercial Vehicle
11.12.2.3. Heavy Duty Truck
11.12.2.4. Bus & Coach
11.12.2.5. Motorcycle
11.12.2.6. Power Generation Set
11.12.2.7. Motorsport
11.12.2.7.1. Autocross
11.12.2.7.2. Hill climb
11.12.2.7.3. Karting
11.12.2.7.4. Circuit Racing
11.12.2.7.5. Rally Cross
11.12.2.7.6. Others
11.12.2.8. Powersports
11.12.2.8.1. Snowmobile
11.12.2.8.2. Trikes
11.12.2.8.3. ATVs
11.12.2.8.4. UTVs
11.12.2.8.5. Jet Skis
11.12.2.8.6. Others
11.12.2.9. Agriculture Vehicle
11.12.2.9.1. Less than 30 HP
11.12.2.9.2. 30-100 HP
11.12.2.9.3. 101-200 HP
11.12.2.9.4. More Than 200 HP
11.12.3. Nordic Countries Test Automation Systems for Powertrain Dynamometer Market Value (US$ Mn) Analysis & Forecast, by Propulsion, 2017‒2031
11.12.3.1. Internal Combustion Engine
11.12.3.2. Electric
11.12.3.2.1. Battery Electric
11.12.3.2.2. Hybrid Electric
11.12.3.2.3. Plug-in Hybrid Electric
11.12.4. Nordic Countries Test Automation Systems for Powertrain Dynamometer Market Value (US$ Mn) Analysis & Forecast, by Testing Type, 2017‒2031
11.12.4.1. Durability Test
11.12.4.2. Performance Test
11.12.4.3. Vehicle Simulation
11.12.4.4. Others
11.13. Russia & CIS Test Automation Systems for Powertrain Dynamometer Market
11.13.1. Russia & CIS Test Automation Systems for Powertrain Dynamometer Market Value (US$ Mn) Analysis & Forecast, by Communication, 2017‒2031
11.13.1.1. Mobile
11.13.1.2. FlexRay
11.13.1.3. Web
11.13.1.4. Embedded Software
11.13.1.4.1. Modbus
11.13.1.4.2. Profibus
11.13.1.4.3. EtherCAT
11.13.1.4.4. Others
11.13.1.5. CAN Bus
11.13.1.5.1. Digital IO Module
11.13.1.5.2. Analog IO Module
11.13.1.5.3. Remote IO Module
11.13.1.5.4. ECU Connection (J1939)
11.13.1.5.5. TCU Connection (Linux Based)
11.13.1.6. Others
11.13.2. Russia & CIS Test Automation Systems for Powertrain Dynamometer Market Value (US$ Mn) Analysis & Forecast, by Vehicle Type, 2017‒2031
11.13.2.1. Passenger Vehicle
11.13.2.2. Light Commercial Vehicle
11.13.2.3. Heavy Duty Truck
11.13.2.4. Bus & Coach
11.13.2.5. Motorcycle
11.13.2.6. Power Generation Set
11.13.2.7. Motorsport
11.13.2.7.1. Autocross
11.13.2.7.2. Hill climb
11.13.2.7.3. Karting
11.13.2.7.4. Circuit Racing
11.13.2.7.5. Rally Cross
11.13.2.7.6. Others
11.13.2.8. Powersports
11.13.2.8.1. Snowmobile
11.13.2.8.2. Trikes
11.13.2.8.3. ATVs
11.13.2.8.4. UTVs
11.13.2.8.5. Jet Skis
11.13.2.8.6. Others
11.13.2.9. Agriculture Vehicle
11.13.2.9.1. Less than 30 HP
11.13.2.9.2. 30-100 HP
11.13.2.9.3. 101-200 HP
11.13.2.9.4. More Than 200 HP
11.13.3. Russia & CIS Test Automation Systems for Powertrain Dynamometer Market Value (US$ Mn) Analysis & Forecast, by Propulsion, 2017‒2031
11.13.3.1. Internal Combustion Engine
11.13.3.2. Electric
11.13.3.2.1. Battery Electric
11.13.3.2.2. Hybrid Electric
11.13.3.2.3. Plug-in Hybrid Electric
11.13.4. Russia & CIS Test Automation Systems for Powertrain Dynamometer Market Value (US$ Mn) Analysis & Forecast, by Testing Type, 2017‒2031
11.13.4.1. Durability Test
11.13.4.2. Performance Test
11.13.4.3. Vehicle Simulation
11.13.4.4. Others
11.14. Rest of Europe Test Automation Systems for Powertrain Dynamometer Market
11.14.1. Rest of Europe Test Automation Systems for Powertrain Dynamometer Market Value (US$ Mn) Analysis & Forecast, by Communication, 2017‒2031
11.14.1.1. Mobile
11.14.1.2. FlexRay
11.14.1.3. Web
11.14.1.4. Embedded Software
11.14.1.4.1. Modbus
11.14.1.4.2. Profibus
11.14.1.4.3. EtherCAT
11.14.1.4.4. Others
11.14.1.5. CAN Bus
11.14.1.5.1. Digital IO Module
11.14.1.5.2. Analog IO Module
11.14.1.5.3. Remote IO Module
11.14.1.5.4. ECU Connection (J1939)
11.14.1.5.5. TCU Connection (Linux Based)
11.14.1.6. Others
11.14.2. Rest of Europe Test Automation Systems for Powertrain Dynamometer Market Value (US$ Mn) Analysis & Forecast, by Vehicle Type, 2017‒2031
11.14.2.1. Passenger Vehicle
11.14.2.2. Light Commercial Vehicle
11.14.2.3. Heavy Duty Truck
11.14.2.4. Bus & Coach
11.14.2.5. Motorcycle
11.14.2.6. Power Generation Set
11.14.2.7. Motorsport
11.14.2.7.1. Autocross
11.14.2.7.2. Hill climb
11.14.2.7.3. Karting
11.14.2.7.4. Circuit Racing
11.14.2.7.5. Rally Cross
11.14.2.7.6. Others
11.14.2.8. Powersports
11.14.2.8.1. Snowmobile
11.14.2.8.2. Trikes
11.14.2.8.3. ATVs
11.14.2.8.4. UTVs
11.14.2.8.5. Jet Skis
11.14.2.8.6. Others
11.14.2.9. Agriculture Vehicle
11.14.2.9.1. Less than 30 HP
11.14.2.9.2. 30-100 HP
11.14.2.9.3. 101-200 HP
11.14.2.9.4. More Than 200 HP
11.14.3. Rest of Europe Test Automation Systems for Powertrain Dynamometer Market Value (US$ Mn) Analysis & Forecast, by Propulsion, 2017‒2031
11.14.3.1. Internal Combustion Engine
11.14.3.2. Electric
11.14.3.2.1. Battery Electric
11.14.3.2.2. Hybrid Electric
11.14.3.2.3. Plug-in Hybrid Electric
11.14.4. Rest of Europe Test Automation Systems for Powertrain Dynamometer Market Value (US$ Mn) Analysis & Forecast, by Testing Type, 2017‒2031
11.14.4.1. Durability Test
11.14.4.2. Performance Test
11.14.4.3. Vehicle Simulation
11.14.4.4. Others
12. Asia Pacific Test Automation Systems for Powertrain Dynamometer Market
12.1. Market Snapshot
12.2. Asia Pacific Test Automation Systems for Powertrain Dynamometer Market Value (US$ Mn) Analysis & Forecast, by Communication, 2017‒2031
12.2.1. Mobile
12.2.2. FlexRay
12.2.3. Web
12.2.4. Embedded Software
12.2.4.1. Modbus
12.2.4.2. Profibus
12.2.4.3. EtherCAT
12.2.4.4. Others
12.2.5. CAN Bus
12.2.5.1. Digital IO Module
12.2.5.2. Analog IO Module
12.2.5.3. Remote IO Module
12.2.5.4. ECU Connection (J1939)
12.2.5.5. TCU Connection (Linux Based)
12.2.6. Others
12.3. Asia Pacific Test Automation Systems for Powertrain Dynamometer Market Value (US$ Mn) Analysis & Forecast, by Vehicle Type, 2017‒2031
12.3.1. Passenger Vehicle
12.3.2. Light Commercial Vehicle
12.3.3. Heavy Duty Truck
12.3.4. Bus & Coach
12.3.5. Motorcycle
12.3.6. Power Generation Set
12.3.7. Motorsport
12.3.7.1. Autocross
12.3.7.2. Hill climb
12.3.7.3. Karting
12.3.7.4. Circuit Racing
12.3.7.5. Rally Cross
12.3.7.6. Others
12.3.8. Powersports
12.3.8.1. Snowmobile
12.3.8.2. Trikes
12.3.8.3. ATVs
12.3.8.4. UTVs
12.3.8.5. Jet Skis
12.3.8.6. Others
12.3.9. Agriculture Vehicle
12.3.9.1. Less than 30 HP
12.3.9.2. 30-100 HP
12.3.9.3. 101-200 HP
12.3.9.4. More Than 200 HP
12.4. Asia Pacific Test Automation Systems for Powertrain Dynamometer Market Value (US$ Mn) Analysis & Forecast, by Propulsion, 2017‒2031
12.4.1. Internal Combustion Engine
12.4.2. Electric
12.4.2.1. Battery Electric
12.4.2.2. Hybrid Electric
12.4.2.3. Plug-in Hybrid Electric
12.5. Asia Pacific Test Automation Systems for Powertrain Dynamometer Market Value (US$ Mn) Analysis & Forecast, by Testing Type, 2017‒2031
12.5.1. Durability Test
12.5.2. Performance Test
12.5.3. Vehicle Simulation
12.5.4. Others
12.6. Asia Pacific Test Automation Systems for Powertrain Dynamometer Market Value (US$ Mn) Analysis & Forecast, by Country & Sub-region, 2017‒2031
12.6.1. China
12.6.2. India
12.6.3. Japan
12.6.4. ASEAN Countries
12.6.5. South Korea
12.6.6. ANZ
12.6.7. Rest of Asia Pacific
12.7. China Test Automation Systems for Powertrain Dynamometer Market
12.7.1. China Test Automation Systems for Powertrain Dynamometer Market Value (US$ Mn) Analysis & Forecast, by Communication, 2017‒2031
12.7.1.1. Mobile
12.7.1.2. FlexRay
12.7.1.3. Web
12.7.1.4. Embedded Software
12.7.1.4.1. Modbus
12.7.1.4.2. Profibus
12.7.1.4.3. EtherCAT
12.7.1.4.4. Others
12.7.1.5. CAN Bus
12.7.1.5.1. Digital IO Module
12.7.1.5.2. Analog IO Module
12.7.1.5.3. Remote IO Module
12.7.1.5.4. ECU Connection (J1939)
12.7.1.5.5. TCU Connection (Linux Based)
12.7.1.6. Others
12.7.2. China Test Automation Systems for Powertrain Dynamometer Market Value (US$ Mn) Analysis & Forecast, by Vehicle Type, 2017‒2031
12.7.2.1. Passenger Vehicle
12.7.2.2. Light Commercial Vehicle
12.7.2.3. Heavy Duty Truck
12.7.2.4. Bus & Coach
12.7.2.5. Motorcycle
12.7.2.6. Power Generation Set
12.7.2.7. Motorsport
12.7.2.7.1. Autocross
12.7.2.7.2. Hill climb
12.7.2.7.3. Karting
12.7.2.7.4. Circuit Racing
12.7.2.7.5. Rally Cross
12.7.2.7.6. Others
12.7.2.8. Powersports
12.7.2.8.1. Snowmobile
12.7.2.8.2. Trikes
12.7.2.8.3. ATVs
12.7.2.8.4. UTVs
12.7.2.8.5. Jet Skis
12.7.2.8.6. Others
12.7.2.9. Agriculture Vehicle
12.7.2.9.1. Less than 30 HP
12.7.2.9.2. 30-100 HP
12.7.2.9.3. 101-200 HP
12.7.2.9.4. More Than 200 HP
12.7.3. China Test Automation Systems for Powertrain Dynamometer Market Value (US$ Mn) Analysis & Forecast, by Propulsion, 2017‒2031
12.7.3.1. Internal Combustion Engine
12.7.3.2. Electric
12.7.3.2.1. Battery Electric
12.7.3.2.2. Hybrid Electric
12.7.3.2.3. Plug-in Hybrid Electric
12.7.4. China Test Automation Systems for Powertrain Dynamometer Market Value (US$ Mn) Analysis & Forecast, by Testing Type, 2017‒2031
12.7.4.1. Durability Test
12.7.4.2. Performance Test
12.7.4.3. Vehicle Simulation
12.7.4.4. Others
12.8. India Test Automation Systems for Powertrain Dynamometer Market
12.8.1. India Test Automation Systems for Powertrain Dynamometer Market Value (US$ Mn) Analysis & Forecast, by Communication, 2017‒2031
12.8.1.1. Mobile
12.8.1.2. FlexRay
12.8.1.3. Web
12.8.1.4. Embedded Software
12.8.1.4.1. Modbus
12.8.1.4.2. Profibus
12.8.1.4.3. EtherCAT
12.8.1.4.4. Others
12.8.1.5. CAN Bus
12.8.1.5.1. Digital IO Module
12.8.1.5.2. Analog IO Module
12.8.1.5.3. Remote IO Module
12.8.1.5.4. ECU Connection (J1939)
12.8.1.5.5. TCU Connection (Linux Based)
12.8.1.6. Others
12.8.2. India Test Automation Systems for Powertrain Dynamometer Market Value (US$ Mn) Analysis & Forecast, by Vehicle Type, 2017‒2031
12.8.2.1. Passenger Vehicle
12.8.2.2. Light Commercial Vehicle
12.8.2.3. Heavy Duty Truck
12.8.2.4. Bus & Coach
12.8.2.5. Motorcycle
12.8.2.6. Power Generation Set
12.8.2.7. Motorsport
12.8.2.7.1. Autocross
12.8.2.7.2. Hill climb
12.8.2.7.3. Karting
12.8.2.7.4. Circuit Racing
12.8.2.7.5. Rally Cross
12.8.2.7.6. Others
12.8.2.8. Powersports
12.8.2.8.1. Snowmobile
12.8.2.8.2. Trikes
12.8.2.8.3. ATVs
12.8.2.8.4. UTVs
12.8.2.8.5. Jet Skis
12.8.2.8.6. Others
12.8.2.9. Agriculture Vehicle
12.8.2.9.1. Less than 30 HP
12.8.2.9.2. 30-100 HP
12.8.2.9.3. 101-200 HP
12.8.2.9.4. More Than 200 HP
12.8.3. India Test Automation Systems for Powertrain Dynamometer Market Value (US$ Mn) Analysis & Forecast, by Propulsion, 2017‒2031
12.8.3.1. Internal Combustion Engine
12.8.3.2. Electric
12.8.3.2.1. Battery Electric
12.8.3.2.2. Hybrid Electric
12.8.3.2.3. Plug-in Hybrid Electric
12.8.4. India Test Automation Systems for Powertrain Dynamometer Market Value (US$ Mn) Analysis & Forecast, by Testing Type, 2017‒2031
12.8.4.1. Durability Test
12.8.4.2. Performance Test
12.8.4.3. Vehicle Simulation
12.8.4.4. Others
12.9. Japan Test Automation Systems for Powertrain Dynamometer Market
12.9.1. Japan Test Automation Systems for Powertrain Dynamometer Market Value (US$ Mn) Analysis & Forecast, by Communication, 2017‒2031
12.9.1.1. Mobile
12.9.1.2. FlexRay
12.9.1.3. Web
12.9.1.4. Embedded Software
12.9.1.4.1. Modbus
12.9.1.4.2. Profibus
12.9.1.4.3. EtherCAT
12.9.1.4.4. Others
12.9.1.5. CAN Bus
12.9.1.5.1. Digital IO Module
12.9.1.5.2. Analog IO Module
12.9.1.5.3. Remote IO Module
12.9.1.5.4. ECU Connection (J1939)
12.9.1.5.5. TCU Connection (Linux Based)
12.9.1.6. Others
12.9.2. Japan Test Automation Systems for Powertrain Dynamometer Market Value (US$ Mn) Analysis & Forecast, by Vehicle Type, 2017‒2031
12.9.2.1. Passenger Vehicle
12.9.2.2. Light Commercial Vehicle
12.9.2.3. Heavy Duty Truck
12.9.2.4. Bus & Coach
12.9.2.5. Motorcycle
12.9.2.6. Power Generation Set
12.9.2.7. Motorsport
12.9.2.7.1. Autocross
12.9.2.7.2. Hill climb
12.9.2.7.3. Karting
12.9.2.7.4. Circuit Racing
12.9.2.7.5. Rally Cross
12.9.2.7.6. Others
12.9.2.8. Powersports
12.9.2.8.1. Snowmobile
12.9.2.8.2. Trikes
12.9.2.8.3. ATVs
12.9.2.8.4. UTVs
12.9.2.8.5. Jet Skis
12.9.2.8.6. Others
12.9.2.9. Agriculture Vehicle
12.9.2.9.1. Less than 30 HP
12.9.2.9.2. 30-100 HP
12.9.2.9.3. 101-200 HP
12.9.2.9.4. More Than 200 HP
12.9.3. Japan Test Automation Systems for Powertrain Dynamometer Market Value (US$ Mn) Analysis & Forecast, by Propulsion, 2017‒2031
12.9.3.1. Internal Combustion Engine
12.9.3.2. Electric
12.9.3.2.1. Battery Electric
12.9.3.2.2. Hybrid Electric
12.9.3.2.3. Plug-in Hybrid Electric
12.9.4. Japan Test Automation Systems for Powertrain Dynamometer Market Value (US$ Mn) Analysis & Forecast, by Testing Type, 2017‒2031
12.9.4.1. Durability Test
12.9.4.2. Performance Test
12.9.4.3. Vehicle Simulation
12.9.4.4. Others
12.10. ASEAN Test Automation Systems for Powertrain Dynamometer Market
12.10.1. ASEAN Test Automation Systems for Powertrain Dynamometer Market Value (US$ Mn) Analysis & Forecast, by Communication, 2017‒2031
12.10.1.1. Mobile
12.10.1.2. FlexRay
12.10.1.3. Web
12.10.1.4. Embedded Software
12.10.1.4.1. Modbus
12.10.1.4.2. Profibus
12.10.1.4.3. EtherCAT
12.10.1.4.4. Others
12.10.1.5. CAN Bus
12.10.1.5.1. Digital IO Module
12.10.1.5.2. Analog IO Module
12.10.1.5.3. Remote IO Module
12.10.1.5.4. ECU Connection (J1939)
12.10.1.5.5. TCU Connection (Linux Based)
12.10.1.6. Others
12.10.2. ASEAN Test Automation Systems for Powertrain Dynamometer Market Value (US$ Mn) Analysis & Forecast, by Vehicle Type, 2017‒2031
12.10.2.1. Passenger Vehicle
12.10.2.2. Light Commercial Vehicle
12.10.2.3. Heavy Duty Truck
12.10.2.4. Bus & Coach
12.10.2.5. Motorcycle
12.10.2.6. Power Generation Set
12.10.2.7. Motorsport
12.10.2.7.1. Autocross
12.10.2.7.2. Hill climb
12.10.2.7.3. Karting
12.10.2.7.4. Circuit Racing
12.10.2.7.5. Rally Cross
12.10.2.7.6. Others
12.10.2.8. Powersports
12.10.2.8.1. Snowmobile
12.10.2.8.2. Trikes
12.10.2.8.3. ATVs
12.10.2.8.4. UTVs
12.10.2.8.5. Jet Skis
12.10.2.8.6. Others
12.10.2.9. Agriculture Vehicle
12.10.2.9.1. Less than 30 HP
12.10.2.9.2. 30-100 HP
12.10.2.9.3. 101-200 HP
12.10.2.9.4. More Than 200 HP
12.10.3. ASEAN Test Automation Systems for Powertrain Dynamometer Market Value (US$ Mn) Analysis & Forecast, by Propulsion, 2017‒2031
12.10.3.1. Internal Combustion Engine
12.10.3.2. Electric
12.10.3.2.1. Battery Electric
12.10.3.2.2. Hybrid Electric
12.10.3.2.3. Plug-in Hybrid Electric
12.10.4. ASEAN Test Automation Systems for Powertrain Dynamometer Market Value (US$ Mn) Analysis & Forecast, by Testing Type, 2017‒2031
12.10.4.1. Durability Test
12.10.4.2. Performance Test
12.10.4.3. Vehicle Simulation
12.10.4.4. Others
12.11. South Korea Test Automation Systems for Powertrain Dynamometer Market
12.11.1. South Korea Test Automation Systems for Powertrain Dynamometer Market Value (US$ Mn) Analysis & Forecast, by Communication, 2017‒2031
12.11.1.1. Mobile
12.11.1.2. FlexRay
12.11.1.3. Web
12.11.1.4. Embedded Software
12.11.1.4.1. Modbus
12.11.1.4.2. Profibus
12.11.1.4.3. EtherCAT
12.11.1.4.4. Others
12.11.1.5. CAN Bus
12.11.1.5.1. Digital IO Module
12.11.1.5.2. Analog IO Module
12.11.1.5.3. Remote IO Module
12.11.1.5.4. ECU Connection (J1939)
12.11.1.5.5. TCU Connection (Linux Based)
12.11.1.6. Others
12.11.2. South Korea Test Automation Systems for Powertrain Dynamometer Market Value (US$ Mn) Analysis & Forecast, by Vehicle Type, 2017‒2031
12.11.2.1. Passenger Vehicle
12.11.2.2. Light Commercial Vehicle
12.11.2.3. Heavy Duty Truck
12.11.2.4. Bus & Coach
12.11.2.5. Motorcycle
12.11.2.6. Power Generation Set
12.11.2.7. Motorsport
12.11.2.7.1. Autocross
12.11.2.7.2. Hill climb
12.11.2.7.3. Karting
12.11.2.7.4. Circuit Racing
12.11.2.7.5. Rally Cross
12.11.2.7.6. Others
12.11.2.8. Powersports
12.11.2.8.1. Snowmobile
12.11.2.8.2. Trikes
12.11.2.8.3. ATVs
12.11.2.8.4. UTVs
12.11.2.8.5. Jet Skis
12.11.2.8.6. Others
12.11.2.9. Agriculture Vehicle
12.11.2.9.1. Less than 30 HP
12.11.2.9.2. 30-100 HP
12.11.2.9.3. 101-200 HP
12.11.2.9.4. More Than 200 HP
12.11.3. South Korea Test Automation Systems for Powertrain Dynamometer Market Value (US$ Mn) Analysis & Forecast, by Propulsion, 2017‒2031
12.11.3.1. Internal Combustion Engine
12.11.3.2. Electric
12.11.3.2.1. Battery Electric
12.11.3.2.2. Hybrid Electric
12.11.3.2.3. Plug-in Hybrid Electric
12.11.4. South Korea Test Automation Systems for Powertrain Dynamometer Market Value (US$ Mn) Analysis & Forecast, by Testing Type, 2017‒2031
12.11.4.1. Durability Test
12.11.4.2. Performance Test
12.11.4.3. Vehicle Simulation
12.11.4.4. Others
12.12. ANZ Test Automation Systems for Powertrain Dynamometer Market
12.12.1. ANZ Test Automation Systems for Powertrain Dynamometer Market Value (US$ Mn) Analysis & Forecast, by Communication, 2017‒2031
12.12.1.1. Mobile
12.12.1.2. FlexRay
12.12.1.3. Web
12.12.1.4. Embedded Software
12.12.1.4.1. Modbus
12.12.1.4.2. Profibus
12.12.1.4.3. EtherCAT
12.12.1.4.4. Others
12.12.1.5. CAN Bus
12.12.1.5.1. Digital IO Module
12.12.1.5.2. Analog IO Module
12.12.1.5.3. Remote IO Module
12.12.1.5.4. ECU Connection (J1939)
12.12.1.5.5. TCU Connection (Linux Based)
12.12.1.6. Others
12.12.2. ANZ Test Automation Systems for Powertrain Dynamometer Market Value (US$ Mn) Analysis & Forecast, by Vehicle Type, 2017‒2031
12.12.2.1. Passenger Vehicle
12.12.2.2. Light Commercial Vehicle
12.12.2.3. Heavy Duty Truck
12.12.2.4. Bus & Coach
12.12.2.5. Motorcycle
12.12.2.6. Power Generation Set
12.12.2.7. Motorsport
12.12.2.7.1. Autocross
12.12.2.7.2. Hill climb
12.12.2.7.3. Karting
12.12.2.7.4. Circuit Racing
12.12.2.7.5. Rally Cross
12.12.2.7.6. Others
12.12.2.8. Powersports
12.12.2.8.1. Snowmobile
12.12.2.8.2. Trikes
12.12.2.8.3. ATVs
12.12.2.8.4. UTVs
12.12.2.8.5. Jet Skis
12.12.2.8.6. Others
12.12.2.9. Agriculture Vehicle
12.12.2.9.1. Less than 30 HP
12.12.2.9.2. 30-100 HP
12.12.2.9.3. 101-200 HP
12.12.2.9.4. More Than 200 HP
12.12.3. ANZ Test Automation Systems for Powertrain Dynamometer Market Value (US$ Mn) Analysis & Forecast, by Propulsion, 2017‒2031
12.12.3.1. Internal Combustion Engine
12.12.3.2. Electric
12.12.3.2.1. Battery Electric
12.12.3.2.2. Hybrid Electric
12.12.3.2.3. Plug-in Hybrid Electric
12.12.4. ANZ Test Automation Systems for Powertrain Dynamometer Market Value (US$ Mn) Analysis & Forecast, by Testing Type, 2017‒2031
12.12.4.1. Durability Test
12.12.4.2. Performance Test
12.12.4.3. Vehicle Simulation
12.12.4.4. Others
12.13. Rest of Asia Pacific Test Automation Systems for Powertrain Dynamometer Market
12.13.1. Rest of Asia Pacific Test Automation Systems for Powertrain Dynamometer Market Value (US$ Mn) Analysis & Forecast, by Communication, 2017‒2031
12.13.1.1. Mobile
12.13.1.2. FlexRay
12.13.1.3. Web
12.13.1.4. Embedded Software
12.13.1.4.1. Modbus
12.13.1.4.2. Profibus
12.13.1.4.3. EtherCAT
12.13.1.4.4. Others
12.13.1.5. CAN Bus
12.13.1.5.1. Digital IO Module
12.13.1.5.2. Analog IO Module
12.13.1.5.3. Remote IO Module
12.13.1.5.4. ECU Connection (J1939)
12.13.1.5.5. TCU Connection (Linux Based)
12.13.1.6. Others
12.13.2. Rest of Asia Pacific Test Automation Systems for Powertrain Dynamometer Market Value (US$ Mn) Analysis & Forecast, by Vehicle Type, 2017‒2031
12.13.2.1. Passenger Vehicle
12.13.2.2. Light Commercial Vehicle
12.13.2.3. Heavy Duty Truck
12.13.2.4. Bus & Coach
12.13.2.5. Motorcycle
12.13.2.6. Power Generation Set
12.13.2.7. Motorsport
12.13.2.7.1. Autocross
12.13.2.7.2. Hill climb
12.13.2.7.3. Karting
12.13.2.7.4. Circuit Racing
12.13.2.7.5. Rally Cross
12.13.2.7.6. Others
12.13.2.8. Powersports
12.13.2.8.1. Snowmobile
12.13.2.8.2. Trikes
12.13.2.8.3. ATVs
12.13.2.8.4. UTVs
12.13.2.8.5. Jet Skis
12.13.2.8.6. Others
12.13.2.9. Agriculture Vehicle
12.13.2.9.1. Less than 30 HP
12.13.2.9.2. 30-100 HP
12.13.2.9.3. 101-200 HP
12.13.2.9.4. More Than 200 HP
12.13.3. Rest of Asia Pacific Test Automation Systems for Powertrain Dynamometer Market Value (US$ Mn) Analysis & Forecast, by Propulsion, 2017‒2031
12.13.3.1. Internal Combustion Engine
12.13.3.2. Electric
12.13.3.2.1. Battery Electric
12.13.3.2.2. Hybrid Electric
12.13.3.2.3. Plug-in Hybrid Electric
12.13.4. Rest of Asia Pacific Test Automation Systems for Powertrain Dynamometer Market Value (US$ Mn) Analysis & Forecast, by Testing Type, 2017‒2031
12.13.4.1. Durability Test
12.13.4.2. Performance Test
12.13.4.3. Vehicle Simulation
12.13.4.4. Others
13. Middle East & Africa Test Automation Systems for Powertrain Dynamometer Market
13.1. Market Snapshot
13.2. Middle East & Africa Test Automation Systems for Powertrain Dynamometer Market Value (US$ Mn) Analysis & Forecast, by Communication, 2017‒2031
13.2.1. Mobile
13.2.2. FlexRay
13.2.3. Web
13.2.4. Embedded Software
13.2.4.1. Modbus
13.2.4.2. Profibus
13.2.4.3. EtherCAT
13.2.4.4. Others
13.2.5. CAN Bus
13.2.5.1. Digital IO Module
13.2.5.2. Analog IO Module
13.2.5.3. Remote IO Module
13.2.5.4. ECU Connection (J1939)
13.2.5.5. TCU Connection (Linux Based)
13.2.6. Others
13.3. Middle East & Africa Test Automation Systems for Powertrain Dynamometer Market Value (US$ Mn) Analysis & Forecast, by Vehicle Type, 2017‒2031
13.3.1. Passenger Vehicle
13.3.2. Light Commercial Vehicle
13.3.3. Heavy Duty Truck
13.3.4. Bus & Coach
13.3.5. Motorcycle
13.3.6. Power Generation Set
13.3.7. Motorsport
13.3.7.1. Autocross
13.3.7.2. Hill climb
13.3.7.3. Karting
13.3.7.4. Circuit Racing
13.3.7.5. Rally Cross
13.3.7.6. Others
13.3.8. Powersports
13.3.8.1. Snowmobile
13.3.8.2. Trikes
13.3.8.3. ATVs
13.3.8.4. UTVs
13.3.8.5. Jet Skis
13.3.8.6. Others
13.3.9. Agriculture Vehicle
13.3.9.1. Less than 30 HP
13.3.9.2. 30-100 HP
13.3.9.3. 101-200 HP
13.3.9.4. More Than 200 HP
13.4. Middle East & Africa Test Automation Systems for Powertrain Dynamometer Market Value (US$ Mn) Analysis & Forecast, by Propulsion, 2017‒2031
13.4.1. Internal Combustion Engine
13.4.2. Electric
13.4.2.1. Battery Electric
13.4.2.2. Hybrid Electric
13.4.2.3. Plug-in Hybrid Electric
13.5. Middle East & Africa Test Automation Systems for Powertrain Dynamometer Market Value (US$ Mn) Analysis & Forecast, by Testing Type, 2017‒2031
13.5.1. Durability Test
13.5.2. Performance Test
13.5.3. Vehicle Simulation
13.5.4. Others
13.6. Middle East & Africa Test Automation Systems for Powertrain Dynamometer Market Value (US$ Mn) Analysis & Forecast, by Country & Sub-region, 2017‒2031
13.6.1. GCC
13.6.2. South Africa
13.6.3. Turkey
13.6.4. Rest of Middle East & Africa
13.7. GCC Test Automation Systems for Powertrain Dynamometer Market
13.7.1. GCC Test Automation Systems for Powertrain Dynamometer Market Value (US$ Mn) Analysis & Forecast, by Communication, 2017‒2031
13.7.1.1. Mobile
13.7.1.2. FlexRay
13.7.1.3. Web
13.7.1.4. Embedded Software
13.7.1.4.1. Modbus
13.7.1.4.2. Profibus
13.7.1.4.3. EtherCAT
13.7.1.4.4. Others
13.7.1.5. CAN Bus
13.7.1.5.1. Digital IO Module
13.7.1.5.2. Analog IO Module
13.7.1.5.3. Remote IO Module
13.7.1.5.4. ECU Connection (J1939)
13.7.1.5.5. TCU Connection (Linux Based)
13.7.1.6. Others
13.7.2. GCC Test Automation Systems for Powertrain Dynamometer Market Value (US$ Mn) Analysis & Forecast, by Vehicle Type, 2017‒2031
13.7.2.1. Passenger Vehicle
13.7.2.2. Light Commercial Vehicle
13.7.2.3. Heavy Duty Truck
13.7.2.4. Bus & Coach
13.7.2.5. Motorcycle
13.7.2.6. Power Generation Set
13.7.2.7. Motorsport
13.7.2.7.1. Autocross
13.7.2.7.2. Hill climb
13.7.2.7.3. Karting
13.7.2.7.4. Circuit Racing
13.7.2.7.5. Rally Cross
13.7.2.7.6. Others
13.7.2.8. Powersports
13.7.2.8.1. Snowmobile
13.7.2.8.2. Trikes
13.7.2.8.3. ATVs
13.7.2.8.4. UTVs
13.7.2.8.5. Jet Skis
13.7.2.8.6. Others
13.7.2.9. Agriculture Vehicle
13.7.2.9.1. Less than 30 HP
13.7.2.9.2. 30-100 HP
13.7.2.9.3. 101-200 HP
13.7.2.9.4. More Than 200 HP
13.7.3. GCC Test Automation Systems for Powertrain Dynamometer Market Value (US$ Mn) Analysis & Forecast, by Propulsion, 2017‒2031
13.7.3.1. Internal Combustion Engine
13.7.3.2. Electric
13.7.3.2.1. Battery Electric
13.7.3.2.2. Hybrid Electric
13.7.3.2.3. Plug-in Hybrid Electric
13.7.4. GCC Test Automation Systems for Powertrain Dynamometer Market Value (US$ Mn) Analysis & Forecast, by Testing Type, 2017‒2031
13.7.4.1. Durability Test
13.7.4.2. Performance Test
13.7.4.3. Vehicle Simulation
13.7.4.4. Others
13.8. South Africa Test Automation Systems for Powertrain Dynamometer Market
13.8.1. South Africa Test Automation Systems for Powertrain Dynamometer Market Value (US$ Mn) Analysis & Forecast, by Communication, 2017‒2031
13.8.1.1. Mobile
13.8.1.2. FlexRay
13.8.1.3. Web
13.8.1.4. Embedded Software
13.8.1.4.1. Modbus
13.8.1.4.2. Profibus
13.8.1.4.3. EtherCAT
13.8.1.4.4. Others
13.8.1.5. CAN Bus
13.8.1.5.1. Digital IO Module
13.8.1.5.2. Analog IO Module
13.8.1.5.3. Remote IO Module
13.8.1.5.4. ECU Connection (J1939)
13.8.1.5.5. TCU Connection (Linux Based)
13.8.1.6. Others
13.8.2. South Africa Test Automation Systems for Powertrain Dynamometer Market Value (US$ Mn) Analysis & Forecast, by Vehicle Type, 2017‒2031
13.8.2.1. Passenger Vehicle
13.8.2.2. Light Commercial Vehicle
13.8.2.3. Heavy Duty Truck
13.8.2.4. Bus & Coach
13.8.2.5. Motorcycle
13.8.2.6. Power Generation Set
13.8.2.7. Motorsport
13.8.2.7.1. Autocross
13.8.2.7.2. Hill climb
13.8.2.7.3. Karting
13.8.2.7.4. Circuit Racing
13.8.2.7.5. Rally Cross
13.8.2.7.6. Others
13.8.2.8. Powersports
13.8.2.8.1. Snowmobile
13.8.2.8.2. Trikes
13.8.2.8.3. ATVs
13.8.2.8.4. UTVs
13.8.2.8.5. Jet Skis
13.8.2.8.6. Others
13.8.2.9. Agriculture Vehicle
13.8.2.9.1. Less than 30 HP
13.8.2.9.2. 30-100 HP
13.8.2.9.3. 101-200 HP
13.8.2.9.4. More Than 200 HP
13.8.3. South Africa Test Automation Systems for Powertrain Dynamometer Market Value (US$ Mn) Analysis & Forecast, by Propulsion, 2017‒2031
13.8.3.1. Internal Combustion Engine
13.8.3.2. Electric
13.8.3.2.1. Battery Electric
13.8.3.2.2. Hybrid Electric
13.8.3.2.3. Plug-in Hybrid Electric
13.8.4. South Africa Test Automation Systems for Powertrain Dynamometer Market Value (US$ Mn) Analysis & Forecast, by Testing Type, 2017‒2031
13.8.4.1. Durability Test
13.8.4.2. Performance Test
13.8.4.3. Vehicle Simulation
13.8.4.4. Others
13.9. Turkey Test Automation Systems for Powertrain Dynamometer Market
13.9.1. Turkey Test Automation Systems for Powertrain Dynamometer Market Value (US$ Mn) Analysis & Forecast, by Communication, 2017‒2031
13.9.1.1. Mobile
13.9.1.2. FlexRay
13.9.1.3. Web
13.9.1.4. Embedded Software
13.9.1.4.1. Modbus
13.9.1.4.2. Profibus
13.9.1.4.3. EtherCAT
13.9.1.4.4. Others
13.9.1.5. CAN Bus
13.9.1.5.1. Digital IO Module
13.9.1.5.2. Analog IO Module
13.9.1.5.3. Remote IO Module
13.9.1.5.4. ECU Connection (J1939)
13.9.1.5.5. TCU Connection (Linux Based)
13.9.1.6. Others
13.9.2. Turkey Test Automation Systems for Powertrain Dynamometer Market Value (US$ Mn) Analysis & Forecast, by Vehicle Type, 2017‒2031
13.9.2.1. Passenger Vehicle
13.9.2.2. Light Commercial Vehicle
13.9.2.3. Heavy Duty Truck
13.9.2.4. Bus & Coach
13.9.2.5. Motorcycle
13.9.2.6. Power Generation Set
13.9.2.7. Motorsport
13.9.2.7.1. Autocross
13.9.2.7.2. Hill climb
13.9.2.7.3. Karting
13.9.2.7.4. Circuit Racing
13.9.2.7.5. Rally Cross
13.9.2.7.6. Others
13.9.2.8. Powersports
13.9.2.8.1. Snowmobile
13.9.2.8.2. Trikes
13.9.2.8.3. ATVs
13.9.2.8.4. UTVs
13.9.2.8.5. Jet Skis
13.9.2.8.6. Others
13.9.2.9. Agriculture Vehicle
13.9.2.9.1. Less than 30 HP
13.9.2.9.2. 30-100 HP
13.9.2.9.3. 101-200 HP
13.9.2.9.4. More Than 200 HP
13.9.3. Turkey Test Automation Systems for Powertrain Dynamometer Market Value (US$ Mn) Analysis & Forecast, by Propulsion, 2017‒2031
13.9.3.1. Internal Combustion Engine
13.9.3.2. Electric
13.9.3.2.1. Battery Electric
13.9.3.2.2. Hybrid Electric
13.9.3.2.3. Plug-in Hybrid Electric
13.9.4. Turkey Test Automation Systems for Powertrain Dynamometer Market Value (US$ Mn) Analysis & Forecast, by Testing Type, 2017‒2031
13.9.4.1. Durability Test
13.9.4.2. Performance Test
13.9.4.3. Vehicle Simulation
13.9.4.4. Others
13.10. Rest of Middle East & Africa Test Automation Systems for Powertrain Dynamometer Market
13.10.1. Rest of Middle East & Africa Test Automation Systems for Powertrain Dynamometer Market Value (US$ Mn) Analysis & Forecast, by Communication, 2017‒2031
13.10.1.1. Mobile
13.10.1.2. FlexRay
13.10.1.3. Web
13.10.1.4. Embedded Software
13.10.1.4.1. Modbus
13.10.1.4.2. Profibus
13.10.1.4.3. EtherCAT
13.10.1.4.4. Others
13.10.1.5. CAN Bus
13.10.1.5.1. Digital IO Module
13.10.1.5.2. Analog IO Module
13.10.1.5.3. Remote IO Module
13.10.1.5.4. ECU Connection (J1939)
13.10.1.5.5. TCU Connection (Linux Based)
13.10.1.6. Others
13.10.2. Rest of Middle East & Africa Test Automation Systems for Powertrain Dynamometer Market Value (US$ Mn) Analysis & Forecast, by Vehicle Type, 2017‒2031
13.10.2.1. Passenger Vehicle
13.10.2.2. Light Commercial Vehicle
13.10.2.3. Heavy Duty Truck
13.10.2.4. Bus & Coach
13.10.2.5. Motorcycle
13.10.2.6. Power Generation Set
13.10.2.7. Motorsport
13.10.2.7.1. Autocross
13.10.2.7.2. Hill climb
13.10.2.7.3. Karting
13.10.2.7.4. Circuit Racing
13.10.2.7.5. Rally Cross
13.10.2.7.6. Others
13.10.2.8. Powersports
13.10.2.8.1. Snowmobile
13.10.2.8.2. Trikes
13.10.2.8.3. ATVs
13.10.2.8.4. UTVs
13.10.2.8.5. Jet Skis
13.10.2.8.6. Others
13.10.2.9. Agriculture Vehicle
13.10.2.9.1. Less than 30 HP
13.10.2.9.2. 30-100 HP
13.10.2.9.3. 101-200 HP
13.10.2.9.4. More Than 200 HP
13.10.3. Rest of Middle East & Africa Test Automation Systems for Powertrain Dynamometer Market Value (US$ Mn) Analysis & Forecast, by Propulsion, 2017‒2031
13.10.3.1. Internal Combustion Engine
13.10.3.2. Electric
13.10.3.2.1. Battery Electric
13.10.3.2.2. Hybrid Electric
13.10.3.2.3. Plug-in Hybrid Electric
13.10.4. Rest of Middle East & Africa Test Automation Systems for Powertrain Dynamometer Market Value (US$ Mn) Analysis & Forecast, by Testing Type, 2017‒2031
13.10.4.1. Durability Test
13.10.4.2. Performance Test
13.10.4.3. Vehicle Simulation
13.10.4.4. Others
14. South America Test Automation Systems for Powertrain Dynamometer Market
14.1. Market Snapshot
14.2. South America Test Automation Systems for Powertrain Dynamometer Market Value (US$ Mn) Analysis & Forecast, by Communication, 2017‒2031
14.2.1. Mobile
14.2.2. FlexRay
14.2.3. Web
14.2.4. Embedded Software
14.2.4.1. Modbus
14.2.4.2. Profibus
14.2.4.3. EtherCAT
14.2.4.4. Others
14.2.5. CAN Bus
14.2.5.1. Digital IO Module
14.2.5.2. Analog IO Module
14.2.5.3. Remote IO Module
14.2.5.4. ECU Connection (J1939)
14.2.5.5. TCU Connection (Linux Based)
14.2.6. Others
14.3. South America Test Automation Systems for Powertrain Dynamometer Market Value (US$ Mn) Analysis & Forecast, by Vehicle Type, 2017‒2031
14.3.1. Passenger Vehicle
14.3.2. Light Commercial Vehicle
14.3.3. Heavy Duty Truck
14.3.4. Bus & Coach
14.3.5. Motorcycle
14.3.6. Power Generation Set
14.3.7. Motorsport
14.3.7.1. Autocross
14.3.7.2. Hill climb
14.3.7.3. Karting
14.3.7.4. Circuit Racing
14.3.7.5. Rally Cross
14.3.7.6. Others
14.3.8. Powersports
14.3.8.1. Snowmobile
14.3.8.2. Trikes
14.3.8.3. ATVs
14.3.8.4. UTVs
14.3.8.5. Jet Skis
14.3.8.6. Others
14.3.9. Agriculture Vehicle
14.3.9.1. Less than 30 HP
14.3.9.2. 30-100 HP
14.3.9.3. 101-200 HP
14.3.9.4. More Than 200 HP
14.4. South America Test Automation Systems for Powertrain Dynamometer Market Value (US$ Mn) Analysis & Forecast, by Propulsion, 2017‒2031
14.4.1. Internal Combustion Engine
14.4.2. Electric
14.4.2.1. Battery Electric
14.4.2.2. Hybrid Electric
14.4.2.3. Plug-in Hybrid Electric
14.5. South America Test Automation Systems for Powertrain Dynamometer Market Value (US$ Mn) Analysis & Forecast, by Testing Type, 2017‒2031
14.5.1. Durability Test
14.5.2. Performance Test
14.5.3. Vehicle Simulation
14.5.4. Others
14.6. South America Test Automation Systems for Powertrain Dynamometer Market Value (US$ Mn) Analysis & Forecast, by Country & Sub-region, 2017‒2031
14.6.1. Brazil
14.6.2. Argentina
14.6.3. Rest of South America
14.7. Brazil Test Automation Systems for Powertrain Dynamometer Market
14.7.1. Brazil Test Automation Systems for Powertrain Dynamometer Market Value (US$ Mn) Analysis & Forecast, by Communication, 2017‒2031
14.7.1.1. Mobile
14.7.1.2. FlexRay
14.7.1.3. Web
14.7.1.4. Embedded Software
14.7.1.4.1. Modbus
14.7.1.4.2. Profibus
14.7.1.4.3. EtherCAT
14.7.1.4.4. Others
14.7.1.5. CAN Bus
14.7.1.5.1. Digital IO Module
14.7.1.5.2. Analog IO Module
14.7.1.5.3. Remote IO Module
14.7.1.5.4. ECU Connection (J1939)
14.7.1.5.5. TCU Connection (Linux Based)
14.7.1.6. Others
14.7.2. Brazil Test Automation Systems for Powertrain Dynamometer Market Value (US$ Mn) Analysis & Forecast, by Vehicle Type, 2017‒2031
14.7.2.1. Passenger Vehicle
14.7.2.2. Light Commercial Vehicle
14.7.2.3. Heavy Duty Truck
14.7.2.4. Bus & Coach
14.7.2.5. Motorcycle
14.7.2.6. Power Generation Set
14.7.2.7. Motorsport
14.7.2.7.1. Autocross
14.7.2.7.2. Hill climb
14.7.2.7.3. Karting
14.7.2.7.4. Circuit Racing
14.7.2.7.5. Rally Cross
14.7.2.7.6. Others
14.7.2.8. Powersports
14.7.2.8.1. Snowmobile
14.7.2.8.2. Trikes
14.7.2.8.3. ATVs
14.7.2.8.4. UTVs
14.7.2.8.5. Jet Skis
14.7.2.8.6. Others
14.7.2.9. Agriculture Vehicle
14.7.2.9.1. Less than 30 HP
14.7.2.9.2. 30-100 HP
14.7.2.9.3. 101-200 HP
14.7.2.9.4. More Than 200 HP
14.7.3. Brazil Test Automation Systems for Powertrain Dynamometer Market Value (US$ Mn) Analysis & Forecast, by Propulsion, 2017‒2031
14.7.3.1. Internal Combustion Engine
14.7.3.2. Electric
14.7.3.2.1. Battery Electric
14.7.3.2.2. Hybrid Electric
14.7.3.2.3. Plug-in Hybrid Electric
14.7.4. Brazil Test Automation Systems for Powertrain Dynamometer Market Value (US$ Mn) Analysis & Forecast, by Testing Type, 2017‒2031
14.7.4.1. Durability Test
14.7.4.2. Performance Test
14.7.4.3. Vehicle Simulation
14.7.4.4. Others
14.8. Argentina Test Automation Systems for Powertrain Dynamometer Market
14.8.1. Argentina Test Automation Systems for Powertrain Dynamometer Market Value (US$ Mn) Analysis & Forecast, by Communication, 2017‒2031
14.8.1.1. Mobile
14.8.1.2. FlexRay
14.8.1.3. Web
14.8.1.4. Embedded Software
14.8.1.4.1. Modbus
14.8.1.4.2. Profibus
14.8.1.4.3. EtherCAT
14.8.1.4.4. Others
14.8.1.5. CAN Bus
14.8.1.5.1. Digital IO Module
14.8.1.5.2. Analog IO Module
14.8.1.5.3. Remote IO Module
14.8.1.5.4. ECU Connection (J1939)
14.8.1.5.5. TCU Connection (Linux Based)
14.8.1.6. Others
14.8.2. Argentina Test Automation Systems for Powertrain Dynamometer Market Value (US$ Mn) Analysis & Forecast, by Vehicle Type, 2017‒2031
14.8.2.1. Passenger Vehicle
14.8.2.2. Light Commercial Vehicle
14.8.2.3. Heavy Duty Truck
14.8.2.4. Bus & Coach
14.8.2.5. Motorcycle
14.8.2.6. Power Generation Set
14.8.2.7. Motorsport
14.8.2.7.1. Autocross
14.8.2.7.2. Hill climb
14.8.2.7.3. Karting
14.8.2.7.4. Circuit Racing
14.8.2.7.5. Rally Cross
14.8.2.7.6. Others
14.8.2.8. Powersports
14.8.2.8.1. Snowmobile
14.8.2.8.2. Trikes
14.8.2.8.3. ATVs
14.8.2.8.4. UTVs
14.8.2.8.5. Jet Skis
14.8.2.8.6. Others
14.8.2.9. Agriculture Vehicle
14.8.2.9.1. Less than 30 HP
14.8.2.9.2. 30-100 HP
14.8.2.9.3. 101-200 HP
14.8.2.9.4. More Than 200 HP
14.8.3. Argentina Test Automation Systems for Powertrain Dynamometer Market Value (US$ Mn) Analysis & Forecast, by Propulsion, 2017‒2031
14.8.3.1. Internal Combustion Engine
14.8.3.2. Electric
14.8.3.2.1. Battery Electric
14.8.3.2.2. Hybrid Electric
14.8.3.2.3. Plug-in Hybrid Electric
14.8.4. Argentina Test Automation Systems for Powertrain Dynamometer Market Value (US$ Mn) Analysis & Forecast, by Testing Type, 2017‒2031
14.8.4.1. Durability Test
14.8.4.2. Performance Test
14.8.4.3. Vehicle Simulation
14.8.4.4. Others
14.9. Rest of South America Test Automation Systems for Powertrain Dynamometer Market
14.9.1. Rest of South America Test Automation Systems for Powertrain Dynamometer Market Value (US$ Mn) Analysis & Forecast, by Communication, 2017‒2031
14.9.1.1. Mobile
14.9.1.2. FlexRay
14.9.1.3. Web
14.9.1.4. Embedded Software
14.9.1.4.1. Modbus
14.9.1.4.2. Profibus
14.9.1.4.3. EtherCAT
14.9.1.4.4. Others
14.9.1.5. CAN Bus
14.9.1.5.1. Digital IO Module
14.9.1.5.2. Analog IO Module
14.9.1.5.3. Remote IO Module
14.9.1.5.4. ECU Connection (J1939)
14.9.1.5.5. TCU Connection (Linux Based)
14.9.1.6. Others
14.9.2. Rest of South America Test Automation Systems for Powertrain Dynamometer Market Value (US$ Mn) Analysis & Forecast, by Vehicle Type, 2017‒2031
14.9.2.1. Passenger Vehicle
14.9.2.2. Light Commercial Vehicle
14.9.2.3. Heavy Duty Truck
14.9.2.4. Bus & Coach
14.9.2.5. Motorcycle
14.9.2.6. Power Generation Set
14.9.2.7. Motorsport
14.9.2.7.1. Autocross
14.9.2.7.2. Hill climb
14.9.2.7.3. Karting
14.9.2.7.4. Circuit Racing
14.9.2.7.5. Rally Cross
14.9.2.7.6. Others
14.9.2.8. Powersports
14.9.2.8.1. Snowmobile
14.9.2.8.2. Trikes
14.9.2.8.3. ATVs
14.9.2.8.4. UTVs
14.9.2.8.5. Jet Skis
14.9.2.8.6. Others
14.9.2.9. Agriculture Vehicle
14.9.2.9.1. Less than 30 HP
14.9.2.9.2. 30-100 HP
14.9.2.9.3. 101-200 HP
14.9.2.9.4. More Than 200 HP
14.9.3. Rest of South America Test Automation Systems for Powertrain Dynamometer Market Value (US$ Mn) Analysis & Forecast, by Propulsion, 2017‒2031
14.9.3.1. Internal Combustion Engine
14.9.3.2. Electric
14.9.3.2.1. Battery Electric
14.9.3.2.2. Hybrid Electric
14.9.3.2.3. Plug-in Hybrid Electric
14.9.4. Rest of South America Test Automation Systems for Powertrain Dynamometer Market Value (US$ Mn) Analysis & Forecast, by Testing Type, 2017‒2031
14.9.4.1. Durability Test
14.9.4.2. Performance Test
14.9.4.3. Vehicle Simulation
14.9.4.4. Others
15. Competitive Landscape
15.1. Company Share Analysis/ Brand Share Analysis, 2020
15.2. Key Strategy Analysis
15.2.1. Strategic Overview - Expansion, M&A, Partnership
15.2.2. Product & Marketing Strategy
15.3. Company Analysis for each player (Company Overview, Company Footprints, Production Locations, Product Portfolio, Competitors & Customers, Subsidiaries & Parent Organization, Recent Developments, Financial Analysis, Profitability, Revenue Share, Executive Bios)
16. Company Profile/ Key Players – Test Automation Systems for Powertrain Dynamometer Market
16.1. Horiba Automotive
16.1.1. Company Overview
16.1.2. Company Footprints
16.1.3. Production Locations
16.1.4. Product Portfolio
16.1.5. Competitors & Customers
16.1.6. Subsidiaries & Parent Organization
16.1.7. Recent Developments
16.1.8. Financial Analysis
16.1.9. Profitability
16.1.10. Revenue Share
16.1.11. Executive Bios
16.2. Power Test Inc.
16.2.1. Company Overview
16.2.2. Company Footprints
16.2.3. Production Locations
16.2.4. Product Portfolio
16.2.5. Competitors & Customers
16.2.6. Subsidiaries & Parent Organization
16.2.7. Recent Developments
16.2.8. Financial Analysis
16.2.9. Profitability
16.2.10. Revenue Share
16.2.11. Executive Bios
16.3. A&D Technology
16.3.1. Company Overview
16.3.2. Company Footprints
16.3.3. Production Locations
16.3.4. Product Portfolio
16.3.5. Competitors & Customers
16.3.6. Subsidiaries & Parent Organization
16.3.7. Recent Developments
16.3.8. Financial Analysis
16.3.9. Profitability
16.3.10. Revenue Share
16.3.11. Executive Bios
16.4. SAKOR Technologies Inc.
16.4.1. Company Overview
16.4.2. Company Footprints
16.4.3. Production Locations
16.4.4. Product Portfolio
16.4.5. Competitors & Customers
16.4.6. Subsidiaries & Parent Organization
16.4.7. Recent Developments
16.4.8. Financial Analysis
16.4.9. Profitability
16.4.10. Revenue Share
16.4.11. Executive Bios
16.5. FEV Europe GmbH
16.5.1. Company Overview
16.5.2. Company Footprints
16.5.3. Production Locations
16.5.4. Product Portfolio
16.5.5. Competitors & Customers
16.5.6. Subsidiaries & Parent Organization
16.5.7. Recent Developments
16.5.8. Financial Analysis
16.5.9. Profitability
16.5.10. Revenue Share
16.5.11. Executive Bios
16.6. Sierra Instruments
16.6.1. Company Overview
16.6.2. Company Footprints
16.6.3. Production Locations
16.6.4. Product Portfolio
16.6.5. Competitors & Customers
16.6.6. Subsidiaries & Parent Organization
16.6.7. Recent Developments
16.6.8. Financial Analysis
16.6.9. Profitability
16.6.10. Revenue Share
16.6.11. Executive Bios
16.7. Dyne Systems Inc.
16.7.1. Company Overview
16.7.2. Company Footprints
16.7.3. Production Locations
16.7.4. Product Portfolio
16.7.5. Competitors & Customers
16.7.6. Subsidiaries & Parent Organization
16.7.7. Recent Developments
16.7.8. Financial Analysis
16.7.9. Profitability
16.7.10. Revenue Share
16.7.11. Executive Bios
16.8. Integral Powertrain
16.8.1. Company Overview
16.8.2. Company Footprints
16.8.3. Production Locations
16.8.4. Product Portfolio
16.8.5. Competitors & Customers
16.8.6. Subsidiaries & Parent Organization
16.8.7. Recent Developments
16.8.8. Financial Analysis
16.8.9. Profitability
16.8.10. Revenue Share
16.8.11. Executive Bios
16.9. AIP GmbH & Co. KG
16.9.1. Company Overview
16.9.2. Company Footprints
16.9.3. Production Locations
16.9.4. Product Portfolio
16.9.5. Competitors & Customers
16.9.6. Subsidiaries & Parent Organization
16.9.7. Recent Developments
16.9.8. Financial Analysis
16.9.9. Profitability
16.9.10. Revenue Share
16.9.11. Executive Bios
16.10. AVL GmbH
16.10.1. Company Overview
16.10.2. Company Footprints
16.10.3. Production Locations
16.10.4. Product Portfolio
16.10.5. Competitors & Customers
16.10.6. Subsidiaries & Parent Organization
16.10.7. Recent Developments
16.10.8. Financial Analysis
16.10.9. Profitability
16.10.10. Revenue Share
16.10.11. Executive Bios
16.11. Unico LLC
16.11.1. Company Overview
16.11.2. Company Footprints
16.11.3. Production Locations
16.11.4. Product Portfolio
16.11.5. Competitors & Customers
16.11.6. Subsidiaries & Parent Organization
16.11.7. Recent Developments
16.11.8. Financial Analysis
16.11.9. Profitability
16.11.10. Revenue Share
16.11.11. Executive Bios
16.12. SAJ TEST PLANT PVT. LTD.
16.12.1. Company Overview
16.12.2. Company Footprints
16.12.3. Production Locations
16.12.4. Product Portfolio
16.12.5. Competitors & Customers
16.12.6. Subsidiaries & Parent Organization
16.12.7. Recent Developments
16.12.8. Financial Analysis
16.12.9. Profitability
16.12.10. Revenue Share
16.12.11. Executive Bios
16.13. MAHLE Powertrain
16.13.1. Company Overview
16.13.2. Company Footprints
16.13.3. Production Locations
16.13.4. Product Portfolio
16.13.5. Competitors & Customers
16.13.6. Subsidiaries & Parent Organization
16.13.7. Recent Developments
16.13.8. Financial Analysis
16.13.9. Profitability
16.13.10. Revenue Share
16.13.11. Executive Bios
16.14. Taylor Dynamometer
16.14.1. Company Overview
16.14.2. Company Footprints
16.14.3. Production Locations
16.14.4. Product Portfolio
16.14.5. Competitors & Customers
16.14.6. Subsidiaries & Parent Organization
16.14.7. Recent Developments
16.14.8. Financial Analysis
16.14.9. Profitability
16.14.10. Revenue Share
16.14.11. Executive Bios
16.15. Rototest
16.15.1. Company Overview
16.15.2. Company Footprints
16.15.3. Production Locations
16.15.4. Product Portfolio
16.15.5. Competitors & Customers
16.15.6. Subsidiaries & Parent Organization
16.15.7. Recent Developments
16.15.8. Financial Analysis
16.15.9. Profitability
16.15.10. Revenue Share
16.15.11. Executive Bios
16.16. KRATZER AUTOMATION AG
16.16.1. Company Overview
16.16.2. Company Footprints
16.16.3. Production Locations
16.16.4. Product Portfolio
16.16.5. Competitors & Customers
16.16.6. Subsidiaries & Parent Organization
16.16.7. Recent Developments
16.16.8. Financial Analysis
16.16.9. Profitability
16.16.10. Revenue Share
16.16.11. Executive Bios
16.17. Systems Technology Group, Inc.
16.17.1. Company Overview
16.17.2. Company Footprints
16.17.3. Production Locations
16.17.4. Product Portfolio
16.17.5. Competitors & Customers
16.17.6. Subsidiaries & Parent Organization
16.17.7. Recent Developments
16.17.8. Financial Analysis
16.17.9. Profitability
16.17.10. Revenue Share
16.17.11. Executive Bios
List of Tables
Table 1: Global Test Automation Systems for Powertrain Dynamometer Market Value (US$ Mn) Forecast, by Communication, 2017‒2031
Table 2: Global Test Automation Systems for Powertrain Dynamometer Market Value (US$ Mn) Forecast, by Vehicle Type, 2017‒2031
Table 3: Global Test Automation Systems for Powertrain Dynamometer Market Value (US$ Mn) Forecast, by Propulsion, 2017‒2031
Table 4: Global Test Automation Systems for Powertrain Dynamometer Market Value (US$ Mn) Forecast, by Testing Type, 2017‒2031
Table 5: Global Test Automation Systems for Powertrain Dynamometer Market Value (US$ Mn) Forecast, by Region, 2017‒2031
Table 6: North America Test Automation Systems for Powertrain Dynamometer Market Value (US$ Mn) Forecast, by Communication, 2017‒2031
Table 7: North America Test Automation Systems for Powertrain Dynamometer Market Value (US$ Mn) Forecast, by Vehicle Type, 2017‒2031
Table 8: North America Test Automation Systems for Powertrain Dynamometer Market Value (US$ Mn) Forecast, by Propulsion, 2017‒2031
Table 9: North America Test Automation Systems for Powertrain Dynamometer Market Value (US$ Mn) Forecast, by Testing Type, 2017‒2031
Table 10: North America Test Automation Systems for Powertrain Dynamometer Market Value (US$ Mn) Forecast, by Country, 2017‒2031
Table 11: U.S. Test Automation Systems for Powertrain Dynamometer Market Value (US$ Mn) Forecast, by Communication, 2017‒2031
Table 12: U.S. Test Automation Systems for Powertrain Dynamometer Market Value (US$ Mn) Forecast, by Vehicle Type, 2017‒2031
Table 13: U.S. Test Automation Systems for Powertrain Dynamometer Market Value (US$ Mn) Forecast, by Propulsion, 2017‒2031
Table 14: U.S. Test Automation Systems for Powertrain Dynamometer Market Value (US$ Mn) Forecast, by Testing Type, 2017‒2031
Table 15: Canada Test Automation Systems for Powertrain Dynamometer Market Value (US$ Mn) Forecast, by Communication, 2017‒2031
Table 16: Canada Test Automation Systems for Powertrain Dynamometer Market Value (US$ Mn) Forecast, by Vehicle Type, 2017‒2031
Table 17: Canada Test Automation Systems for Powertrain Dynamometer Market Value (US$ Mn) Forecast, by Propulsion, 2017‒2031
Table 18: Canada Test Automation Systems for Powertrain Dynamometer Market Value (US$ Mn) Forecast, by Testing Type, 2017‒2031
Table 19: Mexico Test Automation Systems for Powertrain Dynamometer Market Value (US$ Mn) Forecast, by Communication, 2017‒2031
Table 20: Mexico Test Automation Systems for Powertrain Dynamometer Market Value (US$ Mn) Forecast, by Vehicle Type, 2017‒2031
Table 21: Mexico Test Automation Systems for Powertrain Dynamometer Market Value (US$ Mn) Forecast, by Propulsion, 2017‒2031
Table 22: Mexico Test Automation Systems for Powertrain Dynamometer Market Value (US$ Mn) Forecast, by Testing Type, 2017‒2031
Table 23: Europe Test Automation Systems for Powertrain Dynamometer Market Value (US$ Mn) Forecast, by Communication, 2017‒2031
Table 24: Europe Test Automation Systems for Powertrain Dynamometer Market Value (US$ Mn) Forecast, by Vehicle Type, 2017‒2031
Table 25: Europe Test Automation Systems for Powertrain Dynamometer Market Value (US$ Mn) Forecast, by Propulsion, 2017‒2031
Table 26: Europe Test Automation Systems for Powertrain Dynamometer Market Value (US$ Mn) Forecast, by Testing Type, 2017‒2031
Table 27: Europe Test Automation Systems for Powertrain Dynamometer Market Value (US$ Mn) Forecast, by Country & Sub-region, 2017‒2031
Table 28: Germany Test Automation Systems for Powertrain Dynamometer Market Value (US$ Mn) Forecast, by Communication, 2017‒2031
Table 29: Germany Test Automation Systems for Powertrain Dynamometer Market Value (US$ Mn) Forecast, by Vehicle Type, 2017‒2031
Table 30: Germany Test Automation Systems for Powertrain Dynamometer Market Value (US$ Mn) Forecast, by Propulsion, 2017‒2031
Table 31: Germany Test Automation Systems for Powertrain Dynamometer Market Value (US$ Mn) Forecast, by Testing Type, 2017‒2031
Table 32: U.K. Test Automation Systems for Powertrain Dynamometer Market Value (US$ Mn) Forecast, by Communication, 2017‒2031
Table 33: U.K. Test Automation Systems for Powertrain Dynamometer Market Value (US$ Mn) Forecast, by Vehicle Type, 2017‒2031
Table 34: U.K. Test Automation Systems for Powertrain Dynamometer Market Value (US$ Mn) Forecast, by Propulsion, 2017‒2031
Table 35: U.K. Test Automation Systems for Powertrain Dynamometer Market Value (US$ Mn) Forecast, by Testing Type, 2017‒2031
Table 36: France Test Automation Systems for Powertrain Dynamometer Market Value (US$ Mn) Forecast, by Communication, 2017‒2031
Table 37: France Test Automation Systems for Powertrain Dynamometer Market Value (US$ Mn) Forecast, by Vehicle Type, 2017‒2031
Table 38: France Test Automation Systems for Powertrain Dynamometer Market Value (US$ Mn) Forecast, by Propulsion, 2017‒2031
Table 39: France Test Automation Systems for Powertrain Dynamometer Market Value (US$ Mn) Forecast, by Testing Type, 2017‒2031
Table 40: Italy Test Automation Systems for Powertrain Dynamometer Market Value (US$ Mn) Forecast, by Communication, 2017‒2031
Table 41: Italy Test Automation Systems for Powertrain Dynamometer Market Value (US$ Mn) Forecast, by Vehicle Type, 2017‒2031
Table 42: Italy Test Automation Systems for Powertrain Dynamometer Market Value (US$ Mn) Forecast, by Propulsion, 2017‒2031
Table 43: Italy Test Automation Systems for Powertrain Dynamometer Market Value (US$ Mn) Forecast, by Testing Type, 2017‒2031
Table 44: Spain Test Automation Systems for Powertrain Dynamometer Market Value (US$ Mn) Forecast, by Communication, 2017‒2031
Table 45: Spain Test Automation Systems for Powertrain Dynamometer Market Value (US$ Mn) Forecast, by Vehicle Type, 2017‒2031
Table 46: Spain Test Automation Systems for Powertrain Dynamometer Market Value (US$ Mn) Forecast, by Propulsion, 2017‒2031
Table 47: Spain Test Automation Systems for Powertrain Dynamometer Market Value (US$ Mn) Forecast, by Testing Type, 2017‒2031
Table 48: Nordic Countries Test Automation Systems for Powertrain Dynamometer Market Value (US$ Mn) Forecast, by Communication, 2017‒2031
Table 49: Nordic Countries Test Automation Systems for Powertrain Dynamometer Market Value (US$ Mn) Forecast, by Vehicle Type, 2017‒2031
Table 50: Nordic Countries Test Automation Systems for Powertrain Dynamometer Market Value (US$ Mn) Forecast, by Propulsion, 2017‒2031
Table 51: Nordic Countries Test Automation Systems for Powertrain Dynamometer Market Value (US$ Mn) Forecast, by Testing Type, 2017‒2031
Table 52: Russia & CIS Test Automation Systems for Powertrain Dynamometer Market Value (US$ Mn) Forecast, by Communication, 2017‒2031
Table 53: Russia & CIS Test Automation Systems for Powertrain Dynamometer Market Value (US$ Mn) Forecast, by Vehicle Type, 2017‒2031
Table 54: Russia & CIS Test Automation Systems for Powertrain Dynamometer Market Value (US$ Mn) Forecast, by Propulsion, 2017‒2031
Table 55: Russia & CIS Test Automation Systems for Powertrain Dynamometer Market Value (US$ Mn) Forecast, by Testing Type, 2017‒2031
Table 56: Rest of Europe Test Automation Systems for Powertrain Dynamometer Market Value (US$ Mn) Forecast, by Communication, 2017‒2031
Table 57: Rest of Europe Test Automation Systems for Powertrain Dynamometer Market Value (US$ Mn) Forecast, by Vehicle Type, 2017‒2031
Table 58: Rest of Europe Test Automation Systems for Powertrain Dynamometer Market Value (US$ Mn) Forecast, by Propulsion, 2017‒2031
Table 59: Rest of Europe Test Automation Systems for Powertrain Dynamometer Market Value (US$ Mn) Forecast, by Testing Type, 2017‒2031
Table 60: Asia Pacific Test Automation Systems for Powertrain Dynamometer Market Value (US$ Mn) Forecast, by Communication, 2017‒2031
Table 61: Asia Pacific Test Automation Systems for Powertrain Dynamometer Market Value (US$ Mn) Forecast, by Vehicle Type, 2017‒2031
Table 62: Asia Pacific Test Automation Systems for Powertrain Dynamometer Market Value (US$ Mn) Forecast, by Propulsion, 2017‒2031
Table 63: Asia Pacific Test Automation Systems for Powertrain Dynamometer Market Value (US$ Mn) Forecast, by Testing Type, 2017‒2031
Table 64: Asia Pacific Test Automation Systems for Powertrain Dynamometer Market Value (US$ Mn) Forecast, by Country & Sub-region, 2017‒2031
Table 65: China Test Automation Systems for Powertrain Dynamometer Market Value (US$ Mn) Forecast, by Communication, 2017‒2031
Table 66: China Test Automation Systems for Powertrain Dynamometer Market Value (US$ Mn) Forecast, by Vehicle Type, 2017‒2031
Table 67: China Test Automation Systems for Powertrain Dynamometer Market Value (US$ Mn) Forecast, by Propulsion, 2017‒2031
Table 68: China Test Automation Systems for Powertrain Dynamometer Market Value (US$ Mn) Forecast, by Testing Type, 2017‒2031
Table 69: India Test Automation Systems for Powertrain Dynamometer Market Value (US$ Mn) Forecast, by Communication, 2017‒2031
Table 70: India Test Automation Systems for Powertrain Dynamometer Market Value (US$ Mn) Forecast, by Vehicle Type, 2017‒2031
Table 71: India Test Automation Systems for Powertrain Dynamometer Market Value (US$ Mn) Forecast, by Propulsion, 2017‒2031
Table 72: India Test Automation Systems for Powertrain Dynamometer Market Value (US$ Mn) Forecast, by Testing Type, 2017‒2031
Table 73: Japan Test Automation Systems for Powertrain Dynamometer Market Value (US$ Mn) Forecast, by Communication, 2017‒2031
Table 74: Japan Test Automation Systems for Powertrain Dynamometer Market Value (US$ Mn) Forecast, by Vehicle Type, 2017‒2031
Table 75: Japan Test Automation Systems for Powertrain Dynamometer Market Value (US$ Mn) Forecast, by Propulsion, 2017‒2031
Table 76: Japan Test Automation Systems for Powertrain Dynamometer Market Value (US$ Mn) Forecast, by Testing Type, 2017‒2031
Table 77: ASEAN Test Automation Systems for Powertrain Dynamometer Market Value (US$ Mn) Forecast, by Communication, 2017‒2031
Table 78: ASEAN Test Automation Systems for Powertrain Dynamometer Market Value (US$ Mn) Forecast, by Vehicle Type, 2017‒2031
Table 79: ASEAN Test Automation Systems for Powertrain Dynamometer Market Value (US$ Mn) Forecast, by Propulsion, 2017‒2031
Table 80: ASEAN Test Automation Systems for Powertrain Dynamometer Market Value (US$ Mn) Forecast, by Testing Type, 2017‒2031
Table 81: South Korea Test Automation Systems for Powertrain Dynamometer Market Value (US$ Mn) Forecast, by Communication, 2017‒2031
Table 82: South Korea Test Automation Systems for Powertrain Dynamometer Market Value (US$ Mn) Forecast, by Vehicle Type, 2017‒2031
Table 83: South Korea Test Automation Systems for Powertrain Dynamometer Market Value (US$ Mn) Forecast, by Propulsion, 2017‒2031
Table 84: South Korea Test Automation Systems for Powertrain Dynamometer Market Value (US$ Mn) Forecast, by Testing Type, 2017‒2031
Table 85: ANZ Test Automation Systems for Powertrain Dynamometer Market Value (US$ Mn) Forecast, by Communication, 2017‒2031
Table 86: ANZ Test Automation Systems for Powertrain Dynamometer Market Value (US$ Mn) Forecast, by Vehicle Type, 2017‒2031
Table 87: ANZ Test Automation Systems for Powertrain Dynamometer Market Value (US$ Mn) Forecast, by Propulsion, 2017‒2031
Table 88: ANZ Test Automation Systems for Powertrain Dynamometer Market Value (US$ Mn) Forecast, by Testing Type, 2017‒2031
Table 89: Rest of Asia Pacific Test Automation Systems for Powertrain Dynamometer Market Value (US$ Mn) Forecast, by Communication, 2017‒2031
Table 90: Rest of Asia Pacific Test Automation Systems for Powertrain Dynamometer Market Value (US$ Mn) Forecast, by Vehicle Type, 2017‒2031
Table 91: Rest of Asia Pacific Test Automation Systems for Powertrain Dynamometer Market Value (US$ Mn) Forecast, by Propulsion, 2017‒2031
Table 92: Rest of Asia Pacific Test Automation Systems for Powertrain Dynamometer Market Value (US$ Mn) Forecast, by Testing Type, 2017‒2031
Table 93: Middle East & Africa Test Automation Systems for Powertrain Dynamometer Market Value (US$ Mn) Forecast, by Communication, 2017‒2031
Table 94: Middle East & Africa Test Automation Systems for Powertrain Dynamometer Market Value (US$ Mn) Forecast, by Vehicle Type, 2017‒2031
Table 95: Middle East & Africa Test Automation Systems for Powertrain Dynamometer Market Value (US$ Mn) Forecast, by Propulsion, 2017‒2031
Table 96: Middle East & Africa Test Automation Systems for Powertrain Dynamometer Market Value (US$ Mn) Forecast, by Testing Type, 2017‒2031
Table 97: Middle East & Africa Test Automation Systems for Powertrain Dynamometer Market Value (US$ Mn) Forecast, by Country & Sub-region, 2017‒2031
Table 98: GCC Test Automation Systems for Powertrain Dynamometer Market Value (US$ Mn) Forecast, by Communication, 2017‒2031
Table 99: GCC Test Automation Systems for Powertrain Dynamometer Market Value (US$ Mn) Forecast, by Vehicle Type, 2017‒2031
Table 100: GCC Test Automation Systems for Powertrain Dynamometer Market Value (US$ Mn) Forecast, by Propulsion, 2017‒2031
Table 101: GCC Test Automation Systems for Powertrain Dynamometer Market Value (US$ Mn) Forecast, by Testing Type, 2017‒2031
Table 102: South Africa Test Automation Systems for Powertrain Dynamometer Market Value (US$ Mn) Forecast, by Communication, 2017‒2031
Table 103: South Africa Test Automation Systems for Powertrain Dynamometer Market Value (US$ Mn) Forecast, by Vehicle Type, 2017‒2031
Table 104: South Africa Test Automation Systems for Powertrain Dynamometer Market Value (US$ Mn) Forecast, by Propulsion, 2017‒2031
Table 105: South Africa Test Automation Systems for Powertrain Dynamometer Market Value (US$ Mn) Forecast, by Testing Type, 2017‒2031
Table 106: Turkey Test Automation Systems for Powertrain Dynamometer Market Value (US$ Mn) Forecast, by Communication, 2017‒2031
Table 107: Turkey Test Automation Systems for Powertrain Dynamometer Market Value (US$ Mn) Forecast, by Vehicle Type, 2017‒2031
Table 108: Turkey Test Automation Systems for Powertrain Dynamometer Market Value (US$ Mn) Forecast, by Propulsion, 2017‒2031
Table 109: Turkey Test Automation Systems for Powertrain Dynamometer Market Value (US$ Mn) Forecast, by Testing Type, 2017‒2031
Table 110: Rest of Middle East & Africa Test Automation Systems for Powertrain Dynamometer Market Value (US$ Mn) Forecast, by Communication, 2017‒2031
Table 111: Rest of Middle East & Africa Test Automation Systems for Powertrain Dynamometer Market Value (US$ Mn) Forecast, by Vehicle Type, 2017‒2031
Table 112: Rest of Middle East & Africa Test Automation Systems for Powertrain Dynamometer Market Value (US$ Mn) Forecast, by Propulsion, 2017‒2031
Table 113: Rest of Middle East & Africa Test Automation Systems for Powertrain Dynamometer Market Value (US$ Mn) Forecast, by Testing Type, 2017‒2031
Table 114: South America Test Automation Systems for Powertrain Dynamometer Market Value (US$ Mn) Forecast, by Communication, 2017‒2031
Table 115: South America Test Automation Systems for Powertrain Dynamometer Market Value (US$ Mn) Forecast, by Vehicle Type, 2017‒2031
Table 116: South America Test Automation Systems for Powertrain Dynamometer Market Value (US$ Mn) Forecast, by Propulsion, 2017‒2031
Table 117: South America Test Automation Systems for Powertrain Dynamometer Market Value (US$ Mn) Forecast, by Testing Type, 2017‒2031
Table 118: South America Test Automation Systems for Powertrain Dynamometer Market Value (US$ Mn) Forecast, by Country & Sub-region, 2017‒2031
Table 119: Brazil Test Automation Systems for Powertrain Dynamometer Market Value (US$ Mn) Forecast, by Communication, 2017‒2031
Table 120: Brazil Test Automation Systems for Powertrain Dynamometer Market Value (US$ Mn) Forecast, by Vehicle Type, 2017‒2031
Table 121: Brazil Test Automation Systems for Powertrain Dynamometer Market Value (US$ Mn) Forecast, by Propulsion, 2017‒2031
Table 122: Brazil Test Automation Systems for Powertrain Dynamometer Market Value (US$ Mn) Forecast, by Testing Type, 2017‒2031
Table 123: Argentina Test Automation Systems for Powertrain Dynamometer Market Value (US$ Mn) Forecast, by Communication, 2017‒2031
Table 124: Argentina Test Automation Systems for Powertrain Dynamometer Market Value (US$ Mn) Forecast, by Vehicle Type, 2017‒2031
Table 125: Argentina Test Automation Systems for Powertrain Dynamometer Market Value (US$ Mn) Forecast, by Propulsion, 2017‒2031
Table 126: Argentina Test Automation Systems for Powertrain Dynamometer Market Value (US$ Mn) Forecast, by Testing Type, 2017‒2031
Table 127: Rest of South America Test Automation Systems for Powertrain Dynamometer Market Value (US$ Mn) Forecast, by Communication, 2017‒2031
Table 128: Rest of South America Test Automation Systems for Powertrain Dynamometer Market Value (US$ Mn) Forecast, by Vehicle Type, 2017‒2031
Table 129: Rest of South America Test Automation Systems for Powertrain Dynamometer Market Value (US$ Mn) Forecast, by Propulsion, 2017‒2031
Table 130: Rest of South America Test Automation Systems for Powertrain Dynamometer Market Value (US$ Mn) Forecast, by Testing Type, 2017‒2031
List of Figures
Figure 1: Global Test Automation Systems for Powertrain Dynamometer Market Value (U$ Mn) Forecast, by Communication, 2017-2031
Figure 2: Global Test Automation Systems for Powertrain Dynamometer Market, Incremental Opportunity, by Communication, Value (US$ Mn), 2021-2031
Figure 3: Global Test Automation Systems for Powertrain Dynamometer Market Value (U$ Mn) Forecast, by Vehicle Type, 2017-2031
Figure 4: Global Test Automation Systems for Powertrain Dynamometer Market, Incremental Opportunity, by Vehicle Type, Value (US$ Mn), 2021-2031
Figure 5: Global Test Automation Systems for Powertrain Dynamometer Market Value (U$ Mn) Forecast, by Propulsion, 2017-2031
Figure 6: Global Test Automation Systems for Powertrain Dynamometer Market, Incremental Opportunity, by Propulsion, Value (US$ Mn), 2021-2031
Figure 7: Global Test Automation Systems for Powertrain Dynamometer Market Value (U$ Mn) Forecast, by Testing Type, 2017-2031
Figure 8: Global Test Automation Systems for Powertrain Dynamometer Market, Incremental Opportunity, by Testing Type, Value (US$ Mn), 2021-2031
Figure 9: Global Test Automation Systems for Powertrain Dynamometer Market Value (U$ Mn) Forecast, by Region, 2017-2031
Figure 10: Global Test Automation Systems for Powertrain Dynamometer Market, Incremental Opportunity, by Region, Value (US$ Mn), 2021-2031
Figure 11: North America Test Automation Systems for Powertrain Dynamometer Market Value (U$ Mn) Forecast, by Communication, 2017-2031
Figure 12: North America Test Automation Systems for Powertrain Dynamometer Market, Incremental Opportunity, by Communication, Value (US$ Mn), 2021-2031
Figure 13: North America Test Automation Systems for Powertrain Dynamometer Market Value (U$ Mn) Forecast, by Vehicle Type, 2017-2031
Figure 14: North America Test Automation Systems for Powertrain Dynamometer Market, Incremental Opportunity, by Vehicle Type, Value (US$ Mn), 2021-2031
Figure 15: North America Test Automation Systems for Powertrain Dynamometer Market Value (U$ Mn) Forecast, by Propulsion, 2017-2031
Figure 16: North America Test Automation Systems for Powertrain Dynamometer Market, Incremental Opportunity, by Propulsion, Value (US$ Mn), 2021-2031
Figure 17: North America Test Automation Systems for Powertrain Dynamometer Market Value (U$ Mn) Forecast, by Testing Type, 2017-2031
Figure 18: North America Test Automation Systems for Powertrain Dynamometer Market, Incremental Opportunity, by Testing Type, Value (US$ Mn), 2021-2031
Figure 19: North America Test Automation Systems for Powertrain Dynamometer Market Value (U$ Mn) Forecast, by Country, 2017-2031
Figure 20: North America Test Automation Systems for Powertrain Dynamometer Market, Incremental Opportunity, by Country, Value (US$ Mn), 2021-2031
Figure 21: U.S. Test Automation Systems for Powertrain Dynamometer Market Value (U$ Mn) Forecast, by Communication, 2017-2031
Figure 22: U.S. Test Automation Systems for Powertrain Dynamometer Market, Incremental Opportunity, by Communication, Value (US$ Mn), 2021-2031
Figure 23: U.S. Test Automation Systems for Powertrain Dynamometer Market Value (U$ Mn) Forecast, by Vehicle Type, 2017-2031
Figure 24: U.S. Test Automation Systems for Powertrain Dynamometer Market, Incremental Opportunity, by Vehicle Type, Value (US$ Mn), 2021-2031
Figure 25: U.S. Test Automation Systems for Powertrain Dynamometer Market Value (U$ Mn) Forecast, by Propulsion, 2017-2031
Figure 26: U.S. Test Automation Systems for Powertrain Dynamometer Market, Incremental Opportunity, by Propulsion, Value (US$ Mn), 2021-2031
Figure 27: U.S. Test Automation Systems for Powertrain Dynamometer Market Value (U$ Mn) Forecast, by Testing Type, 2017-2031
Figure 28: U.S. Test Automation Systems for Powertrain Dynamometer Market, Incremental Opportunity, by Testing Type, Value (US$ Mn), 2021-2031
Figure 29: Canada Test Automation Systems for Powertrain Dynamometer Market Value (U$ Mn) Forecast, by Communication, 2017-2031
Figure 30: Canada Test Automation Systems for Powertrain Dynamometer Market, Incremental Opportunity, by Communication, Value (US$ Mn), 2021-2031
Figure 31: Canada Test Automation Systems for Powertrain Dynamometer Market Value (U$ Mn) Forecast, by Vehicle Type, 2017-2031
Figure 32: Canada Test Automation Systems for Powertrain Dynamometer Market, Incremental Opportunity, by Vehicle Type, Value (US$ Mn), 2021-2031
Figure 33: Canada Test Automation Systems for Powertrain Dynamometer Market Value (U$ Mn) Forecast, by Propulsion, 2017-2031
Figure 34: Canada Test Automation Systems for Powertrain Dynamometer Market, Incremental Opportunity, by Propulsion, Value (US$ Mn), 2021-2031
Figure 35: Canada Test Automation Systems for Powertrain Dynamometer Market Value (U$ Mn) Forecast, by Testing Type, 2017-2031
Figure 36: Canada Test Automation Systems for Powertrain Dynamometer Market, Incremental Opportunity, by Testing Type, Value (US$ Mn), 2021-2031
Figure 37: Mexico Test Automation Systems for Powertrain Dynamometer Market Value (U$ Mn) Forecast, by Communication, 2017-2031
Figure 38: Mexico Test Automation Systems for Powertrain Dynamometer Market, Incremental Opportunity, by Communication, Value (US$ Mn), 2021-2031
Figure 39: Mexico Test Automation Systems for Powertrain Dynamometer Market Value (U$ Mn) Forecast, by Vehicle Type, 2017-2031
Figure 40: Mexico Test Automation Systems for Powertrain Dynamometer Market, Incremental Opportunity, by Vehicle Type, Value (US$ Mn), 2021-2031
Figure 41: Mexico Test Automation Systems for Powertrain Dynamometer Market Value (U$ Mn) Forecast, by Propulsion, 2017-2031
Figure 42: Mexico Test Automation Systems for Powertrain Dynamometer Market, Incremental Opportunity, by Propulsion, Value (US$ Mn), 2021-2031
Figure 43: Mexico Test Automation Systems for Powertrain Dynamometer Market Value (U$ Mn) Forecast, by Testing Type, 2017-2031
Figure 44: Mexico Test Automation Systems for Powertrain Dynamometer Market, Incremental Opportunity, by Testing Type, Value (US$ Mn), 2021-2031
Figure 45: Europe Test Automation Systems for Powertrain Dynamometer Market Value (U$ Mn) Forecast, by Communication, 2017-2031
Figure 46: Europe Test Automation Systems for Powertrain Dynamometer Market, Incremental Opportunity, by Communication, Value (US$ Mn), 2021-2031
Figure 47: Europe Test Automation Systems for Powertrain Dynamometer Market Value (U$ Mn) Forecast, by Vehicle Type, 2017-2031
Figure 48: Europe Test Automation Systems for Powertrain Dynamometer Market, Incremental Opportunity, by Vehicle Type, Value (US$ Mn), 2021-2031
Figure 49: Europe Test Automation Systems for Powertrain Dynamometer Market Value (U$ Mn) Forecast, by Propulsion, 2017-2031
Figure 50: Europe Test Automation Systems for Powertrain Dynamometer Market, Incremental Opportunity, by Propulsion, Value (US$ Mn), 2021-2031
Figure 51: Europe Test Automation Systems for Powertrain Dynamometer Market Value (U$ Mn) Forecast, by Testing Type, 2017-2031
Figure 52: Europe Test Automation Systems for Powertrain Dynamometer Market, Incremental Opportunity, by Testing Type, Value (US$ Mn), 2021-2031
Figure 53: Europe Test Automation Systems for Powertrain Dynamometer Market Value (U$ Mn) Forecast, by Country & Sub-region, 2017-2031
Figure 54: Europe Test Automation Systems for Powertrain Dynamometer Market, Incremental Opportunity, by Country & Sub-region, Value (US$ Mn), 2021-2031
Figure 55: Germany Test Automation Systems for Powertrain Dynamometer Market Value (U$ Mn) Forecast, by Communication, 2017-2031
Figure 56: Germany Test Automation Systems for Powertrain Dynamometer Market, Incremental Opportunity, by Communication, Value (US$ Mn), 2021-2031
Figure 57: Germany Test Automation Systems for Powertrain Dynamometer Market Value (U$ Mn) Forecast, by Vehicle Type, 2017-2031
Figure 58: Germany Test Automation Systems for Powertrain Dynamometer Market, Incremental Opportunity, by Vehicle Type, Value (US$ Mn), 2021-2031
Figure 59: Germany Test Automation Systems for Powertrain Dynamometer Market Value (U$ Mn) Forecast, by Propulsion, 2017-2031
Figure 60: Germany Test Automation Systems for Powertrain Dynamometer Market, Incremental Opportunity, by Propulsion, Value (US$ Mn), 2021-2031
Figure 61: Germany Test Automation Systems for Powertrain Dynamometer Market Value (U$ Mn) Forecast, by Testing Type, 2017-2031
Figure 62: Germany Test Automation Systems for Powertrain Dynamometer Market, Incremental Opportunity, by Testing Type, Value (US$ Mn), 2021-2031
Figure 63: U.K. Test Automation Systems for Powertrain Dynamometer Market Value (U$ Mn) Forecast, by Communication, 2017-2031
Figure 64: U.K. Test Automation Systems for Powertrain Dynamometer Market, Incremental Opportunity, by Communication, Value (US$ Mn), 2021-2031
Figure 65: U.K. Test Automation Systems for Powertrain Dynamometer Market Value (U$ Mn) Forecast, by Vehicle Type, 2017-2031
Figure 66: U.K. Test Automation Systems for Powertrain Dynamometer Market, Incremental Opportunity, by Vehicle Type, Value (US$ Mn), 2021-2031
Figure 67: U.K. Test Automation Systems for Powertrain Dynamometer Market Value (U$ Mn) Forecast, by Propulsion, 2017-2031
Figure 68: U.K. Test Automation Systems for Powertrain Dynamometer Market, Incremental Opportunity, by Propulsion, Value (US$ Mn), 2021-2031
Figure 69: U.K. Test Automation Systems for Powertrain Dynamometer Market Value (U$ Mn) Forecast, by Testing Type, 2017-2031
Figure 70: U.K. Test Automation Systems for Powertrain Dynamometer Market, Incremental Opportunity, by Testing Type, Value (US$ Mn), 2021-2031
Figure 71: France Test Automation Systems for Powertrain Dynamometer Market Value (U$ Mn) Forecast, by Communication, 2017-2031
Figure 72: France Test Automation Systems for Powertrain Dynamometer Market, Incremental Opportunity, by Communication, Value (US$ Mn), 2021-2031
Figure 73: France Test Automation Systems for Powertrain Dynamometer Market Value (U$ Mn) Forecast, by Vehicle Type, 2017-2031
Figure 74: France Test Automation Systems for Powertrain Dynamometer Market, Incremental Opportunity, by Vehicle Type, Value (US$ Mn), 2021-2031
Figure 75: France Test Automation Systems for Powertrain Dynamometer Market Value (U$ Mn) Forecast, by Propulsion, 2017-2031
Figure 76: France Test Automation Systems for Powertrain Dynamometer Market, Incremental Opportunity, by Propulsion, Value (US$ Mn), 2021-2031
Figure 77: France Test Automation Systems for Powertrain Dynamometer Market Value (U$ Mn) Forecast, by Testing Type, 2017-2031
Figure 78: France Test Automation Systems for Powertrain Dynamometer Market, Incremental Opportunity, by Testing Type, Value (US$ Mn), 2021-2031
Figure 79: Italy Test Automation Systems for Powertrain Dynamometer Market Value (U$ Mn) Forecast, by Communication, 2017-2031
Figure 80: Italy Test Automation Systems for Powertrain Dynamometer Market, Incremental Opportunity, by Communication, Value (US$ Mn), 2021-2031
Figure 81: Italy Test Automation Systems for Powertrain Dynamometer Market Value (U$ Mn) Forecast, by Vehicle Type, 2017-2031
Figure 82: Italy Test Automation Systems for Powertrain Dynamometer Market, Incremental Opportunity, by Vehicle Type, Value (US$ Mn), 2021-2031
Figure 83: Italy Test Automation Systems for Powertrain Dynamometer Market Value (U$ Mn) Forecast, by Propulsion, 2017-2031
Figure 84: Italy Test Automation Systems for Powertrain Dynamometer Market, Incremental Opportunity, by Propulsion, Value (US$ Mn), 2021-2031
Figure 85: Italy Test Automation Systems for Powertrain Dynamometer Market Value (U$ Mn) Forecast, by Testing Type, 2017-2031
Figure 86: Italy Test Automation Systems for Powertrain Dynamometer Market, Incremental Opportunity, by Testing Type, Value (US$ Mn), 2021-2031
Figure 87: Spain Test Automation Systems for Powertrain Dynamometer Market Value (U$ Mn) Forecast, by Communication, 2017-2031
Figure 88: Spain Test Automation Systems for Powertrain Dynamometer Market, Incremental Opportunity, by Communication, Value (US$ Mn), 2021-2031
Figure 89: Spain Test Automation Systems for Powertrain Dynamometer Market Value (U$ Mn) Forecast, by Vehicle Type, 2017-2031
Figure 90: Spain Test Automation Systems for Powertrain Dynamometer Market, Incremental Opportunity, by Vehicle Type, Value (US$ Mn), 2021-2031
Figure 91: Spain Test Automation Systems for Powertrain Dynamometer Market Value (U$ Mn) Forecast, by Propulsion, 2017-2031
Figure 92: Spain Test Automation Systems for Powertrain Dynamometer Market, Incremental Opportunity, by Propulsion, Value (US$ Mn), 2021-2031
Figure 93: Spain Test Automation Systems for Powertrain Dynamometer Market Value (U$ Mn) Forecast, by Testing Type, 2017-2031
Figure 94: Spain Test Automation Systems for Powertrain Dynamometer Market, Incremental Opportunity, by Testing Type, Value (US$ Mn), 2021-2031
Figure 95: Nordic Countries Test Automation Systems for Powertrain Dynamometer Market Value (U$ Mn) Forecast, by Communication, 2017-2031
Figure 96: Nordic Countries Test Automation Systems for Powertrain Dynamometer Market, Incremental Opportunity, by Communication, Value (US$ Mn), 2021-2031
Figure 97: Nordic Countries Test Automation Systems for Powertrain Dynamometer Market Value (U$ Mn) Forecast, by Vehicle Type, 2017-2031
Figure 98: Nordic Countries Test Automation Systems for Powertrain Dynamometer Market, Incremental Opportunity, by Vehicle Type, Value (US$ Mn), 2021-2031
Figure 99: Nordic Countries Test Automation Systems for Powertrain Dynamometer Market Value (U$ Mn) Forecast, by Propulsion, 2017-2031
Figure 100: Nordic Countries Test Automation Systems for Powertrain Dynamometer Market, Incremental Opportunity, by Propulsion, Value (US$ Mn), 2021-2031
Figure 101: Nordic Countries Test Automation Systems for Powertrain Dynamometer Market Value (U$ Mn) Forecast, by Testing Type, 2017-2031
Figure 102: Nordic Countries Test Automation Systems for Powertrain Dynamometer Market, Incremental Opportunity, by Testing Type, Value (US$ Mn), 2021-2031
Figure 103: Russia & CIS Test Automation Systems for Powertrain Dynamometer Market Value (U$ Mn) Forecast, by Communication, 2017-2031
Figure 104: Russia & CIS Test Automation Systems for Powertrain Dynamometer Market, Incremental Opportunity, by Communication, Value (US$ Mn), 2021-2031
Figure 105: Russia & CIS Test Automation Systems for Powertrain Dynamometer Market Value (U$ Mn) Forecast, by Vehicle Type, 2017-2031
Figure 106: Russia & CIS Test Automation Systems for Powertrain Dynamometer Market, Incremental Opportunity, by Vehicle Type, Value (US$ Mn), 2021-2031
Figure 107: Russia & CIS Test Automation Systems for Powertrain Dynamometer Market Value (U$ Mn) Forecast, by Propulsion, 2017-2031
Figure 108: Russia & CIS Test Automation Systems for Powertrain Dynamometer Market, Incremental Opportunity, by Propulsion, Value (US$ Mn), 2021-2031
Figure 109: Russia & CIS Test Automation Systems for Powertrain Dynamometer Market Value (U$ Mn) Forecast, by Testing Type, 2017-2031
Figure 110: Russia & CIS Test Automation Systems for Powertrain Dynamometer Market, Incremental Opportunity, by Testing Type, Value (US$ Mn), 2021-2031
Figure 111: Rest of Europe Test Automation Systems for Powertrain Dynamometer Market Value (U$ Mn) Forecast, by Communication, 2017-2031
Figure 112: Rest of Europe Test Automation Systems for Powertrain Dynamometer Market, Incremental Opportunity, by Communication, Value (US$ Mn), 2021-2031
Figure 113: Rest of Europe Test Automation Systems for Powertrain Dynamometer Market Value (U$ Mn) Forecast, by Vehicle Type, 2017-2031
Figure 114: Rest of Europe Test Automation Systems for Powertrain Dynamometer Market, Incremental Opportunity, by Vehicle Type, Value (US$ Mn), 2021-2031
Figure 115: Rest of Europe Test Automation Systems for Powertrain Dynamometer Market Value (U$ Mn) Forecast, by Propulsion, 2017-2031
Figure 116: Rest of Europe Test Automation Systems for Powertrain Dynamometer Market, Incremental Opportunity, by Propulsion, Value (US$ Mn), 2021-2031
Figure 117: Rest of Europe Test Automation Systems for Powertrain Dynamometer Market Value (U$ Mn) Forecast, by Testing Type, 2017-2031
Figure 118: Rest of Europe Test Automation Systems for Powertrain Dynamometer Market, Incremental Opportunity, by Testing Type, Value (US$ Mn), 2021-2031
Figure 119: Asia Pacific Test Automation Systems for Powertrain Dynamometer Market Value (U$ Mn) Forecast, by Communication, 2017-2031
Figure 120: Asia Pacific Test Automation Systems for Powertrain Dynamometer Market, Incremental Opportunity, by Communication, Value (US$ Mn), 2021-2031
Figure 121: Asia Pacific Test Automation Systems for Powertrain Dynamometer Market Value (U$ Mn) Forecast, by Vehicle Type, 2017-2031
Figure 122: Asia Pacific Test Automation Systems for Powertrain Dynamometer Market, Incremental Opportunity, by Vehicle Type, Value (US$ Mn), 2021-2031
Figure 123: Asia Pacific Test Automation Systems for Powertrain Dynamometer Market Value (U$ Mn) Forecast, by Propulsion, 2017-2031
Figure 124: Asia Pacific Test Automation Systems for Powertrain Dynamometer Market, Incremental Opportunity, by Propulsion, Value (US$ Mn), 2021-2031
Figure 125: Asia Pacific Test Automation Systems for Powertrain Dynamometer Market Value (U$ Mn) Forecast, by Testing Type, 2017-2031
Figure 126: Asia Pacific Test Automation Systems for Powertrain Dynamometer Market, Incremental Opportunity, by Testing Type, Value (US$ Mn), 2021-2031
Figure 127: Asia Pacific Test Automation Systems for Powertrain Dynamometer Market Value (U$ Mn) Forecast, by Country & Sub-region, 2017-2031
Figure 128: Asia Pacific Test Automation Systems for Powertrain Dynamometer Market, Incremental Opportunity, by Country & Sub-region, Value (US$ Mn), 2021-2031
Figure 129: China Test Automation Systems for Powertrain Dynamometer Market Value (U$ Mn) Forecast, by Communication, 2017-2031
Figure 130: China Test Automation Systems for Powertrain Dynamometer Market, Incremental Opportunity, by Communication, Value (US$ Mn), 2021-2031
Figure 131: China Test Automation Systems for Powertrain Dynamometer Market Value (U$ Mn) Forecast, by Vehicle Type, 2017-2031
Figure 132: China Test Automation Systems for Powertrain Dynamometer Market, Incremental Opportunity, by Vehicle Type, Value (US$ Mn), 2021-2031
Figure 133: China Test Automation Systems for Powertrain Dynamometer Market Value (U$ Mn) Forecast, by Propulsion, 2017-2031
Figure 134: China Test Automation Systems for Powertrain Dynamometer Market, Incremental Opportunity, by Propulsion, Value (US$ Mn), 2021-2031
Figure 135: China Test Automation Systems for Powertrain Dynamometer Market Value (U$ Mn) Forecast, by Testing Type, 2017-2031
Figure 136: China Test Automation Systems for Powertrain Dynamometer Market, Incremental Opportunity, by Testing Type, Value (US$ Mn), 2021-2031
Figure 137: India Test Automation Systems for Powertrain Dynamometer Market Value (U$ Mn) Forecast, by Communication, 2017-2031
Figure 138: India Test Automation Systems for Powertrain Dynamometer Market, Incremental Opportunity, by Communication, Value (US$ Mn), 2021-2031
Figure 139: India Test Automation Systems for Powertrain Dynamometer Market Value (U$ Mn) Forecast, by Vehicle Type, 2017-2031
Figure 140: India Test Automation Systems for Powertrain Dynamometer Market, Incremental Opportunity, by Vehicle Type, Value (US$ Mn), 2021-2031
Figure 141: India Test Automation Systems for Powertrain Dynamometer Market Value (U$ Mn) Forecast, by Propulsion, 2017-2031
Figure 142: India Test Automation Systems for Powertrain Dynamometer Market, Incremental Opportunity, by Propulsion, Value (US$ Mn), 2021-2031
Figure 143: India Test Automation Systems for Powertrain Dynamometer Market Value (U$ Mn) Forecast, by Testing Type, 2017-2031
Figure 144: India Test Automation Systems for Powertrain Dynamometer Market, Incremental Opportunity, by Testing Type, Value (US$ Mn), 2021-2031
Figure 145: Japan Test Automation Systems for Powertrain Dynamometer Market Value (U$ Mn) Forecast, by Communication, 2017-2031
Figure 146: Japan Test Automation Systems for Powertrain Dynamometer Market, Incremental Opportunity, by Communication, Value (US$ Mn), 2021-2031
Figure 147: Japan Test Automation Systems for Powertrain Dynamometer Market Value (U$ Mn) Forecast, by Vehicle Type, 2017-2031
Figure 148: Japan Test Automation Systems for Powertrain Dynamometer Market, Incremental Opportunity, by Vehicle Type, Value (US$ Mn), 2021-2031
Figure 149: Japan Test Automation Systems for Powertrain Dynamometer Market Value (U$ Mn) Forecast, by Propulsion, 2017-2031
Figure 150: Japan Test Automation Systems for Powertrain Dynamometer Market, Incremental Opportunity, by Propulsion, Value (US$ Mn), 2021-2031
Figure 151: Japan Test Automation Systems for Powertrain Dynamometer Market Value (U$ Mn) Forecast, by Testing Type, 2017-2031
Figure 152: Japan Test Automation Systems for Powertrain Dynamometer Market, Incremental Opportunity, by Testing Type, Value (US$ Mn), 2021-2031
Figure 153: ASEAN Test Automation Systems for Powertrain Dynamometer Market Value (U$ Mn) Forecast, by Communication, 2017-2031
Figure 154: ASEAN Test Automation Systems for Powertrain Dynamometer Market, Incremental Opportunity, by Communication, Value (US$ Mn), 2021-2031
Figure 155: ASEAN Test Automation Systems for Powertrain Dynamometer Market Value (U$ Mn) Forecast, by Vehicle Type, 2017-2031
Figure 156: ASEAN Test Automation Systems for Powertrain Dynamometer Market, Incremental Opportunity, by Vehicle Type, Value (US$ Mn), 2021-2031
Figure 157: ASEAN Test Automation Systems for Powertrain Dynamometer Market Value (U$ Mn) Forecast, by Propulsion, 2017-2031
Figure 158: ASEAN Test Automation Systems for Powertrain Dynamometer Market, Incremental Opportunity, by Propulsion, Value (US$ Mn), 2021-2031
Figure 159: ASEAN Test Automation Systems for Powertrain Dynamometer Market Value (U$ Mn) Forecast, by Testing Type, 2017-2031
Figure 160: ASEAN Test Automation Systems for Powertrain Dynamometer Market, Incremental Opportunity, by Testing Type, Value (US$ Mn), 2021-2031
Figure 161: South Korea Test Automation Systems for Powertrain Dynamometer Market Value (U$ Mn) Forecast, by Communication, 2017-2031
Figure 162: South Korea Test Automation Systems for Powertrain Dynamometer Market, Incremental Opportunity, by Communication, Value (US$ Mn), 2021-2031
Figure 163: South Korea Test Automation Systems for Powertrain Dynamometer Market Value (U$ Mn) Forecast, by Vehicle Type, 2017-2031
Figure 164: South Korea Test Automation Systems for Powertrain Dynamometer Market, Incremental Opportunity, by Vehicle Type, Value (US$ Mn), 2021-2031
Figure 165: South Korea Test Automation Systems for Powertrain Dynamometer Market Value (U$ Mn) Forecast, by Propulsion, 2017-2031
Figure 166: South Korea Test Automation Systems for Powertrain Dynamometer Market, Incremental Opportunity, by Propulsion, Value (US$ Mn), 2021-2031
Figure 167: South Korea Test Automation Systems for Powertrain Dynamometer Market Value (U$ Mn) Forecast, by Testing Type, 2017-2031
Figure 168: South Korea Test Automation Systems for Powertrain Dynamometer Market, Incremental Opportunity, by Testing Type, Value (US$ Mn), 2021-2031
Figure 169: ANZ Test Automation Systems for Powertrain Dynamometer Market Value (U$ Mn) Forecast, by Communication, 2017-2031
Figure 170: ANZ Test Automation Systems for Powertrain Dynamometer Market, Incremental Opportunity, by Communication, Value (US$ Mn), 2021-2031
Figure 171: ANZ Test Automation Systems for Powertrain Dynamometer Market Value (U$ Mn) Forecast, by Vehicle Type, 2017-2031
Figure 172: ANZ Test Automation Systems for Powertrain Dynamometer Market, Incremental Opportunity, by Vehicle Type, Value (US$ Mn), 2021-2031
Figure 173: ANZ Test Automation Systems for Powertrain Dynamometer Market Value (U$ Mn) Forecast, by Propulsion, 2017-2031
Figure 174: ANZ Test Automation Systems for Powertrain Dynamometer Market, Incremental Opportunity, by Propulsion, Value (US$ Mn), 2021-2031
Figure 175: ANZ Test Automation Systems for Powertrain Dynamometer Market Value (U$ Mn) Forecast, by Testing Type, 2017-2031
Figure 176: ANZ Test Automation Systems for Powertrain Dynamometer Market, Incremental Opportunity, by Testing Type, Value (US$ Mn), 2021-2031
Figure 177: Rest of Asia Pacific Test Automation Systems for Powertrain Dynamometer Market Value (U$ Mn) Forecast, by Communication, 2017-2031
Figure 178: Rest of Asia Pacific Test Automation Systems for Powertrain Dynamometer Market, Incremental Opportunity, by Communication, Value (US$ Mn), 2021-2031
Figure 179: Rest of Asia Pacific Test Automation Systems for Powertrain Dynamometer Market Value (U$ Mn) Forecast, by Vehicle Type, 2017-2031
Figure 180: Rest of Asia Pacific Test Automation Systems for Powertrain Dynamometer Market, Incremental Opportunity, by Vehicle Type, Value (US$ Mn), 2021-2031
Figure 181: Rest of Asia Pacific Test Automation Systems for Powertrain Dynamometer Market Value (U$ Mn) Forecast, by Propulsion, 2017-2031
Figure 182: Rest of Asia Pacific Test Automation Systems for Powertrain Dynamometer Market, Incremental Opportunity, by Propulsion, Value (US$ Mn), 2021-2031
Figure 183: Rest of Asia Pacific Test Automation Systems for Powertrain Dynamometer Market Value (U$ Mn) Forecast, by Testing Type, 2017-2031
Figure 184: Rest of Asia Pacific Test Automation Systems for Powertrain Dynamometer Market, Incremental Opportunity, by Testing Type, Value (US$ Mn), 2021-2031
Figure 185: Middle East & Africa Test Automation Systems for Powertrain Dynamometer Market Value (U$ Mn) Forecast, by Communication, 2017-2031
Figure 186: Middle East & Africa Test Automation Systems for Powertrain Dynamometer Market, Incremental Opportunity, by Communication, Value (US$ Mn), 2021-2031
Figure 187: Middle East & Africa Test Automation Systems for Powertrain Dynamometer Market Value (U$ Mn) Forecast, by Vehicle Type, 2017-2031
Figure 188: Middle East & Africa Test Automation Systems for Powertrain Dynamometer Market, Incremental Opportunity, by Vehicle Type, Value (US$ Mn), 2021-2031
Figure 189: Middle East & Africa Test Automation Systems for Powertrain Dynamometer Market Value (U$ Mn) Forecast, by Propulsion, 2017-2031
Figure 190: Middle East & Africa Test Automation Systems for Powertrain Dynamometer Market, Incremental Opportunity, by Propulsion, Value (US$ Mn), 2021-2031
Figure 191: Middle East & Africa Test Automation Systems for Powertrain Dynamometer Market Value (U$ Mn) Forecast, by Testing Type, 2017-2031
Figure 192: Middle East & Africa Test Automation Systems for Powertrain Dynamometer Market, Incremental Opportunity, by Testing Type, Value (US$ Mn), 2021-2031
Figure 193: Middle East & Africa Test Automation Systems for Powertrain Dynamometer Market Value (U$ Mn) Forecast, by Country & Sub-region, 2017-2031
Figure 194: Middle East & Africa Test Automation Systems for Powertrain Dynamometer Market, Incremental Opportunity, by Country & Sub-region, Value (US$ Mn), 2021-2031
Figure 195: GCC Test Automation Systems for Powertrain Dynamometer Market Value (U$ Mn) Forecast, by Communication, 2017-2031
Figure 196: GCC Test Automation Systems for Powertrain Dynamometer Market, Incremental Opportunity, by Communication, Value (US$ Mn), 2021-2031
Figure 197: GCC Test Automation Systems for Powertrain Dynamometer Market Value (U$ Mn) Forecast, by Vehicle Type, 2017-2031
Figure 198: GCC Test Automation Systems for Powertrain Dynamometer Market, Incremental Opportunity, by Vehicle Type, Value (US$ Mn), 2021-2031
Figure 199: GCC Test Automation Systems for Powertrain Dynamometer Market Value (U$ Mn) Forecast, by Propulsion, 2017-2031
Figure 200: GCC Test Automation Systems for Powertrain Dynamometer Market, Incremental Opportunity, by Propulsion, Value (US$ Mn), 2021-2031
Figure 201: GCC Test Automation Systems for Powertrain Dynamometer Market Value (U$ Mn) Forecast, by Testing Type, 2017-2031
Figure 202: GCC Test Automation Systems for Powertrain Dynamometer Market, Incremental Opportunity, by Testing Type, Value (US$ Mn), 2021-2031
Figure 203: South Africa Test Automation Systems for Powertrain Dynamometer Market Value (U$ Mn) Forecast, by Communication, 2017-2031
Figure 204: South Africa Test Automation Systems for Powertrain Dynamometer Market, Incremental Opportunity, by Communication, Value (US$ Mn), 2021-2031
Figure 205: South Africa Test Automation Systems for Powertrain Dynamometer Market Value (U$ Mn) Forecast, by Vehicle Type, 2017-2031
Figure 206: South Africa Test Automation Systems for Powertrain Dynamometer Market, Incremental Opportunity, by Vehicle Type, Value (US$ Mn), 2021-2031
Figure 207: South Africa Test Automation Systems for Powertrain Dynamometer Market Value (U$ Mn) Forecast, by Propulsion, 2017-2031
Figure 208: South Africa Test Automation Systems for Powertrain Dynamometer Market, Incremental Opportunity, by Propulsion, Value (US$ Mn), 2021-2031
Figure 209: South Africa Test Automation Systems for Powertrain Dynamometer Market Value (U$ Mn) Forecast, by Testing Type, 2017-2031
Figure 210: South Africa Test Automation Systems for Powertrain Dynamometer Market, Incremental Opportunity, by Testing Type, Value (US$ Mn), 2021-2031
Figure 211: Turkey Test Automation Systems for Powertrain Dynamometer Market Value (U$ Mn) Forecast, by Communication, 2017-2031
Figure 212: Turkey Test Automation Systems for Powertrain Dynamometer Market, Incremental Opportunity, by Communication, Value (US$ Mn), 2021-2031
Figure 213: Turkey Test Automation Systems for Powertrain Dynamometer Market Value (U$ Mn) Forecast, by Vehicle Type, 2017-2031
Figure 214: Turkey Test Automation Systems for Powertrain Dynamometer Market, Incremental Opportunity, by Vehicle Type, Value (US$ Mn), 2021-2031
Figure 215: Turkey Test Automation Systems for Powertrain Dynamometer Market Value (U$ Mn) Forecast, by Propulsion, 2017-2031
Figure 216: Turkey Test Automation Systems for Powertrain Dynamometer Market, Incremental Opportunity, by Propulsion, Value (US$ Mn), 2021-2031
Figure 217: Turkey Test Automation Systems for Powertrain Dynamometer Market Value (U$ Mn) Forecast, by Testing Type, 2017-2031
Figure 218: Turkey Test Automation Systems for Powertrain Dynamometer Market, Incremental Opportunity, by Testing Type, Value (US$ Mn), 2021-2031
Figure 219: Rest of Middle East & Africa Test Automation Systems for Powertrain Dynamometer Market Value (U$ Mn) Forecast, by Communication, 2017-2031
Figure 220: Rest of Middle East & Africa Test Automation Systems for Powertrain Dynamometer Market, Incremental Opportunity, by Communication, Value (US$ Mn), 2021-2031
Figure 221: Rest of Middle East & Africa Test Automation Systems for Powertrain Dynamometer Market Value (U$ Mn) Forecast, by Vehicle Type, 2017-2031
Figure 222: Rest of Middle East & Africa Test Automation Systems for Powertrain Dynamometer Market, Incremental Opportunity, by Vehicle Type, Value (US$ Mn), 2021-2031
Figure 223: Rest of Middle East & Africa Test Automation Systems for Powertrain Dynamometer Market Value (U$ Mn) Forecast, by Propulsion, 2017-2031
Figure 224: Rest of Middle East & Africa Test Automation Systems for Powertrain Dynamometer Market, Incremental Opportunity, by Propulsion, Value (US$ Mn), 2021-2031
Figure 225: Rest of Middle East & Africa Test Automation Systems for Powertrain Dynamometer Market Value (U$ Mn) Forecast, by Testing Type, 2017-2031
Figure 226: Rest of Middle East & Africa Test Automation Systems for Powertrain Dynamometer Market, Incremental Opportunity, by Testing Type, Value (US$ Mn), 2021-2031
Figure 227: South America Test Automation Systems for Powertrain Dynamometer Market Value (U$ Mn) Forecast, by Communication, 2017-2031
Figure 228: South America Test Automation Systems for Powertrain Dynamometer Market, Incremental Opportunity, by Communication, Value (US$ Mn), 2021-2031
Figure 229: South America Test Automation Systems for Powertrain Dynamometer Market Value (U$ Mn) Forecast, by Vehicle Type, 2017-2031
Figure 230: South America Test Automation Systems for Powertrain Dynamometer Market, Incremental Opportunity, by Vehicle Type, Value (US$ Mn), 2021-2031
Figure 231: South America Test Automation Systems for Powertrain Dynamometer Market Value (U$ Mn) Forecast, by Propulsion, 2017-2031
Figure 232: South America Test Automation Systems for Powertrain Dynamometer Market, Incremental Opportunity, by Propulsion, Value (US$ Mn), 2021-2031
Figure 233: South America Test Automation Systems for Powertrain Dynamometer Market Value (U$ Mn) Forecast, by Testing Type, 2017-2031
Figure 234: South America Test Automation Systems for Powertrain Dynamometer Market, Incremental Opportunity, by Testing Type, Value (US$ Mn), 2021-2031
Figure 235: South America Test Automation Systems for Powertrain Dynamometer Market Value (U$ Mn) Forecast, by Country & Sub-region, 2017-2031
Figure 236: South America Test Automation Systems for Powertrain Dynamometer Market, Incremental Opportunity, by Country & Sub-region, Value (US$ Mn), 2021-2031
Figure 237: Brazil Test Automation Systems for Powertrain Dynamometer Market Value (U$ Mn) Forecast, by Communication, 2017-2031
Figure 238: Brazil Test Automation Systems for Powertrain Dynamometer Market, Incremental Opportunity, by Communication, Value (US$ Mn), 2021-2031
Figure 239: Brazil Test Automation Systems for Powertrain Dynamometer Market Value (U$ Mn) Forecast, by Vehicle Type, 2017-2031
Figure 240: Brazil Test Automation Systems for Powertrain Dynamometer Market, Incremental Opportunity, by Vehicle Type, Value (US$ Mn), 2021-2031
Figure 241: Brazil Test Automation Systems for Powertrain Dynamometer Market Value (U$ Mn) Forecast, by Propulsion, 2017-2031
Figure 242: Brazil Test Automation Systems for Powertrain Dynamometer Market, Incremental Opportunity, by Propulsion, Value (US$ Mn), 2021-2031
Figure 243: Brazil Test Automation Systems for Powertrain Dynamometer Market Value (U$ Mn) Forecast, by Testing Type, 2017-2031
Figure 244: Brazil Test Automation Systems for Powertrain Dynamometer Market, Incremental Opportunity, by Testing Type, Value (US$ Mn), 2021-2031
Figure 245: Argentina Test Automation Systems for Powertrain Dynamometer Market Value (U$ Mn) Forecast, by Communication, 2017-2031
Figure 246: Argentina Test Automation Systems for Powertrain Dynamometer Market, Incremental Opportunity, by Communication, Value (US$ Mn), 2021-2031
Figure 247: Argentina Test Automation Systems for Powertrain Dynamometer Market Value (U$ Mn) Forecast, by Vehicle Type, 2017-2031
Figure 248: Argentina Test Automation Systems for Powertrain Dynamometer Market, Incremental Opportunity, by Vehicle Type, Value (US$ Mn), 2021-2031
Figure 249: Argentina Test Automation Systems for Powertrain Dynamometer Market Value (U$ Mn) Forecast, by Propulsion, 2017-2031
Figure 250: Argentina Test Automation Systems for Powertrain Dynamometer Market, Incremental Opportunity, by Propulsion, Value (US$ Mn), 2021-2031
Figure 251: Argentina Test Automation Systems for Powertrain Dynamometer Market Value (U$ Mn) Forecast, by Testing Type, 2017-2031
Figure 252: Argentina Test Automation Systems for Powertrain Dynamometer Market, Incremental Opportunity, by Testing Type, Value (US$ Mn), 2021-2031
Figure 253: Rest of South America Test Automation Systems for Powertrain Dynamometer Market Value (U$ Mn) Forecast, by Communication, 2017-2031
Figure 254: Rest of South America Test Automation Systems for Powertrain Dynamometer Market, Incremental Opportunity, by Communication, Value (US$ Mn), 2021-2031
Figure 255: Rest of South America Test Automation Systems for Powertrain Dynamometer Market Value (U$ Mn) Forecast, by Vehicle Type, 2017-2031
Figure 256: Rest of South America Test Automation Systems for Powertrain Dynamometer Market, Incremental Opportunity, by Vehicle Type, Value (US$ Mn), 2021-2031
Figure 257: Rest of South America Test Automation Systems for Powertrain Dynamometer Market Value (U$ Mn) Forecast, by Propulsion, 2017-2031
Figure 258: Rest of South America Test Automation Systems for Powertrain Dynamometer Market, Incremental Opportunity, by Propulsion, Value (US$ Mn), 2021-2031
Figure 259: Rest of South America Test Automation Systems for Powertrain Dynamometer Market Value (U$ Mn) Forecast, by Testing Type, 2017-2031
Figure 260: Rest of South America Test Automation Systems for Powertrain Dynamometer Market, Incremental Opportunity, by Testing Type, Value (US$ Mn), 2021-2031
Copyright © Transparency Market Research, Inc. All Rights reserved
Trust Online

Test Automation Systems for Powertrain Dynamometer Market Insights 2031