
Reports
Reports
Telecom Service Provider Investment (CAPEX) Analysis Market - Snapshot
The telecom service provider investment (CAPEX) analysis report provides detailed information about CAPEX spending of telecom service providers on various telecom equipment they buy from OEM’s and Engineering, Procurement and Construction (EPC) companies. Telecom service providers are looking to invest in various software platforms and hardware that will enable them to operate in the digitized ecosystem and help them to optimize their network and enhance the customer experience.
The rise of the fifth generation of cellular technology is expected to drive telecom service providers’ CAPEX in the coming years. 5G technology is currently in the testing phase and is expected to be launched fully in the next few years. Telecom service providers are setting aside significant amounts of capital in order to accelerate network deployment and increase their network capacity.Moreover, rapid development in terms of research activities with respect to innovative telecom equipment and services by equipment manufacturers is allowing telecom service providers to deploy or launch their 5G services as per their intended schedule. Rise in demand for 5G connectivity has led to a rise in investment from telecom service providers in every zone. 5G connectivity is likely to enhance network performance tenfold as compared to the current level in terms of network throughput, latency, reliability, etc. To achieve this, telecom operators will have to proactively invest in 5G infrastructure. The spending would be mainly for new spectrum, RAN infrastructure, and transmission networks. However, this new approach of network and asset sharing is one of the factors that is leading to low capital investment of Telecom Service Providers (TSPs).
Capital expenditure spending of telecom service providers is bifurcated on the basis of vendor type, equipment type, services, and network type. Vendor type segment is further bifurcated into OEM’s and Telcos/EPC’s. Based on vendor type, telecom operators are expected to spend more on OEM’s. This is due to the increasing number of partnership deals between them to support the smart city initiatives undertaken by governments.
Equipment covered in the study are telecom hardware, and IT or non-telecom hardware. Telecom hardware includes aggregation equipment, wireless infrastructure, IP routers and CES, optical equipment, TDM voice infrastructure, and other telecom/datacom network equipment. IT or non-telecom hardware includes batteries, control hardware, etc. On the basis of services, telecom service provider CAPEX spending is bifurcated into EPC and others. Others segment is further dividedinto consulting, network design and engineering, installation & maintenance, and testing & optimization. On the basis of network type, the spending is bifurcated into wired and wireless. Telecom operator CAPEX spending is majorly seen in wired network connectivity services. This is due to the fact that operators are trying to mark their presence in untapped markets and expand their network coverage. This expansion of network capacity and coverage will require operators to increase their investment in the equipment and services required for the same.
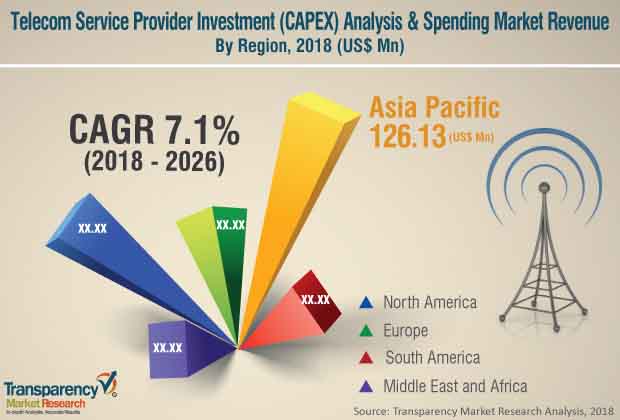
In terms of region, the study has been divided into North America, Europe, Asia Pacific, Middle East & Africa, and South America.The market in Asia Pacific is expected to account for a larger share during the forecast period. This is attributed to the many untapped markets in this region. Moreover, along with large population, demand for connectivity services is also significantly growing, thus providing an opportunity for telecom operators to enhance their revenue streams. More number of carriers in Asia Pacific is also one of the reasons for Asia Pacific to have a larger share in telecom operator spending.
Telecomservice provider (CAPEX) analysis study include CAPEX spending of China Mobile Ltd.,Verizon Communications, Inc., AT&T, Inc., Vodafone Group Plc., Nippon Telegraph & Telephone Corporation, Telefonica S.A., America Movil, China Telecom, SoftBank, Deutsche Telekom and other TSP’s.Furthermore we have also analyzed various OEM’s and EPC’s. Some of the leading OEM’s included in the company profile section includes Cisco Systems, Inc., Nokia Corporation, Huawei Technologies Co., Ltd., ZTE Corporation, and others.
1. Preface
1.1. Market Scope
1.2. Market Segmentation
1.3. Key Research Objectives
2. Assumptions and Research Methodology
2.1. Research Methodology
2.1.1. List of Primary and Secondary Sources
2.2. Key Assumptions for Data Modelling
3. Executive Summary: Global Telecom Service Provider Investment (CAPEX) Analysis
4. Market Overview
4.1. Introduction
4.2. Global Market – Macro Economic Factors Overview
4.2.1. ICT Spending (US$ Mn), 2012, 2018, 2026
4.2.2. Key Regional Socio-Political-Technological Developments and Their Impact Considerations
4.3. Technology/Product Roadmap
4.4. Market Dynamics
4.4.1. Drivers
4.4.2. Restraints
4.4.3. Opportunities
4.5. Key Trends Analysis
4.6. Porter’s Five Forces Analysis
4.7. Value Chain Analysis
4.7.1. Telecom Service Providers
4.7.2. OEMs
4.7.3. EPC/Design Service Providers
4.8. Global Telecom Service Provider Investment (CAPEX) Analysis and Forecast, 2016 - 2026
4.8.1. Historic Growth Trends, 2012-2017
4.8.2. Forecast Trends, 2018-2026
4.9. Market Attractiveness Analysis(Global/North America/Europe/Asia Pacific/Middle East &Africa/South Africa)
4.9.1. By Region/Country
4.9.2. By Infrastructure
4.9.3. By Services
4.9.4. By Network Type
4.10. Telecom Service Provider Investment (CAPEX) Share Analysis, By Stakeholder (2017)
4.10.1. OEMs
4.10.2. EPC/Design Service Providers
4.11. Market Outlook
4.12. Competitive Scenario and Trends
4.12.1. Global Telecom Market Concentration Rate
4.12.1.1.List of New Entrants
4.12.1.2.Mergers & Acquisitions, Expansions
5. Global Telecom Service Provider Investment (CAPEX) and Forecast, By Infrastructure
5.1. Overview & Definitions
5.2. Key Segment Analysis
5.3. Telecom Service Provider Investment (CAPEX) Analysis (US$ Bn) and Forecast, By Infrastructure, 2016 - 2026
5.3.1. Hardware (By Vendor Type)
5.3.1.1. OEMs
5.3.1.2. Telcos/EPCs
5.3.2. Hardware (By Equipment Type)
5.3.2.1. Telecom Hardware
5.3.2.1.1. Aggregation Equipment
5.3.2.1.2. Wireless Infrastructure
5.3.2.1.3. IP Routers and CES
5.3.2.1.4. Optical Equipment
5.3.2.1.5. TDM Voice Infrastructure
5.3.2.1.6. Other Telecom/Datacom Network Equipment
5.3.2.2. IT Hardware (Non-telecom)
6. Global Telecom Service Provider Investment (CAPEX) and Forecast, By Services
6.1. Overview & Definitions
6.2. Key Segment Analysis
6.3. Telecom Service Provider Investment (CAPEX) Analysis (US$ Bn) and Forecast, By Services, 2016 - 2026
6.3.1. EPC
6.3.2. Others
6.3.2.1. Consulting
6.3.2.2. Network Design and Engineering
6.3.2.3. Installation and Maintenance
6.3.2.4. Testing and Optimization
7. Global Telecom Service Provider Investment (CAPEX) and Forecast, By Network Type
7.1. Overview & Definitions
7.2. Key Segment Analysis
7.3. Telecom Service Provider Investment (CAPEX) Analysis (US$ Bn) and Forecast, By Network Type, 2016 - 2026
7.3.1. Wired
7.3.2. Wireless
8. Global Telecom Service Provider Investment (CAPEX) and Forecast, by Region
8.1. Key Findings
8.2. Telecom Service Provider Investment (CAPEX) Analysis (US$ Bn) and Forecast, by Region, 2016 - 2026
8.2.1. North America
8.2.2. Europe
8.2.3. Asia Pacific
8.2.4. Middle East &Africa
8.2.5. South America
8.3. Region Market Value Share
9. North America Telecom Service Provider Investment (CAPEX) Analysis and Forecast
9.1. Key Findings
9.2. Telecom Service Provider Investment (CAPEX) Analysis (US$ Bn) and Forecast, By Infrastructure, 2016 - 2026
9.2.1. Hardware (By Vendor Type)
9.2.1.1. OEMs
9.2.1.2. Telcos/EPCs
9.2.2. Hardware (By Equipment Type)
9.2.2.1. Telecom Hardware
9.2.2.1.1. Aggregation Equipment
9.2.2.1.2. Wireless Infrastructure
9.2.2.1.3. IP Routers and CES
9.2.2.1.4. Optical Equipment
9.2.2.1.5. TDM Voice Infrastructure
9.2.2.1.6. Other Telecom/Datacom Network Equipment
9.2.2.2. IT Hardware (Non-telecom)
9.3. Telecom Service Provider Investment (CAPEX) Analysis (US$ Bn) and Forecast, By Services, 2016 - 2026
9.3.1. EPC
9.3.2. Others
9.3.2.1. Consulting
9.3.2.2. Network Design and Engineering
9.3.2.3. Installation and Maintenance
9.3.2.4. Testing and Optimization
9.4. Telecom Service Provider Investment (CAPEX) Analysis (US$ Bn) and Forecast, By Network Type, 2016 - 2026
9.4.1. Wired
9.4.2. Wireless
9.5. Telecom Service Provider Investment (CAPEX) Analysis (US$ Bn) and Forecast, By Countryand Region, 2016 - 2026
9.5.1. The U.S.
9.5.2. Canada
9.5.3. Rest of North America
10. Europe Telecom Service Provider Investment (CAPEX) and Forecast
10.1. Key Findings
10.2. Telecom Service Provider Investment (CAPEX) Analysis (US$ Bn) and Forecast, By Infrastructure, 2016 - 2026
10.2.1. Hardware (By Vendor Type)
10.2.1.1.OEMs
10.2.1.2.Telcos/EPCs
10.2.2. Hardware (By Equipment Type)
10.2.2.1.Telecom Hardware
10.2.2.1.1.Aggregation Equipment
10.2.2.1.2.Wireless Infrastructure
10.2.2.1.3.IP Routers and CES
10.2.2.1.4.Optical Equipment
10.2.2.1.5.TDM Voice Infrastructure
10.2.2.1.6.Other Telecom/Datacom Network Equipment
10.2.2.2.IT Hardware (Non-telecom)
10.3. Telecom Service Provider Investment (CAPEX) Analysis (US$ Bn) and Forecast, By Services, 2016 - 2026
10.3.1. EPC
10.3.2. Others
10.3.2.1.Consulting
10.3.2.2.Network Design and Engineering
10.3.2.3.Installation and Maintenance
10.3.2.4.Testing and Optimization
10.4. Telecom Service Provider Investment (CAPEX) Analysis (US$ Bn) and Forecast, By Network Type, 2016 - 2026
10.4.1. Wired
10.4.2. Wireless
10.5. Telecom Service Provider Investment (CAPEX) Analysis (US$ Bn) and Forecast, By Country and Region, 2016 - 2026
10.5.1. Germany
10.5.2. France
10.5.3. UK
10.5.4. Rest of Europe
11. Asia Pacific Telecom Service Provider Investment (CAPEX) and Forecast
11.1. Key Findings
11.2. Telecom Service Provider Investment (CAPEX) Analysis (US$ Bn) and Forecast, By Infrastructure, 2016 - 2026
11.2.1. Hardware (By Vendor Type)
11.2.1.1.OEMs
11.2.1.2.Telcos/EPCs
11.2.2. Hardware (By Equipment Type)
11.2.2.1.Telecom Hardware
11.2.2.1.1.Aggregation Equipment
11.2.2.1.2.Wireless Infrastructure
11.2.2.1.3.IP Routers and CES
11.2.2.1.4.Optical Equipment
11.2.2.1.5.TDM Voice Infrastructure
11.2.2.1.6.Other Telecom/Datacom Network Equipment
11.2.2.2.IT Hardware (Non-telecom)
11.3. Telecom Service Provider Investment (CAPEX) Analysis (US$ Bn) and Forecast, By Services, 2016 - 2026
11.3.1. EPC
11.3.2. Others
11.3.2.1.Consulting
11.3.2.2.Network Design and Engineering
11.3.2.3.Installation and Maintenance
11.3.2.4.Testing and Optimization
11.4. Telecom Service Provider Investment (CAPEX) Analysis (US$ Bn) and Forecast, By Network Type, 2016 - 2026
11.4.1. Wired
11.4.2. Wireless
11.5. Telecom Service Provider Investment (CAPEX) Analysis (US$ Bn) and Forecast, By Country and Region, 2016 - 2026
11.5.1. China
11.5.2. Japan
11.5.3. India
11.5.4. Australia
11.5.5. Rest of Asia Pacific
12. Middle East &Africa (MEA) Telecom Service Provider Investment (CAPEX) and Forecast
12.1. Key Findings
12.2. Telecom Service Provider Investment (CAPEX) Analysis (US$ Bn) and Forecast, By Infrastructure, 2016 - 2026
12.2.1. Hardware (By Vendor Type)
12.2.1.1.OEMs
12.2.1.2.Telcos/EPCs
12.2.2. Hardware (By Equipment Type)
12.2.2.1.Telecom Hardware
12.2.2.1.1.Aggregation Equipment
12.2.2.1.2.Wireless Infrastructure
12.2.2.1.3.IP Routers and CES
12.2.2.1.4.Optical Equipment
12.2.2.1.5.TDM Voice Infrastructure
12.2.2.1.6.Other Telecom/Datacom Network Equipment
12.2.2.2.IT Hardware (Non-telecom)
12.3. Telecom Service Provider Investment (CAPEX) Analysis (US$ Bn) and Forecast, By Services, 2016 - 2026
12.3.1. EPC
12.3.2. Others
12.3.2.1.Consulting
12.3.2.2.Network Design and Engineering
12.3.2.3.Installation and Maintenance
12.3.2.4.Testing and Optimization
12.4. Telecom Service Provider Investment (CAPEX) Analysis (US$ Bn) and Forecast, By Network Type, 2016 - 2026
12.4.1. Wired
12.4.2. Wireless
12.5. Telecom Service Provider Investment (CAPEX) Analysis (US$ Bn) and Forecast, By Country and Region, 2016 - 2026
12.5.1. GCC Countries
12.5.2. South Africa
12.5.3. Rest of MEA
13. South America Telecom Service Provider Investment (CAPEX) Analysis and Forecast
13.1. Key Findings
13.2. Telecom Service Provider Investment (CAPEX) Analysis (US$ Bn) and Forecast, By Infrastructure, 2016 - 2026
13.2.1. Hardware (By Vendor Type)
13.2.1.1.OEMs
13.2.1.2.Telcos/EPCs
13.2.2. Hardware (By Equipment Type)
13.2.2.1.Telecom Hardware
13.2.2.1.1.Aggregation Equipment
13.2.2.1.2.Wireless Infrastructure
13.2.2.1.3.IP Routers and CES
13.2.2.1.4.Optical Equipment
13.2.2.1.5.TDM Voice Infrastructure
13.2.2.1.6.Other Telecom/Datacom Network Equipment
13.2.2.2.IT Hardware (Non-telecom)
13.3. Telecom Service Provider Investment (CAPEX) Analysis (US$ Bn) and Forecast, By Services, 2016 - 2026
13.3.1. EPC
13.3.2. Others
13.3.2.1.Consulting
13.3.2.2.Network Design and Engineering
13.3.2.3.Installation and Maintenance
13.3.2.4.Testing and Optimization
13.4. Telecom Service Provider Investment (CAPEX) Analysis (US$ Bn) and Forecast, By Network Type, 2016 - 2026
13.4.1. Wired
13.4.2. Wireless
13.5. Telecom Service Provider Investment (CAPEX) Analysis (US$ Bn) and Forecast, By Country and Region, 2016 - 2026
13.5.1. Brazil
13.5.2. Rest of South America
14. Competition Landscape
14.1. Market Player – Competition Matrix
14.1.1. Telecom Service Providers
14.1.2. OEMs
14.1.3. EPC/Design Service Providers
14.2. Company Profiles (Details – Business Overview, Financials, Recent Developments, Strategy)
14.2.1. Telecom Service Providers
14.2.1.1.China Mobile Ltd.
14.2.1.2. Verizon Communications Inc.
14.2.1.3. AT&T Inc.
14.2.1.4.Vodafone Group plc
14.2.1.5. Nippon Telegraph & Telephone Corporation
14.2.1.6. Telefonica S.A.
14.2.1.7. America Movil
14.2.1.8.China Telecom
14.2.1.9.SoftBank
14.2.1.10. Deutsche Telekom
14.2.2. OEMs
14.2.2.1.Cisco Systems, Inc.
14.2.2.2.Nokia Corporation
14.2.2.3.Telefonaktiebolaget LM Ericsson
14.2.2.4.Fujitsu Ltd.
14.2.2.5.Huawei Technologies Co., Ltd.
14.2.2.6.ZTE Corporation
14.2.2.7.Samsung
14.2.2.8.Qualcomm Incorporated
14.2.2.9.NEC Corporation
14.2.3. EPC/Design Service Providers
14.2.3.1. Bechtel Corporation
14.2.3.2.Jacobs
14.2.3.3.Black & Veatch Holding Company
14.2.3.4.KCI Technologies
14.2.3.5.GPD Group
14.2.3.6.Morrison Hershfield
14.2.3.7.TECTONIC Engineering & Surveying Consultants P.C.
14.2.3.8.KLJ
14.2.3.9.Burns & McDonnell
15. Key Takeaways
List of Tables
Table 01: Global Telecom Service Provider Investment (CAPEX) Revenue (US$ Bn) Forecast, by Hardware, by Vendor Type, 2016 - 2026
Table 02: Global Telecom Service Provider Investment (CAPEX) (US$ Bn) Forecast, by Hardware, by Equipment Type, 2016 - 2026
Table 03: Global Telecom Service Provider Investment (CAPEX) (US$ Bn) Forecast, by Hardware, by Equipment , Telecom Hardware, 2016 - 2026
Table 04: Global Telecom Service Provider Investment (CAPEX) (US$ Bn) Forecast, by Services, 2016 - 2026
Table 05: Global Telecom Service Provider Investment (CAPEX) (US$ Bn) Forecast, by Network Type, 2016 - 2026
Table 06: Global Telecom Service Provider Investment (CAPEX) (US$ Bn) Forecast, by Region, 2016 - 2026
Table 07: North America Telecom Service Provider Investment (CAPEX) Revenue (US$ Bn) Forecast, by Hardware, by Vendor Type, 2016 - 2026
Table 08: North America Telecom Service Provider Investment (CAPEX) (US$ Bn) Forecast, by Hardware, by Equipment Type, 2016 - 2026
Table 09: North America Telecom Service Provider Investment (CAPEX) (US$ Bn) Forecast, by Hardware, by Equipment , Telecom Hardware, 2016 - 2026
Table 10: North America Telecom Service Provider Investment (CAPEX) (US$ Bn) Forecast, by Services, 2016 - 2026
Table 11: North America Telecom Service Provider Investment (CAPEX) (US$ Bn) Forecast, by Network Type, 2016 - 2026
Table 12: North America Telecom Service Provider Investment (CAPEX) (US$ Bn) Forecast, by Country, 2016 - 2026
Table 13: Europe Telecom Service Provider Investment (CAPEX) Revenue (US$ Bn) Forecast, by Hardware, by Vendor Type, 2016 - 2026
Table 14: Europe Telecom Service Provider Investment (CAPEX) (US$ Bn) Forecast, by Hardware, by Equipment Type, 2016 - 2026
Table 15: Europe Telecom Service Provider Investment (CAPEX) (US$ Bn) Forecast, by Hardware, by Equipment , Telecom Hardware, 2016 - 2026
Table 16: Europe Telecom Service Provider Investment (CAPEX) (US$ Bn) Forecast, by Services, 2016 - 2026
Table 17: Europe Telecom Service Provider Investment (CAPEX) (US$ Bn) Forecast, by Network Type, 2016 - 2026
Table 18: Europe Telecom Service Provider Investment (CAPEX) (US$ Bn) Forecast, by Country, 2016 - 2026
Table 19: Asia Pacific Telecom Service Provider Investment (CAPEX) Revenue (US$ Bn) Forecast, by Hardware, by Vendor Type, 2016 - 2026
Table 20: Asia Pacific Telecom Service Provider Investment (CAPEX) (US$ Bn) Forecast, by Hardware, by Equipment Type, 2016 - 2026
Table 21: Asia Pacific Telecom Service Provider Investment (CAPEX) (US$ Bn) Forecast, by Hardware, by Equipment , Telecom Hardware, 2016 - 2026
Table 22: Asia Pacific Telecom Service Provider Investment (CAPEX) (US$ Bn) Forecast, by Services, 2016 - 2026
Table 23: Asia Pacific Telecom Service Provider Investment (CAPEX) (US$ Bn) Forecast, by Network Type, 2016 - 2026
Table 24: Asia Pacific Telecom Service Provider Investment (CAPEX) (US$ Bn) Forecast, by Country, 2016 - 2026
Table 25: Middle East & Africa Telecom Service Provider Investment (CAPEX) Revenue (US$ Bn) Forecast, by Hardware, by Vendor Type, 2016 - 2026
Table 26: Middle East & Africa Telecom Service Provider Investment (CAPEX) (US$ Bn) Forecast, by Hardware, by Equipment Type, 2016 - 2026
Table 27: Middle East & Africa Telecom Service Provider Investment (CAPEX) (US$ Bn) Forecast, by Hardware, by Equipment , Telecom Hardware, 2016 - 2026
Table 28: Middle East & Africa Telecom Service Provider Investment (CAPEX) (US$ Bn) Forecast, by Services, 2016 - 2026
Table 29: Middle East & Africa Telecom Service Provider Investment (CAPEX) (US$ Bn) Forecast, by Network Type, 2016 - 2026
Table 30: Middle East & Africa Telecom Service Provider Investment (CAPEX) (US$ Bn) Forecast, by Country, 2016 - 2026
Table 31: South America Telecom Service Provider Investment (CAPEX) Revenue (US$ Bn) Forecast, by Hardware, by Vendor Type, 2016 - 2026
Table 32: South America Telecom Service Provider Investment (CAPEX) (US$ Bn) Forecast, by Hardware, by Equipment Type, 2016 - 2026
Table 33: South America Telecom Service Provider Investment (CAPEX) (US$ Bn) Forecast, by Hardware, by Equipment , Telecom Hardware, 2016 - 2026
Table 34: South America Telecom Service Provider Investment (CAPEX) (US$ Bn) Forecast, by Services, 2016 - 2026
Table 35: South America Telecom Service Provider Investment (CAPEX) (US$ Bn) Forecast, by Network Type, 2016 - 2026
Table 36: South America Telecom Service Provider Investment (CAPEX) (US$ Bn) Forecast, by Country, 2016 - 2026
List of Figures
Figure 01: Top Economies GDP Landscape
Figure 02: Global Telecom Service Provider Investment (CAPEX) Size (US$ Bn) Forecast, 2016 – 2026
Figure 03: Global Telecom Service Provider Investment (CAPEX) Y-o-Y Growth (Value %) Forecast, 2018 – 2026
Figure 04: Historic Growth Trends and Y – o – Y Growth, 2012-2017
Figure 05: Forecast Trends and Y – o – Y Growth, 2018-2026
Figure 06: Global Telecom Service Provider Investment (CAPEX) Attractiveness Analysis, by Hardware, by Vendor Type (2018)
Figure 07: Global Telecom Service Provider Investment (CAPEX) Attractiveness Analysis, by Hardware, by Equipment Type (2018)
Figure 08: Global Telecom Service Provider Investment (CAPEX) Attractiveness Analysis, by Services (2018)
Figure 09: Global Telecom Service Provider Investment (CAPEX) Attractiveness Analysis, by Network Type (2018)
Figure 10: Global Telecom Service Provider Investment (CAPEX) Attractiveness Analysis, by Region (2018)
Figure 11: Global Telecom Service Provider Investment (CAPEX) CAGR by Hardware, Vendor Type CAGR (%) (2018 – 2026)
Figure 12: Global Telecom Service Provider Investment (CAPEX) CAGR by Hardware, Equipment Type, CAGR (%) (2018 – 2026)
Figure 13: Global Telecom Service Provider Investment (CAPEX) CAGR by Services CAGR (%) (2018 – 2026)
Figure 14: Global Telecom Service Provider Investment (CAPEX) CAGR by Network Type CAGR (%) (2018 – 2026)
Figure 15: Global Telecom Service Provider Investment (CAPEX) CAGR by Region, CAGR (%) (2018 – 2026)
Figure 16: Global Telecom Service Provider Investment (CAPEX) Share Analysis, by Hardware, by Vendor Type (2018)
Figure 17: Global Telecom Service Provider Investment (CAPEX) Share Analysis, by Hardware, by Vendor Type(2026)
Figure 18: Global Telecom Service Provider Investment (CAPEX) Share Analysis, by Hardware, by Equipment Type (2018)
Figure 19: Global Telecom Service Provider Investment (CAPEX) Share Analysis, by Hardware, by Equipment Type (2026)
Figure 20: Global Telecom Service Provider Investment (CAPEX) Share Analysis, by Equipment, by Telecom Hardware (2018)
Figure 21: Global Telecom Service Provider Investment (CAPEX) Share Analysis, by Hardware, by Equipment Type, Telecom Hardware (2026)
Figure 22: Global Telecom Service Provider Investment (CAPEX) Share Analysis, by Services (2018)
Figure 23: Global Telecom Service Provider Investment (CAPEX) Share Analysis, by Services (2026)
Figure 24: Global Telecom Service Provider Investment (CAPEX) Share Analysis, by Services, Others (2018)
Figure 25: Global Telecom Service Provider Investment (CAPEX) Share Analysis, by Services, Others (2026)
Figure 26: Global Telecom Service Provider Investment (CAPEX) Share Analysis, by Network Type (2018)
Figure 27: Global Telecom Service Provider Investment (CAPEX) Share Analysis, by Network Type(2026)
Figure 28: Global Telecom Service Provider Investment (CAPEX) Share Analysis, by Region (2018)
Figure 29: Global Telecom Service Provider Investment (CAPEX)Market Share Analysis, by Region (2026)
Figure 30: North America Telecom Service Provider Investment (CAPEX) Size (US$ Bn) Forecast, 2016 – 2026
Figure 31: North America Telecom Service Provider Investment (CAPEX) Y-o-Y Growth (%) Forecast, 2017 – 2026
Figure 32: North America Telecom Service Provider Investment (CAPEX) Share Analysis, by Hardware, by Vendor Type (2018)
Figure 33: North America Telecom Service Provider Investment (CAPEX) Share Analysis, by Hardware, by Vendor Type(2026)
Figure 34: North America Telecom Service Provider Investment (CAPEX) Share Analysis, by Hardware, by Equipment Type (2018)
Figure 35: North America Telecom Service Provider Investment (CAPEX) Share Analysis, by Hardware, by Equipment Type (2018)
Figure 36: North America Telecom Service Provider Investment (CAPEX) Share Analysis, by Equipment, by Telecom Hardware (2018)
Figure 37: North America Telecom Service Provider Investment (CAPEX) Share Analysis, by Hardware, by Equipment Type, Telecom Hardware (2026)
Figure 38: North America Telecom Service Provider Investment (CAPEX) Share Analysis, by Services (2018)
Figure 39: North America Telecom Service Provider Investment (CAPEX) Share Analysis, by Services (2026)
Figure 40: North America Telecom Service Provider Investment (CAPEX) Share Analysis, by Services, Others (2018)
Figure 41: North America Telecom Service Provider Investment (CAPEX) Share Analysis, by Services, Others (2026)
Figure 42: North America Telecom Service Provider Investment (CAPEX) Share Analysis, by Network Type (2018)
Figure 43: North America Telecom Service Provider Investment (CAPEX) Share Analysis, by Network Type(2026)
Figure 44: North America Telecom Service Provider Investment (CAPEX) Share Analysis, by Country (2018)
Figure 45: North America Telecom Service Provider Investment (CAPEX) Share Analysis, by Country (2026)
Figure 46: North America Telecom Service Provider Investment (CAPEX) Attractiveness Analysis, by Hardware, by Vendor Type (2018)
Figure 47: North America Telecom Service Provider Investment (CAPEX) Attractiveness Analysis, by Hardware, by Equipment Type (2018)
Figure 48: North America Telecom Service Provider Investment (CAPEX) Attractiveness Analysis, by Services (2018)
Figure 49: North America Telecom Service Provider Investment (CAPEX) Attractiveness Analysis, by Network Type (2018)
Figure 50: North America Telecom Service Provider Investment (CAPEX) Attractiveness Analysis, by Country (2018)
Figure 51: Europe Telecom Service Provider Investment (CAPEX) (US$ Bn) Forecast, 2016 – 2026
Figure 52: Europe Telecom Service Provider Investment (CAPEX) Y-o-Y Growth (%) Forecast, 2017 – 2026
Figure 53: Europe Telecom Service Provider Investment (CAPEX) Share Analysis, by Hardware, by Vendor Type (2018)
Figure 54: Europe Telecom Service Provider Investment (CAPEX) Share Analysis, by Hardware, by Vendor Type(2026)
Figure 55: Europe Telecom Service Provider Investment (CAPEX) Share Analysis, by Hardware, by Equipment Type (2018)
Figure 56: Europe Telecom Service Provider Investment (CAPEX) Share Analysis, by Hardware, by Equipment Type (2018)
Figure 57: Europe Telecom Service Provider Investment (CAPEX) Share Analysis, by Equipment, by Telecom Hardware (2018)
Figure 58: Europe Telecom Service Provider Investment (CAPEX) Share Analysis, by Hardware, by Equipment Type, Telecom Hardware (2026)
Figure 59: Europe Telecom Service Provider Investment (CAPEX) Share Analysis, by Services (2018)
Figure 60: Europe Telecom Service Provider Investment (CAPEX) Share Analysis, by Services (2026)
Figure 61: Europe Telecom Service Provider Investment (CAPEX) Share Analysis, by Services, Others (2018)
Figure 62: Europe Telecom Service Provider Investment (CAPEX) Share Analysis, by Services, Others (2026)
Figure 63: Europe Telecom Service Provider Investment (CAPEX) Share Analysis, by Network Type (2018)
Figure 64: Europe Telecom Service Provider Investment (CAPEX) Share Analysis, by Network Type(2026)
Figure 65: Europe Telecom Service Provider Investment (CAPEX) Share Analysis, by Country (2018)
Figure 66: Europe Telecom Service Provider Investment (CAPEX) Share Analysis, by Country (2026)
Figure 67: Europe Telecom Service Provider Investment (CAPEX) Attractiveness Analysis, by Hardware, by Vendor Type (2018)
Figure 68: Europe Telecom Service Provider Investment (CAPEX) Attractiveness Analysis, by Hardware, by Equipment Type (2018)
Figure 69: Europe Telecom Service Provider Investment (CAPEX) Attractiveness Analysis, by Services (2018)
Figure 70: Europe Telecom Service Provider Investment (CAPEX) Attractiveness Analysis, by Network Type (2018)
Figure 71: Europe Telecom Service Provider Investment (CAPEX) Attractiveness Analysis, by Country (2018)
Figure 72: Asia Pacific Telecom Service Provider Investment (CAPEX) (US$ Bn) Forecast, 2016 – 2026
Figure 73: Asia Pacific Telecom Service Provider Investment (CAPEX) Y-o-Y Growth (%) Forecast, 2017 – 2026
Figure 74: Asia Pacific Telecom Service Provider Investment (CAPEX) Share Analysis, by Hardware, by Vendor Type (2018)
Figure 75: Asia Pacific Telecom Service Provider Investment (CAPEX) Share Analysis, by Hardware, by Vendor Type(2026)
Figure 76: Asia Pacific Telecom Service Provider Investment (CAPEX) Share Analysis, by Hardware, by Equipment Type (2018)
Figure 77: Asia Pacific Telecom Service Provider Investment (CAPEX) Share Analysis, by Hardware, by Equipment Type (2018)
Figure 78: Asia Pacific Telecom Service Provider Investment (CAPEX) Share Analysis, by Equipment, by Telecom Hardware (2018)
Figure 79: Asia Pacific Telecom Service Provider Investment (CAPEX) Share Analysis, by Hardware, by Equipment Type, Telecom Hardware (2026)
Figure 80: Asia Pacific Telecom Service Provider Investment (CAPEX) Share Analysis, by Services (2018)
Figure 81: Asia Pacific Telecom Service Provider Investment (CAPEX) Share Analysis, by Services (2026)
Figure 82: Asia Pacific Telecom Service Provider Investment (CAPEX) Share Analysis, by Services, Others (2018)
Figure 83: Asia Pacific Telecom Service Provider Investment (CAPEX) Share Analysis, by Services, Others (2026)
Figure 84: Asia Pacific Telecom Service Provider Investment (CAPEX) Share Analysis, by Network Type (2018)
Figure 85: Asia Pacific Telecom Service Provider Investment (CAPEX) Share Analysis, by Network Type(2026)
Figure 86: Asia Pacific Telecom Service Provider Investment (CAPEX) Share Analysis, by Country (2018)
Figure 87: Asia Pacific Telecom Service Provider Investment (CAPEX) Share Analysis, by Country (2026)
Figure 88: Asia Pacific Telecom Service Provider Investment (CAPEX) Attractiveness Analysis, by Hardware, by Vendor Type (2018)
Figure 89: Asia Pacific Telecom Service Provider Investment (CAPEX) Attractiveness Analysis, by Hardware, by Equipment Type (2018)
Figure 90: Asia Pacific Telecom Service Provider Investment (CAPEX) Attractiveness Analysis, by Services (2018)
Figure 91: Asia Pacific Telecom Service Provider Investment (CAPEX) Attractiveness Analysis, by Network Type (2018)
Figure 92: Asia Pacific Telecom Service Provider Investment (CAPEX) Attractiveness Analysis, by Country (2018)
Figure 93: Middle East & Africa Telecom Service Provider Investment (CAPEX) (US$ Bn) Forecast, 2016 – 2026
Figure 94: Middle East & Africa Telecom Service Provider Investment (CAPEX) Y-o-Y Growth (%) Forecast, 2017 – 2026
Figure 95: Middle East & Africa Telecom Service Provider Investment (CAPEX) Share Analysis, by Hardware, by Vendor Type (2018)
Figure 96: Middle East & Africa Telecom Service Provider Investment (CAPEX) Share Analysis, by Hardware, by Vendor Type(2026)
Figure 97: Middle East & Africa Telecom Service Provider Investment (CAPEX) Share Analysis, by Hardware, by Equipment Type (2018)
Figure 98: Middle East & Africa Telecom Service Provider Investment (CAPEX) Share Analysis, by Hardware, by Equipment Type (2018)
Figure 99: Middle East & Africa Telecom Service Provider Investment (CAPEX) Share Analysis, by Equipment, by Telecom Hardware (2018)
Figure 100: Middle East & Africa Telecom Service Provider Investment (CAPEX) Share Analysis, by Hardware, by Equipment Type, Telecom Hardware (2026)
Figure 101: Middle East & Africa Telecom Service Provider Investment (CAPEX) Share Analysis, by Services (2018)
Figure 102: Middle East & Africa Telecom Service Provider Investment (CAPEX) Share Analysis, by Services (2026)
Figure 103: Middle East & Africa Telecom Service Provider Investment (CAPEX) Share Analysis, by Services, Others (2018)
Figure 104: Middle East & Africa Telecom Service Provider Investment (CAPEX) Share Analysis, by Services, Others (2026)
Figure 105: Middle East & Africa Telecom Service Provider Investment (CAPEX) Share Analysis, by Network Type (2018)
Figure 106: Middle East & Africa Telecom Service Provider Investment (CAPEX) Share Analysis, by Network Type(2026)
Figure 107: Middle East & Africa Telecom Service Provider Investment (CAPEX) Share Analysis, by Country (2018)
Figure 108: Middle East & Africa Telecom Service Provider Investment (CAPEX) Share Analysis, by Country (2026)
Figure 109: Middle East & Africa Telecom Service Provider Investment (CAPEX) Attractiveness Analysis, by Hardware, by Vendor Type (2018)
Figure 110: Middle East & Africa Telecom Service Provider Investment (CAPEX) Attractiveness Analysis, by Hardware, by Equipment Type (2018)
Figure 111: Middle East & Africa Telecom Service Provider Investment (CAPEX) Attractiveness Analysis, by Services (2018)
Figure 112: Middle East & Africa Telecom Service Provider Investment (CAPEX) Attractiveness Analysis, by Network Type (2018)
Figure 113: Middle East & Africa Telecom Service Provider Investment (CAPEX) Attractiveness Analysis, by Country (2018)
Figure 114: South America Telecom Service Provider Investment (CAPEX) (US$ Bn) Forecast, 2016 – 2026
Figure 115: South America Telecom Service Provider Investment (CAPEX) Y-o-Y Growth (%) Forecast, 2017 – 2026
Figure 116: South America Telecom Service Provider Investment (CAPEX) Share Analysis, by Hardware, by Vendor Type (2018)
Figure 117: South America Telecom Service Provider Investment (CAPEX) Share Analysis, by Hardware, by Vendor Type(2026)
Figure 118: South America Telecom Service Provider Investment (CAPEX) Share Analysis, by Hardware, by Equipment Type (2018)
Figure 119: South America Telecom Service Provider Investment (CAPEX) Share Analysis, by Hardware, by Equipment Type (2018)
Figure 120: South America Telecom Service Provider Investment (CAPEX) Share Analysis, by Equipment, by Telecom Hardware (2018)
Figure 121: South America Telecom Service Provider Investment (CAPEX) Share Analysis, by Hardware, by Equipment Type, Telecom Hardware (2026)
Figure 122: South America Telecom Service Provider Investment (CAPEX) Share Analysis, by Services (2018)
Figure 123: South America Telecom Service Provider Investment (CAPEX) Share Analysis, by Services (2026)
Figure 124: South America Telecom Service Provider Investment (CAPEX) Share Analysis, by Services, Others (2018)
Figure 125: South America Telecom Service Provider Investment (CAPEX) Share Analysis, by Services, Others (2026)
Figure 126: South America Telecom Service Provider Investment (CAPEX) Share Analysis, by Network Type (2018)
Figure 127: South America Telecom Service Provider Investment (CAPEX) Share Analysis, by Network Type(2026)
Figure 128: South America Telecom Service Provider Investment (CAPEX) Share Analysis, by Country (2018)
Figure 129: South America Telecom Service Provider Investment (CAPEX) Share Analysis, by Country (2026)
Figure 130: South America Telecom Service Provider Investment (CAPEX) Attractiveness Analysis, by Hardware, by Vendor Type (2018)
Figure 131: South America Telecom Service Provider Investment (CAPEX) Attractiveness Analysis, by Hardware, by Equipment Type (2018)
Figure 132: South America Telecom Service Provider Investment (CAPEX) Attractiveness Analysis, by Services (2018)
Figure 133: South America Telecom Service Provider Investment (CAPEX) Attractiveness Analysis, by Network Type (2018)
Figure 134: South America Telecom Service Provider Investment (CAPEX) Attractiveness Analysis, by Country (2018)
Copyright © Transparency Market Research, Inc. All Rights reserved
Trust Online

Telecom Service Provider Investment (CAPEX) Analysis Market