
Reports
Reports
Analysts’ Viewpoint on Sulfur Market for Mining Application Scenario
Sulfur is extensively used in metal and coal mining industries. Explosives used in coal mines and exploration and refinement of precious metals are the two primary applications of sulfur in mining. Exploration of gold deposits is likely to offer lucrative opportunities to manufacturers of sulfur. Sulfur producers are focusing on expanding their distribution channel by including new stakeholders/independent distributors in geographies where mining activities are increasing. Mining presents considerable environmental difficulties, making it a target for stringent regulations and laws. These restrictions may also raise the time, costs, and hazards associated with opening and operating mines. Manufacturers are also focusing on producing sulfur-based derivatives in order to cater to its emerging demand in mining applications.
Sulfur attaches to metal ions, creating several significant sulfide ore minerals such as galena (lead sulfide), pyrite (iron sulfide), chalcocite (copper sulfide), and sphalerite (zinc sulfide). Mined sulfur is mostly derived from salt domes or bedded deposits. A vast majority is produced as a by-product of oil refining and natural gas processing. Three different mining techniques are employed in sulfur mining & processing: conventional underground method, conventional open-pit method, and the Frasch mining (or underground melting) method. In the Frasch process, hot water is forced into the sulfur deposit. The sulfur melts and is pushed to the surface, where it is collected and allowed to cool and solidify, or shipped in molten form.
Metallic forms of gold and other precious metals can be dissolved and transported (mined) using an aqueous sulfide-bearing leach solution. Maximum sulfur fugacities are obtained in sulfide-bearing solutions with approximately neutral pH and relatively reducing conditions. The ideal chemical conditions are obtained by heating aqueous sulfide solutions, such as NaHS, Na2S, H2S, (NH)4S, or other suitable forms, to temperatures of at least about 100°C in the presence of excess elemental sulfur. Sulfide dissociates in the solution to form aqueous sulfide species such as polysulfide and HS, which lixiviate gold and other precious metals.
Bisulfide- and polysulfide-based ligands are used to dissolve and transport precious metals for mining, as sulfide-based ligands are highly effective at dissolving and transporting precious metals. Presence of elemental sulfur maintains the sulfur fugacity at its highest possible level and also helps buffer the pH and Eh ((oxidation potential) at optimal levels for maximizing gold solubility. Sulfur-based chemicals are used in mining to control and maintain chemical conditions in the ore matrix at optimum leaching conditions. Elevated temperature solutions are used for precious metal mining.
Sulfur mining and processing is critical to modern life, as it provides raw materials that underpin modern society. They are also crucial in efforts to meet the UN Sustainable Development Goals. Metal mining provides the elements required for diverse applications and services in various sectors such as energy, communication, and transportation. Metals are classified into two categories: precious metals and industrial metals. Precious metals include gold, platinum, and silver. Precious metals are considered to be rare and have a high economic value associated with them. Precious metals also derive their value from what they are used for, such as gold, which is considered a safe haven investment. Some precious metals are used in industrial and manufacturing processes.
Sulfur is widely employed as an explosive in coal mining due to its significant properties such as detonation velocity, density, detonation pressure, water resistance, and fume class. Sulfur is commonly used as a fuel component in inorganic explosive mixtures such as black powder, flash powder, and a variety of black powder substitutes. Sulfur makes the powder burn faster and also lowers the ignition temperature, which increases the combustion rate.
Global coal output increased by 5.7% in 2021 (just above the pre-pandemic level in 2019), following the rebound in coal demand. Coal production in Europe rose by 11.9% in 2021, while it increased by 8% in North America. Coal producing nations in Asia accounted for nearly 70% of the total global coal output in 2021. Demand for sulfur-based explosives is expected to remain high during the forecast period owing to its specific applications in coal production.
Based on process, the global sulfur market for mining application market has been split into Frasch, Claus, and others. The Frasch process segment is expected to hold 90% share of the global market in 2021. It is anticipated to grow at a CAGR of 6.9% by 2031. The Frasch process, which takes advantage of the low melting point of sulfur (112 °C), makes sulfur of a high purity (up to 99.9% pure) available in large quantities and helps establish sulfur mining and processing as an important basic chemical commodity. Therefore, high demand for Frasch process is projected to drive the sulfur market for mining application in the near future.
In terms of value, Asia Pacific dominated the global sulfur market for mining application with 56.3% share in 2021. The region is estimated to hold 60.5% share by 2031, growing at a CAGR of 7.3% during he forecast period.
Latin America held 15.3% share of the global sulfur market for mining application in 2021. The region is projected to account for 14.4% share of the global market by 2031. In terms of revenue, the market in Latin America is likely to grow at a 6.1% CAGR during the forecast period.
The global sulfur market for mining application is fragmented, with a large number of small and medium-scale vendors controlling a majority of the share. Most of the firms are investing substantially in comprehensive research and development activities. Expansion of product portfolios and mergers and acquisitions are prominent strategies adopted by key players. Leading sulfur for mining application companies include Reliance Industries Ltd., China Petroleum and Chemical Corporation, Gazprom, and Shikoku Chemicals Corporation.
Each of these players has been profiled in the sulfur market for mining application market report based on parameters such as company overview, financial overview, business strategies, product portfolio, business segments, and recent developments.
|
Attribute |
Detail |
|
Market Forecast Value in 2021 |
US$ 1 Bn |
|
Market Forecast Value in 2031 |
US$ 1.8 Bn |
|
Growth Rate (CAGR) |
6.6% |
|
Forecast Period |
2022–2031 |
|
Historical Data |
2020 |
|
Quantitative Units |
US$ Bn for Value & Kilo Tons for Volume |
|
Market Analysis |
It includes cross segment analysis at global as well as regional level. Furthermore, qualitative analysis includes drivers, restraints, opportunities, key trends, Porter’s Five Forces analysis, value chain analysis, and key trend analysis. |
|
Competition Landscape |
|
|
Format |
Electronic (PDF) + Excel |
|
Market Segmentation |
|
|
Regions Covered |
|
|
Countries Covered |
|
|
Companies Profiled |
|
|
Customization Scope |
Available upon request |
|
Pricing |
Available upon request |
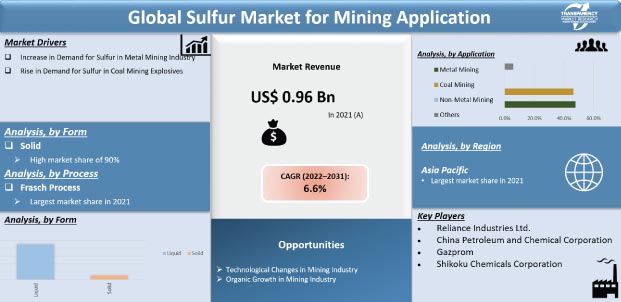
The market stood at US$ 0.96 Bn in 2021
The market is expected to grow at a CAGR of 6.6% from 2022 to 2031
Increase in demand for sulfur in metal mining industry and rise in demand in coal mining explosives
Frasch process was the largest segment that held 90% share, in terms of value, in 2021
Asia Pacific was the most lucrative region of the sulfur market for mining application in 2021
Reliance Industries Ltd., China Petroleum and Chemical Corporation, Gazprom, and Shikoku Chemicals Corporation
1. Executive Summary
1.1. Sulfur Market for Mining Application Snapshot
1.2. Current Market and Future Potential
2. Market Overview
2.1. Market Segmentation
2.2. Market Trends
2.3. Market Dynamics
2.3.1. Drivers
2.3.2. Restraints
2.3.3. Opportunities
2.4. Porter’s Five Forces Analysis
2.5. Regulatory Analysis
2.6. Value Chain Analysis
2.6.1. List of Sulfur Market for Mining Application Manufacturers
2.6.2. List of Potential Customer
3. COVID-19 Impact Analysis
4. Global Sulfur Market for Mining Application Analysis and Forecast, by Form, 2020–2031
4.1. Introduction and Definitions
4.2. Global Sulfur Market for Mining Application Volume (Kilo Tons) and Value (US$ Mn) Forecast, by Form, 2020–2031
4.2.1. Liquid
4.2.2. Solid
4.3. Global Sulfur Market for Mining Application Attractiveness, by Form
5. Global Sulfur Market for Mining Application Analysis and Forecast, by Process, 2020–2031
5.1. Introduction and Definitions
5.2. Global Sulfur Market for Mining Application Volume (Kilo Tons) and Value (US$ Mn) Forecast, by Process, 2020–2031
5.2.1. Frasch Process
5.2.2. Claus Process
5.2.3. Others
5.3. Global Sulfur Market for Mining Application Attractiveness, by Process
6. Global Sulfur Market for Mining Application Analysis and Forecast, Application, 2020–2031
6.1. Introduction and Definitions
6.2. Global Sulfur Market for Mining Application Volume (Kilo Tons) and Value (US$ Mn) Forecast, by Application, 2020–2031
6.2.1.1. Metal Mining
6.2.1.2. Coal Mining
6.2.1.3. Non-Metal Mining
6.2.1.4. Others
6.3. Global Sulfur Market for Mining Application Attractiveness, by Application
7. Global Sulfur Market for Mining Application Analysis and Forecast, by Region, 2020–2031
7.1. Key Findings
7.2. Global Sulfur Market for Mining Application Volume (Kilo Tons) and Value (US$ Mn) Forecast, by Region, 2020–2031
7.2.1. North America
7.2.2. Europe
7.2.3. Asia Pacific
7.2.4. Latin America
7.2.5. Middle East & Africa
7.3. Global Sulfur Market for Mining Application Attractiveness, by Region
8. North America Sulfur Market for Mining Application Analysis and Forecast, 2020–2031
8.1. Key Findings
8.2. North America Sulfur Market for Mining Application Volume (Kilo Tons) and Value (US$ Mn) Forecast, by Form, 2020–2031
8.3. North America Sulfur Market for Mining Application Volume (Kilo Tons) and Value (US$ Mn) Forecast, by Process, 2020–2031
8.4. North America Sulfur Market for Mining Application Volume (Kilo Tons) and Value (US$ Mn) Forecast, by Application, 2020–2031
8.5. North America Sulfur Market for Mining Application Volume (Kilo Tons) and Value (US$ Mn) Forecast, by Country, 2020–2031
8.5.1. U.S. Sulfur Market for Mining Application Volume (Kilo Tons) and Value (US$ Mn) Forecast, by Form, 2020–2031
8.5.2. U.S. Sulfur Market for Mining Application Volume (Kilo Tons) and Value (US$ Mn) Forecast, by Process, 2020–2031
8.5.3. U.S. Sulfur Market for Mining Application Volume (Kilo Tons) and Value (US$ Mn) Forecast, by Application, 2020–2031
8.5.4. Canada Sulfur Market for Mining Application Volume (Kilo Tons) and Value (US$ Mn) Forecast, by Form, 2020–2031
8.5.5. Canada Sulfur Market for Mining Application Volume (Kilo Tons) and Value (US$ Mn) Forecast, by Process, 2020–2031
8.5.6. Canada Sulfur Market for Mining Application Volume (Kilo Tons) and Value (US$ Mn) Forecast, by Application, 2020–2031
8.6. North America Sulfur Market for Mining Application Attractiveness Analysis
9. Europe Sulfur Market for Mining Application Analysis and Forecast, 2020–2031
9.1. Key Findings
9.2. Europe Sulfur Market for Mining Application Volume (Kilo Tons) and Value (US$ Mn) Forecast, by Form, 2020–2031
9.3. Europe Sulfur Market for Mining Application Volume (Kilo Tons) and Value (US$ Mn) Forecast, by Process, 2020–2031
9.4. Europe Sulfur Market for Mining Application Volume (Kilo Tons) and Value (US$ Mn) Forecast, by Application, 2020–2031
9.5. Europe Sulfur Market for Mining Application Volume (Kilo Tons) and Value (US$ Mn) Forecast, by Country and Sub-region, 2021-2031
9.5.1. Germany Sulfur Market for Mining Application Volume (Kilo Tons) and Value (US$ Mn) Forecast, by Form, 2020–2031
9.5.2. Germany Sulfur Market for Mining Application Volume (Kilo Tons) and Value (US$ Mn) Forecast, by Process, 2020–2031
9.5.3. Germany Sulfur Market for Mining Application Volume (Kilo Tons) and Value (US$ Mn) Forecast, by Application, 2020–2031
9.5.4. France Sulfur Market for Mining Application Volume (Kilo Tons) and Value (US$ Mn) Forecast, by Form, 2020–2031
9.5.5. France Sulfur Market for Mining Application Volume (Kilo Tons) and Value (US$ Mn) Forecast, by Process, 2020–2031
9.5.6. France Sulfur Market for Mining Application Volume (Kilo Tons) and Value (US$ Mn) Forecast, by Application, 2020–2031
9.5.7. U.K. Sulfur Market for Mining Application Volume (Kilo Tons) and Value (US$ Mn) Forecast, by Form, 2020–2031
9.5.8. U.K. Sulfur Market for Mining Application Volume (Kilo Tons) and Value (US$ Mn) Forecast, by Process, 2020–2031
9.5.9. U.K. Sulfur Market for Mining Application Volume (Kilo Tons) and Value (US$ Mn) Forecast, by Application, 2020–2031
9.5.10. Italy Sulfur Market for Mining Application Volume (Kilo Tons) and Value (US$ Mn) Forecast, by Form, 2020–2031
9.5.11. Italy. Sulfur Market for Mining Application Volume (Kilo Tons) and Value (US$ Mn) Forecast, by Process, 2020–2031
9.5.12. Italy Sulfur Market for Mining Application Volume (Kilo Tons) and Value (US$ Mn) Forecast, by Application, 2020–2031
9.5.13. Russia & CIS Sulfur Market for Mining Application Volume (Kilo Tons) and Value (US$ Mn) Forecast, by Form, 2020–2031
9.5.14. Russia & CIS Sulfur Market for Mining Application Volume (Kilo Tons) and Value (US$ Mn) Forecast, by Process, 2020–2031
9.5.15. Russia & CIS Sulfur Market for Mining Application Volume (Kilo Tons) and Value (US$ Mn) Forecast, by Application, 2020–2031
9.5.16. Rest of Europe Sulfur Market for Mining Application Volume (Kilo Tons) and Value (US$ Mn) Forecast, by Form, 2020–2031
9.5.17. Rest of Europe Sulfur Market for Mining Application Volume (Kilo Tons) and Value (US$ Mn) Forecast, by Process, 2020–2031
9.5.18. Rest of Europe Sulfur Market for Mining Application Volume (Kilo Tons) and Value (US$ Mn) Forecast, by Application, 2020–2031
9.6. Europe Sulfur Market for Mining Application Attractiveness Analysis
10. Asia Pacific Sulfur Market for Mining Application Analysis and Forecast, 2020–2031
10.1. Key Findings
10.2. Asia Pacific Sulfur Market for Mining Application Volume (Kilo Tons) and Value (US$ Mn) Forecast, by Form
10.3. Asia Pacific Sulfur Market for Mining Application Volume (Kilo Tons) and Value (US$ Mn) Forecast, by Process, 2020–2031
10.4. Asia Pacific Sulfur Market for Mining Application Volume (Kilo Tons) and Value (US$ Mn) Forecast, by Application, 2020–2031
10.5. Asia Pacific Sulfur Market for Mining Application Volume (Kilo Tons) and Value (US$ Mn) Forecast, by Country and Sub-region, 2021-2031
10.5.1. China Sulfur Market for Mining Application Volume (Kilo Tons) and Value (US$ Mn) Forecast, by Form, 2020–2031
10.5.2. China Sulfur Market for Mining Application Volume (Kilo Tons) and Value (US$ Mn) Forecast, by Process, 2020–2031
10.5.3. China Sulfur Market for Mining Application Volume (Kilo Tons) and Value (US$ Mn) Forecast, by Application, 2020–2031
10.5.4. Japan Sulfur Market for Mining Application Volume (Kilo Tons) and Value (US$ Mn) Forecast, by Form, 2020–2031
10.5.5. Japan Sulfur Market for Mining Application Volume (Kilo Tons) and Value (US$ Mn) Forecast, by Process, 2020–2031
10.5.6. Japan Sulfur Market for Mining Application Volume (Kilo Tons) and Value (US$ Mn) Forecast, by Application, 2020–2031
10.5.7. India Sulfur Market for Mining Application Volume (Kilo Tons) and Value (US$ Mn) Forecast, by Form, 2020–2031
10.5.8. India Sulfur Market for Mining Application Volume (Kilo Tons) and Value (US$ Mn) Forecast, by Process, 2020–2031
10.5.9. India Sulfur Market for Mining Application Volume (Kilo Tons) and Value (US$ Mn) Forecast, by Application, 2020–2031
10.5.10. ASEAN Sulfur Market for Mining Application Volume (Kilo Tons) and Value (US$ Mn) Forecast, by Form, 2020–2031
10.5.11. ASEAN Sulfur Market for Mining Application Volume (Kilo Tons) and Value (US$ Mn) Forecast, by Process, 2020–2031
10.5.12. ASEAN Sulfur Market for Mining Application Volume (Kilo Tons) and Value (US$ Mn) Forecast, by Application, 2020–2031
10.5.13. Rest of Asia Pacific Sulfur Market for Mining Application Volume (Kilo Tons) and Value (US$ Mn) Forecast, by Form, 2020–2031
10.5.14. Rest of Asia Pacific Sulfur Market for Mining Application Volume (Kilo Tons) and Value (US$ Mn) Forecast, by Process, 2020–2031
10.5.15. Rest of Asia Pacific Sulfur Market for Mining Application Volume (Kilo Tons) and Value (US$ Mn) Forecast, by Application, 2020–2031
10.6. Asia Pacific Sulfur Market for Mining Application Attractiveness Analysis
11. Latin America Sulfur Market for Mining Application Analysis and Forecast, 2020–2031
11.1. Key Findings
11.2. Latin America Sulfur Market for Mining Application Volume (Kilo Tons) and Value (US$ Mn) Forecast, by Form, 2020–2031
11.3. Latin America Sulfur Market for Mining Application Volume (Kilo Tons) and Value (US$ Mn) Forecast, by Process, 2020–2031
11.4. Latin America Sulfur Market for Mining Application Volume (Kilo Tons) and Value (US$ Mn) Forecast, by Application, 2020–2031
11.5. Latin America Sulfur Market for Mining Application Volume (Kilo Tons) and Value (US$ Mn) Forecast, by Country and Sub-region, 2021-2031
11.5.1. Brazil Sulfur Market for Mining Application Volume (Kilo Tons) and Value (US$ Mn) Forecast, by Form, 2020–2031
11.5.2. Brazil Sulfur Market for Mining Application Volume (Kilo Tons) and Value (US$ Mn) Forecast, by Process, 2020–2031
11.5.3. Brazil Sulfur Market for Mining Application Volume (Kilo Tons) and Value (US$ Mn) Forecast, by Application, 2020–2031
11.5.4. Mexico Sulfur Market for Mining Application Volume (Kilo Tons) and Value (US$ Mn) Forecast, by Form, 2020–2031
11.5.5. Mexico Sulfur Market for Mining Application Volume (Kilo Tons) and Value (US$ Mn) Forecast, by Process, 2020–2031
11.5.6. Mexico Sulfur Market for Mining Application Volume (Kilo Tons) and Value (US$ Mn) Forecast, by Application, 2020–2031
11.5.7. Rest of Latin America Sulfur Market for Mining Application Volume (Kilo Tons) and Value (US$ Mn) Forecast, by Form, 2020–2031
11.5.8. Rest of Latin America Sulfur Market for Mining Application Volume (Kilo Tons) and Value (US$ Mn) Forecast, by Process, 2020–2031
11.5.9. Rest of Latin America Sulfur Market for Mining Application Volume (Kilo Tons) and Value (US$ Mn) Forecast, by Application, 2020–2031
11.6. Latin America Sulfur Market for Mining Application Attractiveness Analysis
12. Middle East & Africa Sulfur Market for Mining Application Analysis and Forecast, 2020–2031
12.1. Key Findings
12.2. Middle East & Africa Sulfur Market for Mining Application Volume (Kilo Tons) and Value (US$ Mn) Forecast, by Form, 2020–2031
12.3. Middle East & Africa Sulfur Market for Mining Application Volume (Kilo Tons) and Value (US$ Mn) Forecast, by Process, 2020–2031
12.4. Middle East & Africa Sulfur Market for Mining Application Volume (Kilo Tons) and Value (US$ Mn) Forecast, by Application, 2020–2031
12.5. Middle East & Africa Sulfur Market for Mining Application Volume (Kilo Tons) and Value (US$ Mn) Forecast, by Country and Sub-region, 2021-2031
12.5.1. GCC Sulfur Market for Mining Application Volume (Kilo Tons) and Value (US$ Mn) Forecast, by Form, 2020–2031
12.5.2. GCC Sulfur Market for Mining Application Volume (Kilo Tons) and Value (US$ Mn) Forecast, by Process, 2020–2031
12.5.3. GCC Sulfur Market for Mining Application Volume (Kilo Tons) and Value (US$ Mn) Forecast, by Application, 2020–2031
12.5.4. South Africa Sulfur Market for Mining Application Volume (Kilo Tons) and Value (US$ Mn) Forecast, by Form, 2020–2031
12.5.5. South Africa Sulfur Market for Mining Application Volume (Kilo Tons) and Value (US$ Mn) Forecast, by Process, 2020–2031
12.5.6. South Africa Sulfur Market for Mining Application Volume (Kilo Tons) and Value (US$ Mn) Forecast, by Application, 2020–2031
12.5.7. Rest of Middle East & Africa Sulfur Market for Mining Application Volume (Kilo Tons) and Value (US$ Mn) Forecast, by Form, 2020–2031
12.5.8. Rest of Middle East & Africa Sulfur Market for Mining Application Volume (Kilo Tons) and Value (US$ Mn) Forecast, by Process, 2020–2031
12.5.9. Rest of Middle East & Africa Sulfur Market for Mining Application Volume (Kilo Tons) and Value (US$ Mn) Forecast, by Application, 2020–2031
12.6. Middle East & Africa Sulfur Market for Mining Application Attractiveness Analysis
13. Competition Landscape
13.1. Global Sulfur Market for Mining Application Company Market Share Analysis, 2021
13.2. Company Profiles (Details – Overview, Financials, Recent Developments, and Strategy)
13.2.1. Shell Plc
13.2.1.1. Company Description
13.2.1.2. Business Overview
13.2.1.3. Financial Overview
13.2.1.4. Strategic Overview
13.2.2. Reliance Industries Ltd.
13.2.2.1. Company Description
13.2.2.2. Business Overview
13.2.2.3. Financial Overview
13.2.2.4. Strategic Overview
13.2.3. China Petroleum and Chemical Corporation
13.2.3.1. Company Description
13.2.3.2. Business Overview
13.2.3.3. Financial Overview
13.2.3.4. Strategic Overview
13.2.4. Gazprom
13.2.4.1. Company Description
13.2.4.2. Business Overview
13.2.4.3. Financial Overview
13.2.4.4. Strategic Overview
13.2.5. Shikoku Chemicals Corporation
13.2.5.1. Company Description
13.2.5.2. Business Overview
13.2.5.3. Financial Overview
13.2.5.4. Strategic Overview
13.2.6. Abu Dhabi National Oil Company
13.2.6.1. Company Description
13.2.6.2. Business Overview
13.2.6.3. Financial Overview
13.2.6.4. Strategic Overview
13.2.7. Saudi Arabian Oil Co
13.2.7.1. Company Description
13.2.7.2. Business Overview
13.2.7.3. Financial Overview
13.2.7.4. Strategic Overview
13.2.8. Tengigchevroil LLC
13.2.8.1. Company Description
13.2.8.2. Business Overview
13.2.8.3. Financial Overview
13.2.8.4. Strategic Overview
13.2.9. Eastman Chemical Company
13.2.9.1. Company Description
13.2.9.2. Business Overview
13.2.9.3. Financial Overview
13.2.9.4. Strategic Overview
13.2.10. Miwon Commercial Co. Ltd
13.2.10.1. Company Description
13.2.10.2. Business Overview
13.2.10.3. Financial Overview
13.2.10.4. Strategic Overview
14. Primary Research: Key Insights
15. Appendix
List of Tables
Table 1: Global Sulfur Market for Mining Application Volume (Kilo Tons) Forecast, by Form, 2020–2031
Table 2: Global Sulfur Market for Mining Application Value (US$ Mn) Forecast, by Form, 2020–2031
Table 3: Global Sulfur Market for Mining Application Volume (Kilo Tons) Forecast, by Process, 2020–2031
Table 4: Global Sulfur Market for Mining Application Value (US$ Mn) Forecast, by Process, 2020–2031
Table 5: Global Sulfur Market for Mining Application Volume (Kilo Tons) Forecast, by Application, 2020–2031
Table 6: Global Sulfur Market for Mining Application Value (US$ Mn) Forecast, by Application, 2020–2031
Table 7: Global Sulfur Market for Mining Application Volume (Kilo Tons) Forecast, by Region, 2020–2031
Table 8: Global Sulfur Market for Mining Application Value (US$ Mn) Forecast, by Region, 2020–2031
Table 9: North America Sulfur Market for Mining Application Volume (Kilo Tons) Forecast, by Form, 2020–2031
Table 10: North America Sulfur Market for Mining Application Value (US$ Mn) Forecast, by Form, 2020–2031
Table 11: North America Sulfur Market for Mining Application Volume (Kilo Tons) Forecast, by Process, 2020–2031
Table 12: North America Sulfur Market for Mining Application Value (US$ Mn) Forecast, by Process, 2020–2031
Table 13: North America Sulfur Market for Mining Application Volume (Kilo Tons) Forecast, by Application, 2020–2031
Table 14: North America Sulfur Market for Mining Application Value (US$ Mn) Forecast, by Application, 2020–2031
Table 15: North America Sulfur Market for Mining Application Volume (Kilo Tons) Forecast, by Country, 2020–2031
Table 16: North America Sulfur Market for Mining Application Value (US$ Mn) Forecast, by Country, 2020–2031
Table 17: U.S. Sulfur Market for Mining Application Volume (Kilo Tons) Forecast, by Form, 2020–2031
Table 18: U.S. Sulfur Market for Mining Application Value (US$ Mn) Forecast, by Form, 2020–2031
Table 19: U.S. Sulfur Market for Mining Application Volume (Kilo Tons) Forecast, by Process, 2020–2031
Table 20: U.S. Sulfur Market for Mining Application Value (US$ Mn) Forecast, by Process, 2020–2031
Table 21: U.S. Sulfur Market for Mining Application Volume (Kilo Tons) Forecast, by Application, 2020–2031
Table 22: U.S. Sulfur Market for Mining Application Value (US$ Mn) Forecast, by Application, 2020–2031
Table 23: Canada Sulfur Market for Mining Application Volume (Kilo Tons) Forecast, by Form, 2020–2031
Table 24: Canada Sulfur Market for Mining Application Value (US$ Mn) Forecast, by Form, 2020–2031
Table 25: Canada Sulfur Market for Mining Application Volume (Kilo Tons) Forecast, by Process, 2020–2031
Table 26: Canada Sulfur Market for Mining Application Value (US$ Mn) Forecast, by Process, 2020–2031
Table 27: Canada Sulfur Market for Mining Application Volume (Kilo Tons) Forecast, by Application, 2020–2031
Table 28: Canada Sulfur Market for Mining Application Value (US$ Mn) Forecast, by Application, 2020–2031
Table 29: Europe Sulfur Market for Mining Application Volume (Kilo Tons) Forecast, by Form, 2020–2031
Table 30: Europe Sulfur Market for Mining Application Value (US$ Mn) Forecast, by Form, 2020–2031
Table 31: Europe Sulfur Market for Mining Application Volume (Kilo Tons) Forecast, by Process, 2020–2031
Table 32: Europe Sulfur Market for Mining Application Value (US$ Mn) Forecast, by Process, 2020–2031
Table 33: Europe Sulfur Market for Mining Application Volume (Kilo Tons) Forecast, by Application, 2020–2031
Table 34: Europe Sulfur Market for Mining Application Value (US$ Mn) Forecast, by Application, 2020–2031
Table 35: Europe Sulfur Market for Mining Application Volume (Kilo Tons) Forecast, by Country and Sub-region, 2020–2031
Table 36: Europe Sulfur Market for Mining Application Value (US$ Mn) Forecast, by Country and Sub-region, 2020–2031
Table 37: Germany Sulfur Market for Mining Application Volume (Kilo Tons) Forecast, by Form, 2020–2031
Table 38: Germany Sulfur Market for Mining Application Value (US$ Mn) Forecast, by Form, 2020–2031
Table 39: Germany Sulfur Market for Mining Application Volume (Kilo Tons) Forecast, by Process, 2020–2031
Table 40: Germany Sulfur Market for Mining Application Value (US$ Mn) Forecast, by Process, 2020–2031
Table 41: Germany Sulfur Market for Mining Application Volume (Kilo Tons) Forecast, by Application, 2020–2031
Table 42: Germany Sulfur Market for Mining Application Value (US$ Mn) Forecast, by Application, 2020–2031
Table 43: France Sulfur Market for Mining Application Volume (Kilo Tons) Forecast, by Form, 2020–2031
Table 44: France Sulfur Market for Mining Application Value (US$ Mn) Forecast, by Form, 2020–2031
Table 45: France Sulfur Market for Mining Application Volume (Kilo Tons) Forecast, by Process, 2020–2031
Table 46: France Sulfur Market for Mining Application Value (US$ Mn) Forecast, by Process, 2020–2031
Table 47: France Sulfur Market for Mining Application Volume (Kilo Tons) Forecast, by Application, 2020–2031
Table 48: France Sulfur Market for Mining Application Value (US$ Mn) Forecast, by Application, 2020–2031
Table 49: U.K. Sulfur Market for Mining Application Volume (Kilo Tons) Forecast, by Form, 2020–2031
Table 50: U.K. Sulfur Market for Mining Application Value (US$ Mn) Forecast, by Form, 2020–2031
Table 51: U.K. Sulfur Market for Mining Application Volume (Kilo Tons) Forecast, by Process, 2020–2031
Table 52: U.K. Sulfur Market for Mining Application Value (US$ Mn) Forecast, by Process, 2020–2031
Table 53: U.K. Sulfur Market for Mining Application Volume (Kilo Tons) Forecast, by Application, 2020–2031
Table 54: U.K. Sulfur Market for Mining Application Value (US$ Mn) Forecast, by Application, 2020–2031
Table 55: Italy Sulfur Market for Mining Application Volume (Kilo Tons) Forecast, by Form, 2020–2031
Table 56: Italy Sulfur Market for Mining Application Value (US$ Mn) Forecast, by Form, 2020–2031
Table 57: Italy Sulfur Market for Mining Application Volume (Kilo Tons) Forecast, by Process, 2020–2031
Table 58: Italy Sulfur Market for Mining Application Value (US$ Mn) Forecast, by Process, 2020–2031
Table 59: Italy Sulfur Market for Mining Application Volume (Kilo Tons) Forecast, by Application, 2020–2031
Table 60: Italy Sulfur Market for Mining Application Value (US$ Mn) Forecast, by Application, 2020–2031
Table 61: Spain Sulfur Market for Mining Application Volume (Kilo Tons) Forecast, by Form, 2020–2031
Table 62: Spain Sulfur Market for Mining Application Value (US$ Mn) Forecast, by Form, 2020–2031
Table 63: Spain Sulfur Market for Mining Application Volume (Kilo Tons) Forecast, by Process, 2020–2031
Table 64: Spain Sulfur Market for Mining Application Value (US$ Mn) Forecast, by Process, 2020–2031
Table 65: Spain Sulfur Market for Mining Application Volume (Kilo Tons) Forecast, by Application, 2020–2031
Table 66: Spain Sulfur Market for Mining Application Value (US$ Mn) Forecast, by Application, 2020–2031
Table 67: Russia & CIS Sulfur Market for Mining Application Volume (Kilo Tons) Forecast, by Form, 2020–2031
Table 68: Russia & CIS Sulfur Market for Mining Application Value (US$ Mn) Forecast, by Form, 2020–2031
Table 69: Russia & CIS Sulfur Market for Mining Application Volume (Kilo Tons) Forecast, by Process, 2020–2031
Table 70: Russia & CIS Sulfur Market for Mining Application Value (US$ Mn) Forecast, by Process, 2020–2031
Table 71: Russia & CIS Sulfur Market for Mining Application Volume (Kilo Tons) Forecast, by Application, 2020–2031
Table 72: Russia & CIS Sulfur Market for Mining Application Value (US$ Mn) Forecast, by Application, 2020–2031
Table 73: Rest of Europe Sulfur Market for Mining Application Volume (Kilo Tons) Forecast, by Form, 2020–2031
Table 74: Rest of Europe Sulfur Market for Mining Application Value (US$ Mn) Forecast, by Form, 2020–2031
Table 75: Rest of Europe Sulfur Market for Mining Application Volume (Kilo Tons) Forecast, by Process, 2020–2031
Table 76: Rest of Europe Sulfur Market for Mining Application Value (US$ Mn) Forecast, by Process, 2020–2031
Table 77: Rest of Europe Sulfur Market for Mining Application Volume (Kilo Tons) Forecast, by Application, 2020–2031
Table 78: Rest of Europe Sulfur Market for Mining Application Value (US$ Mn) Forecast, by Application, 2020–2031
Table 79: Asia Pacific Sulfur Market for Mining Application Volume (Kilo Tons) Forecast, by Form, 2020–2031
Table 80: Asia Pacific Sulfur Market for Mining Application Value (US$ Mn) Forecast, by Form, 2020–2031
Table 81: Asia Pacific Sulfur Market for Mining Application Volume (Kilo Tons) Forecast, by Process, 2020–2031
Table 82: Asia Pacific Sulfur Market for Mining Application Value (US$ Mn) Forecast, by Process, 2020–2031
Table 83: Asia Pacific Sulfur Market for Mining Application Volume (Kilo Tons) Forecast, by Application, 2020–2031
Table 84: Asia Pacific Sulfur Market for Mining Application Value (US$ Mn) Forecast, by Application, 2020–2031
Table 85: Asia Pacific Sulfur Market for Mining Application Volume (Kilo Tons) Forecast, by Country and Sub-region, 2020–2031
Table 86: Asia Pacific Sulfur Market for Mining Application Value (US$ Mn) Forecast, by Country and Sub-region, 2020–2031
Table 87: China Sulfur Market for Mining Application Volume (Kilo Tons) Forecast, by Form, 2020–2031
Table 88: China Sulfur Market for Mining Application Value (US$ Mn) Forecast, by Form 2020–2031
Table 89: China Sulfur Market for Mining Application Volume (Kilo Tons) Forecast, by Process, 2020–2031
Table 90: China Sulfur Market for Mining Application Value (US$ Mn) Forecast, by Process, 2020–2031
Table 91: China Sulfur Market for Mining Application Volume (Kilo Tons) Forecast, by Application, 2020–2031
Table 92: China Sulfur Market for Mining Application Value (US$ Mn) Forecast, by Application, 2020–2031
Table 93: Japan Sulfur Market for Mining Application Volume (Kilo Tons) Forecast, by Form, 2020–2031
Table 94: Japan Sulfur Market for Mining Application Value (US$ Mn) Forecast, by Form, 2020–2031
Table 95: Japan Sulfur Market for Mining Application Volume (Kilo Tons) Forecast, by Process, 2020–2031
Table 96: Japan Sulfur Market for Mining Application Value (US$ Mn) Forecast, by Process, 2020–2031
Table 97: Japan Sulfur Market for Mining Application Volume (Kilo Tons) Forecast, by Application, 2020–2031
Table 98: Japan Sulfur Market for Mining Application Value (US$ Mn) Forecast, by Application, 2020–2031
Table 99: India Sulfur Market for Mining Application Volume (Kilo Tons) Forecast, by Form, 2020–2031
Table 100: India Sulfur Market for Mining Application Value (US$ Mn) Forecast, by Form, 2020–2031
Table 101: India Sulfur Market for Mining Application Volume (Kilo Tons) Forecast, by Process, 2020–2031
Table 102: India Sulfur Market for Mining Application Value (US$ Mn) Forecast, by Process, 2020–2031
Table 103: India Sulfur Market for Mining Application Volume (Kilo Tons) Forecast, by Application, 2020–2031
Table 104: India Sulfur Market for Mining Application Value (US$ Mn) Forecast, by Application, 2020–2031
Table 105: India Sulfur Market for Mining Application Volume (Kilo Tons) Forecast, by Application, 2020–2031
Table 106: India Sulfur Market for Mining Application Value (US$ Mn) Forecast, by Application 2020–2031
Table 107: ASEAN Sulfur Market for Mining Application Volume (Kilo Tons) Forecast, by Form, 2020–2031
Table 108: ASEAN Sulfur Market for Mining Application Value (US$ Mn) Forecast, by Form, 2020–2031
Table 109: ASEAN Sulfur Market for Mining Application Volume (Kilo Tons) Forecast, by Process, 2020–2031
Table 110: ASEAN Sulfur Market for Mining Application Value (US$ Mn) Forecast, by Process, 2020–2031
Table 111: ASEAN Sulfur Market for Mining Application Volume (Kilo Tons) Forecast, by Application, 2020–2031
Table 112: ASEAN Sulfur Market for Mining Application Value (US$ Mn) Forecast, by Application, 2020–2031
Table 113: Rest of Asia Pacific Sulfur Market for Mining Application Volume (Kilo Tons) Forecast, by Form, 2020–2031
Table 114: Rest of Asia Pacific Sulfur Market for Mining Application Value (US$ Mn) Forecast, by Form, 2020–2031
Table 115: Rest of Asia Pacific Sulfur Market for Mining Application Volume (Kilo Tons) Forecast, by Process, 2020–2031
Table 116: Rest of Asia Pacific Sulfur Market for Mining Application Value (US$ Mn) Forecast, by Process, 2020–2031
Table 117: Rest of Asia Pacific Sulfur Market for Mining Application Volume (Kilo Tons) Forecast, by Application, 2020–2031
Table 118: Rest of Asia Pacific Sulfur Market for Mining Application Value (US$ Mn) Forecast, by Application, 2020–2031
Table 119: Latin America Sulfur Market for Mining Application Volume (Kilo Tons) Forecast, by Form, 2020–2031
Table 120: Latin America Sulfur Market for Mining Application Value (US$ Mn) Forecast, by Form, 2020–2031
Table 121: Latin America Sulfur Market for Mining Application Volume (Kilo Tons) Forecast, by Process, 2020–2031
Table 122: Latin America Sulfur Market for Mining Application Value (US$ Mn) Forecast, by Process, 2020–2031
Table 123: Latin America Sulfur Market for Mining Application Volume (Kilo Tons) Forecast, by Application, 2020–2031
Table 124: Latin America Sulfur Market for Mining Application Value (US$ Mn) Forecast, by Application, 2020–2031
Table 125: Latin America Sulfur Market for Mining Application Volume (Kilo Tons) Forecast, by Country and Sub-region, 2020–2031
Table 126: Latin America Sulfur Market for Mining Application Value (US$ Mn) Forecast, by Country and Sub-region, 2020–2031
Table 127: Brazil Sulfur Market for Mining Application Volume (Kilo Tons) Forecast, by Form, 2020–2031
Table 128: Brazil Sulfur Market for Mining Application Value (US$ Mn) Forecast, by Form, 2020–2031
Table 129: Brazil Sulfur Market for Mining Application Volume (Kilo Tons) Forecast, by Process, 2020–2031
Table 130: Brazil Sulfur Market for Mining Application Value (US$ Mn) Forecast, by Process, 2020–2031
Table 131: Brazil Sulfur Market for Mining Application Volume (Kilo Tons) Forecast, by Application, 2020–2031
Table 132: Brazil Sulfur Market for Mining Application Value (US$ Mn) Forecast, by Application, 2020–2031
Table 133: Mexico Sulfur Market for Mining Application Volume (Kilo Tons) Forecast, by Form, 2020–2031
Table 134: Mexico Sulfur Market for Mining Application Value (US$ Mn) Forecast, by Form, 2020–2031
Table 135: Mexico Sulfur Market for Mining Application Volume (Kilo Tons) Forecast, by Process, 2020–2031
Table 136: Mexico Sulfur Market for Mining Application Value (US$ Mn) Forecast, by Process, 2020–2031
Table 137: Mexico Sulfur Market for Mining Application Volume (Kilo Tons) Forecast, by Application, 2020–2031
Table 138: Mexico Sulfur Market for Mining Application Value (US$ Mn) Forecast, by Application, 2020–2031
Table 139: Rest of Latin America Sulfur Market for Mining Application Volume (Kilo Tons) Forecast, by Form, 2020–2031
Table 140: Rest of Latin America Sulfur Market for Mining Application Value (US$ Mn) Forecast, by Form, 2020–2031
Table 141: Rest of Latin America Sulfur Market for Mining Application Volume (Kilo Tons) Forecast, by Process, 2020–2031
Table 142: Rest of Latin America Sulfur Market for Mining Application Value (US$ Mn) Forecast, by Process, 2020–2031
Table 143: Rest of Latin America Sulfur Market for Mining Application Volume (Kilo Tons) Forecast, by Application, 2020–2031
Table 144: Rest of Latin America Sulfur Market for Mining Application Value (US$ Mn) Forecast, by Application, 2020–2031
Table 145: Middle East & Africa Sulfur Market for Mining Application Volume (Kilo Tons) Forecast, by Form, 2020–2031
Table 146: Middle East & Africa Sulfur Market for Mining Application Value (US$ Mn) Forecast, by Form, 2020–2031
Table 147: Middle East & Africa Sulfur Market for Mining Application Volume (Kilo Tons) Forecast, by Process, 2020–2031
Table 148: Middle East & Africa Sulfur Market for Mining Application Value (US$ Mn) Forecast, by Process, 2020–2031
Table 149: Middle East & Africa Sulfur Market for Mining Application Volume (Kilo Tons) Forecast, by Application, 2020–2031
Table 150: Middle East & Africa Sulfur Market for Mining Application Value (US$ Mn) Forecast, by Application, 2020–2031
Table 151: Middle East & Africa Sulfur Market for Mining Application Volume (Kilo Tons) Forecast, by Country and Sub-region, 2020–2031
Table 152: Middle East & Africa Sulfur Market for Mining Application Value (US$ Mn) Forecast, by Country and Sub-region, 2020–2031
Table 153: GCC Sulfur Market for Mining Application Volume (Kilo Tons) Forecast, by Form, 2020–2031
Table 154: GCC Sulfur Market for Mining Application Value (US$ Mn) Forecast, by Form, 2020–2031
Table 155: GCC Sulfur Market for Mining Application Volume (Kilo Tons) Forecast, by Process, 2020–2031
Table 156: GCC Sulfur Market for Mining Application Value (US$ Mn) Forecast, by Process, 2020–2031
Table 157: GCC Sulfur Market for Mining Application Volume (Kilo Tons) Forecast, by Application, 2020–2031
Table 158: GCC Sulfur Market for Mining Application Value (US$ Mn) Forecast, by Application, 2020–2031
Table 159: South Africa Sulfur Market for Mining Application Volume (Kilo Tons) Forecast, by Form, 2020–2031
Table 160: South Africa Sulfur Market for Mining Application Value (US$ Mn) Forecast, by Form, 2020–2031
Table 161: South Africa Sulfur Market for Mining Application Volume (Kilo Tons) Forecast, by Process, 2020–2031
Table 162: South Africa Sulfur Market for Mining Application Value (US$ Mn) Forecast, by Process, 2020–2031
Table 163: South Africa Sulfur Market for Mining Application Volume (Kilo Tons) Forecast, by Application, 2020–2031
Table 164: South Africa Sulfur Market for Mining Application Value (US$ Mn) Forecast, by Application, 2020–2031
Table 165: Rest of Middle East & Africa Sulfur Market for Mining Application Volume (Kilo Tons) Forecast, by Form, 2020–2031
Table 166: Rest of Middle East & Africa Sulfur Market for Mining Application Value (US$ Mn) Forecast, by Form, 2020–2031
Table 167: Rest of Middle East & Africa Sulfur Market for Mining Application Volume (Kilo Tons) Forecast, by Process, 2020–2031
Table 168: Rest of Middle East & Africa Sulfur Market for Mining Application Value (US$ Mn) Forecast, by Process, 2020–2031
Table 169: Rest of Middle East & Africa Sulfur Market for Mining Application Volume (Kilo Tons) Forecast, by Application, 2020–2031
Table 170: Rest of Middle East & Africa Sulfur Market for Mining Application Value (US$ Mn) Forecast, by Application, 2020–2031
List of Figures
Figure 1: Global Sulfur Market for Mining Application Volume Share Analysis, by Form, 2021, 2025, and 2031
Figure 2: Global Sulfur Market for Mining Application Attractiveness, by Form
Figure 3: Global Sulfur Market for Mining Application Volume Share Analysis, by Process, 2021, 2025, and 2031
Figure 4: Global Sulfur Market for Mining Application Attractiveness, by Process
Figure 5: Global Sulfur Market for Mining Application Volume Share Analysis, by Application, 2021, 2025, and 2031
Figure 6: Global Sulfur Market for Mining Application Attractiveness, by Application
Figure 7: Global Sulfur Market for Mining Application Volume Share Analysis, by Region, 2021, 2025, and 2031
Figure 8: Global Sulfur Market for Mining Application Attractiveness, by Region
Figure 9: North America Sulfur Market for Mining Application Volume Share Analysis, by Form, 2021, 2025, and 2031
Figure 10: North America Sulfur Market for Mining Application Attractiveness, by Form
Figure 11: North America Sulfur Market for Mining Application Volume Share Analysis, by Process, 2021, 2025, and 2031
Figure 12: North America Sulfur Market for Mining Application Attractiveness, by Process
Figure 13: North America Sulfur Market for Mining Application Volume Share Analysis, by Application, 2021, 2025, and 2031
Figure 14: North America Sulfur Market for Mining Application Attractiveness, by Application
Figure 15: North America Sulfur Market for Mining Application Attractiveness, by Country and Sub-region
Figure 16: Europe Sulfur Market for Mining Application Volume Share Analysis, by Form, 2021, 2025, and 2031
Figure 17: Europe Sulfur Market for Mining Application Attractiveness, by Form
Figure 18: Europe Sulfur Market for Mining Application Volume Share Analysis, by Process, 2021, 2025, and 2031
Figure 19: Europe Sulfur Market for Mining Application Attractiveness, by Process
Figure 20: Europe Sulfur Market for Mining Application Volume Share Analysis, by Application, 2021, 2025, and 2031
Figure 21: Europe Sulfur Market for Mining Application Attractiveness, by Application
Figure 22: Europe Sulfur Market for Mining Application Volume Share Analysis, by Country and Sub-region, 2021, 2025, and 2031
Figure 23: Europe Sulfur Market for Mining Application Attractiveness, by Country and Sub-region
Figure 24: Asia Pacific Sulfur Market for Mining Application Volume Share Analysis, by Form, 2021, 2025, and 2031
Figure 25: Asia Pacific Sulfur Market for Mining Application Attractiveness, by Form
Figure 26: Asia Pacific Sulfur Market for Mining Application Volume Share Analysis, by Process, 2021, 2025, and 2031
Figure 27: Asia Pacific Sulfur Market for Mining Application Attractiveness, by Process
Figure 28: Asia Pacific Sulfur Market for Mining Application Volume Share Analysis, by Application, 2021, 2025, and 2031
Figure 29: Asia Pacific Sulfur Market for Mining Application Attractiveness, by Application
Figure 30: Asia Pacific Sulfur Market for Mining Application Volume Share Analysis, by Country and Sub-region, 2021, 2025, and 2031
Figure 31: Asia Pacific Sulfur Market for Mining Application Attractiveness, by Country and Sub-region
Figure 32: Latin America Sulfur Market for Mining Application Volume Share Analysis, by Form, 2021, 2025, and 2031
Figure 33: Latin America Sulfur Market for Mining Application Attractiveness, by Form
Figure 34: Latin America Sulfur Market for Mining Application Volume Share Analysis, by Process, 2021, 2025, and 2031
Figure 35: Latin America Sulfur Market for Mining Application Attractiveness, by Process
Figure 36: Latin America Sulfur Market for Mining Application Volume Share Analysis, by Application, 2021, 2025, and 2031
Figure 37: Latin America Sulfur Market for Mining Application Attractiveness, by Application
Figure 38: Latin America Sulfur Market for Mining Application Volume Share Analysis, by Country and Sub-region, 2021, 2025, and 2031
Figure 39: Latin America Sulfur Market for Mining Application Attractiveness, by Country and Sub-region
Figure 40: Middle East & Africa Sulfur Market for Mining Application Volume Share Analysis, by Form, 2021, 2025, and 2031
Figure 41: Middle East & Africa Sulfur Market for Mining Application Attractiveness, by Form
Figure 42: Middle East & Africa Sulfur Market for Mining Application Volume Share Analysis, by Process, 2021, 2025, and 2031
Figure 43: Middle East & Africa Sulfur Market for Mining Application Attractiveness, by Process
Figure 44: Middle East & Africa Sulfur Market for Mining Application Volume Share Analysis, by Application, 2021, 2025, and 2031
Figure 45: Middle East & Africa Sulfur Market for Mining Application Attractiveness, by Application
Figure 46: Middle East & Africa Sulfur Market for Mining Application Volume Share Analysis, by Country and Sub-region, 2021, 2025, and 2031
Figure 47: Middle East & Africa Sulfur Market for Mining Application Attractiveness, by Country and Sub-region
Copyright © Transparency Market Research, Inc. All Rights reserved
Trust Online

Sulfur Market for Mining Application