
Reports
Reports
Analysts’ Viewpoint on Sports Technology Market Scenario
Advances in technology have had a profound impact on every industrial sector, including sports. Technology has drastically revolutionized the sporting equipment sector, influencing everything from shape to effectiveness and accuracy. It has virtually changed the playing field of sports, and technology seems to have a gained a revered place in the sports industry. Recent advances in technology have meant that, currently, sports professionals can wear sensors to track performance, improve movements, gain data-driven insights, and enhance communication as well as create a less injury-prone environment.
All sports athletes, managers, coaches, etc., are overcoming their limitation with the aid of sports engineering. Many sportspeople are gaining competitive benefits in their respective sports as a result of technological advancement. Additionally, an increase in adoption of advanced technology in sports training and rising fan engagement boost the sports technology market. The use of technology also enhances the game experience for fans, enabling them to interact with their favorite sportsperson online; it also promotes viewing and purchase habits. Furthermore, technology is expected to deliver seamless and integrated results in the near future, which in turn is likely to enhance the sports experience. Moreover, it would deliver higher audience/fan engagement and better commercial outcomes as well.
Sports technology combines the excellence of both sports science and technology. Sporting technologies comprise manmade methods that are developed to pursue human interests or goals in or relation to a particular sport. Sports technology is the technical means employed by athletes to improve their training and competitive surroundings in order to enhance their overall athletic performance.
Increase in adoption of sports technology, rise in need for data-driven decision-making, and surge in adoption of new technology in sports media, or esports, are projected to propel the global sports technology market during the forecast period.
Analytics has been gaining popularity in the last decade, especially within the sports industry. Advancements and increased competitiveness in sports have prompted players and organizations to employ sports analytics to seek answers and solutions to improve performance, comprehend data, and engage fans and customers more effectively.
Rise in demand for various advanced technologies, such as artificial intelligence (AI), Internet of Things (IoT), machine learning (ML), big data analytics, computer vision, and advanced wireless connectivity, among other technologies, is projected to drive sports technology market size. Additionally, AI-enabled predictive analysis can be utilized to enhance the health and fitness of athletes in sports.
AI helps detect patterns in tactics, strategies, and weaknesses during games. Use of AI analytics technology in sports statistics is gaining traction for its ability to make sense of the enormous volumes of data generated and the potential to make fairly accurate predictions.
Advancements in the field of predictive analytics have led to the development of virtual and augmented reality predictive models that can compute probabilities of sports win/loss prospects and analyze the performance of players. Therefore, a rise in the usage of predictive analytics offers significant opportunities for the global sports technology market.
Wearable technology in sports equipment is useful to improve athlete training and performance. Wearable sports technologies can be used to monitor athletic training, in-game performance, and recovery after an injury. Wearable technology is rapidly revolutionizing sports by reducing the risk associated with injuries such as exhaustion, damaged tendons, and concussion. Additionally, technological developments in this rapidly expanding specialty enable team administrators, coaches, trainers, and players to improve sports performance tracking and reduce sports-related sickness at the same time.
For instance, according to a published article by OHIO University, dated January 2020, wearable athletic devices produced by Australian industry leader- Catapult GPS sports trackers were used by over 9,500 professional athletic players on 500 teams in 35 sports and 35 countries to improve personal and team performance and reduce injury at the same time.
In another example, according to The Upside Newsletter article published dated April 2022, English Premier League loses account to over US$ 12 Mn in wages to those players who are actually not available on the ground owing to injury, which might be tracked and identified beforehand early before selection.
Wearable technology is also helping create a new playing field in the sports industry to develop groundbreaking innovative products. Rapid advances in sports science technology have made sports wearable devices vital to sportspeople and athletes, globally, in terms of performance assessment and improvement, tracking of distance, speed, and route for amateur runners to complex measurements, and among other such applications. Thus, incremental technological advancements in wearable technology devices are expected to offer significant opportunities for the sports technology market.
North America held major share of the global sports technology market in 2021. North America is expected to retain its dominance of the global sports technology market during the forecast period, primarily due to technological advancements across countries in North America, as sports is considered a big business as shown by valuations and finances of major professional sports in the region. Furthermore, North America is witnessing an increased demand for smart sports equipment. Additionally, the R&D departments of sports goods companies have been focusing on the launch of new products or in embedding digital technology to their existing range in order to capitalize on the increased demand for smart sports equipment.
The sports technology market in Asia Pacific region is projected to expand at a prominent growth rate during the forecast period owing to an increase in GDP investment for sports across countries such as China and India. These economies have been more active in sports such as cricket, basketball, baseball, etc. Additionally, companies across countries such as China, India, and Singapore are taking initiatives to launch market-leading solutions and disruptive sports technologies to users domestically and globally, which are changing the game at both professional and amateur levels, across all major sports worldwide.
The sports technology market in Europe is witnessing significant growth owing to increased adoption of advanced technology across different sports in countries, such as the U.K., Germany, and France, which is expected to further increase the demand for sports technology during the forecast period.
The global sports technology market is fragmented, and vendors are looking for ways to successfully tap growth opportunities and strengthen their presence in the market. Top sport tech companies are expanding their product portfolio through mergers and acquisitions. The next few years are expected to offer significant opportunity for the sports technology market in untapped markets. Key players operating in the global sports technology market include Apple Inc., Catapult Sports, Cisco Systems, Inc., HCL Technologies Limited, IBM Corporation, Infosys Limited, Modern Times Group (MTG), Oracle Corporation, Panasonic Corporation, SAP SE, Sony Corporation, and Stats LLC.
Each of the above-mentioned companies has been profiled in the sports technology market report. The company profiles include a company overview, financial overview, business strategies, product portfolio, business segments, and recent developments.
|
Attribute |
Detail |
|
Market Size Value in 2021 |
US$ 18.36 Bn |
|
Market Forecast Value in 2031 |
US$ 65.64 Bn |
|
Growth Rate (CAGR) |
14.0% |
|
Forecast Period |
2022–2031 |
|
Historical Data Available for |
2017–2020 |
|
Quantitative Units |
US$ Bn for Value |
|
Market Analysis |
Includes cross-segment analysis at global as well as regional levels. Furthermore, the qualitative analysis includes drivers, restraints, opportunities, key trends, ecosystem analysis, and COVID-19 impact analysis. |
|
Competition Landscape |
|
|
Format |
Electronic (PDF) + Excel |
|
Market Segmentation |
|
|
Regions Covered |
|
|
Countries Covered |
|
|
Companies Profiled |
|
|
Customization Scope |
Available upon request |
|
Pricing |
Available upon request |
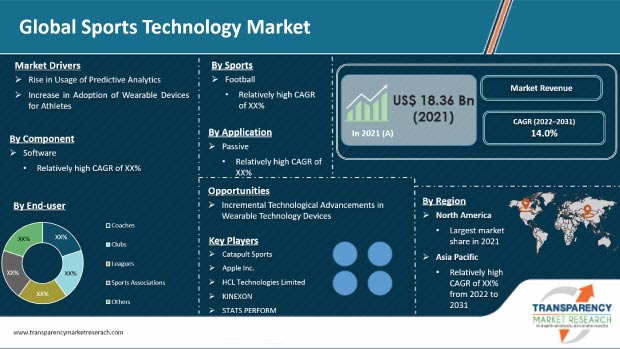
The sports technology market stood at US$ 18.36 Bn in 2021.
The sports technology market is estimated to surge at a CAGR of 14.0% during the forecast period.
Rise in use of predictive analysis, increase in adoption of wearable devices for athletes, and surge in adoption of advanced technology in sports media.
The football segment is at the forefront of the sports technology market.
North America is a more attractive region for vendors in the sports technology market.
Apple Inc., Catapult Sports, Cisco Systems, Inc., HCL Technologies Limited, IBM Corporation, Infosys Limited, Modern Times Group (MTG), Oracle Corporation, Panasonic Corporation, SAP SE, Sony Corporation, and Stats LLC.
1. Preface
1.1. Market Introduction
1.2. Market Segmentation
1.3. Key Research Objectives
2. Assumptions and Research Methodology
2.1. Research Methodology
2.1.1. List of Primary and Secondary Sources
2.2. Key Assumptions for Data Modeling
3. Executive Summary: Global Sports Technology Market
4. Market Overview
4.1. Market Definition
4.2. Component/Product Roadmap
4.3. Market Factor Analysis
4.3.1. Forecast Factors
4.3.2. Ecosystem/Value Chain Analysis
4.3.3. Market Dynamics (Growth Influencers)
4.3.3.1. Drivers
4.3.3.2. Restraints
4.3.3.3. Opportunities
4.3.3.4. Impact Analysis of Drivers and Restraints
4.4. COVID-19 Impact Analysis
4.4.1. Impact of COVID-19 on Sports Technology Market
4.4.2. End-user Sentiment Analysis: Comparative Analysis on Spending
4.4.2.1. Increase in Spending
4.4.2.2. Decrease in Spending
4.4.3. Short Term and Long Term Impact on the Market
4.5. Market Opportunity Assessment – by Region (North America/Europe/Asia Pacific/Middle East and Africa/South America)
4.5.1. By Component
4.5.2. By Sports
4.5.3. By Application
4.5.4. By End-user
5. Global Sports Technology Market Analysis and Forecast
5.1. Market Revenue Analysis (US$ Bn), 2016-2031
5.1.1. Historic Growth Trends, 2016-2021
5.1.2. Forecast Trends, 2022-2031
5.2. Pricing Model Analysis/Price Trend Analysis
6. Global Sports Technology Market Analysis, by Component
6.1. Overview and Definitions
6.2. Key Segment Analysis
6.3. Sports Technology Market Size (US$ Bn) Forecast, by Component, 2018 - 2031
6.3.1. Wearable Devices & Sports Equipment & Sports Equipment
6.3.2. Software
6.3.2.1. On-premise
6.3.2.2. Cloud
6.3.3. Services
6.3.3.1. Training & Implementation
6.3.3.2. Support & Maintenance
6.3.3.3. Managed/Outsourced Services
7. Global Sports Technology Market Analysis, by Sports
7.1. Overview and Definitions
7.2. Key Segment Analysis
7.3. Sports Technology Market Size (US$ Bn) Forecast, by Sports, 2018 - 2031
7.3.1. Baseball
7.3.2. Basketball
7.3.3. Cricket
7.3.4. Cycling
7.3.5. Football
7.3.6. Golf
7.3.7. Rugby
7.3.8. Others
8. Global Sports Technology Market Analysis, by Application
8.1. Overview and Definitions
8.2. Key Segment Analysis
8.3. Sports Technology Market Size (US$ Bn) Forecast, by Application, 2018 - 2031
8.3.1. Active
8.3.1.1. Tracking
8.3.1.2. Decision Making
8.3.2. Passive
8.3.2.1. Analytics and Statistics
8.3.2.2. Tactics and Simulation
8.3.2.3. Training
8.3.2.4. Game Performance Analysis
8.3.2.5. Team Analysis & Management
8.3.2.6. Injury and Health Analysis
9. Global Sports Technology Market Analysis, by End-user
9.1. Overview and Definitions
9.2. Key Segment Analysis
9.3. Sports Technology Market Size (US$ Bn) Forecast, by End-user, 2018 – 2031
9.3.1. Coaches
9.3.2. Clubs
9.3.3. Leagues
9.3.4. Sports Associations
9.3.5. Others (Athletes and Sports Person)
10. Global Sports Technology Market Analysis and Forecasts, by Region
10.1. Key Findings
10.2. Market Size (US$ Bn) Forecast by Region, 2018-2031
10.2.1. North America
10.2.2. Europe
10.2.3. Asia Pacific
10.2.4. Middle East & Africa
10.2.5. South America
11. North America Sports Technology Market Analysis and Forecast
11.1. Regional Outlook
11.2. Sports Technology Market Size (US$ Bn) Analysis and Forecast, 2018 - 2031
11.2.1. By Component
11.2.2. By Sports
11.2.3. By Application
11.2.4. By End-user
11.3. Sports Technology Market Size (US$ Bn) Forecast, by Country, 2018 - 2031
11.3.1. U.S.
11.3.2. Canada
11.3.3. Mexico
12. Europe Sports Technology Market Analysis and Forecast
12.1. Regional Outlook
12.2. Sports Technology Market Size (US$ Bn) Analysis and Forecast, 2018 - 2031
12.2.1. By Component
12.2.2. By Sports
12.2.3. By Application
12.2.4. By End-user
12.3. Sports Technology Market Size (US$ Bn) Forecast, by Country and Sub-region, 2018 – 2031
12.3.1. Germany
12.3.2. UK
12.3.3. France
12.3.4. Italy
12.3.5. Spain
12.3.6. Rest of Europe
13. Asia Pacific Sports Technology Market Analysis and Forecast
13.1. Regional Outlook
13.2. Sports Technology Market Size (US$ Bn) Analysis and Forecast, 2018 - 2031
13.2.1. By Component
13.2.2. By Sports
13.2.3. By Application
13.2.4. By End-user
13.3. Sports Technology Market Size (US$ Bn) Forecast, by Country and Sub-region, 2018 - 2031
13.3.1. China
13.3.2. India
13.3.3. Japan
13.3.4. ASEAN
13.3.5. Rest of Asia Pacific
14. Middle East & Africa Sports Technology Market Analysis and Forecast
14.1. Regional Outlook
14.2. Sports Technology Market Size (US$ Bn) Analysis and Forecast, 2018 - 2031
14.2.1. By Component
14.2.2. By Sports
14.2.3. By Application
14.2.4. By End-user
14.3. Sports Technology Market Size (US$ Bn) Forecast, by Country and Sub-region, 2018 - 2031
14.3.1. Saudi Arabia
14.3.2. UAE
14.3.3. South Africa
14.3.4. Rest of Middle East & Africa
15. South America Sports Technology Market Analysis and Forecast
15.1. Regional Outlook
15.2. Sports Technology Market Size (US$ Bn) Analysis and Forecast, 2018 - 2031
15.2.1. By Component
15.2.2. By Sports
15.2.3. By Application
15.2.4. By End-user
15.3. Sports Technology Market Size (US$ Bn) Forecast, by Country and Sub-region, 2018 - 2031
15.3.1. Brazil
15.3.2. Argentina
15.3.3. Rest of South America
16. Competition Landscape
16.1. Market Competition Matrix, by Leading Players
16.2. Market Revenue Share Analysis (%), by Leading Players (2021)
16.3. Competitive Scenario
16.3.1. List of Emerging, Prominent, and Leading Players
16.3.2. Major Mergers & Acquisitions, Expansions, Partnership, Contacts, Deals, etc.
17. Company Profiles
17.1. Apple Inc.
17.1.1. Business Overview
17.1.2. Company Revenue
17.1.3. Product Portfolio
17.1.4. Geographic Footprint
17.1.5. Strategic Partnership
17.1.6. Merger & Acquisition
17.1.7. Business Expansion
17.1.8. New Product Launch
17.1.9. Innovation, etc.
17.2. Catapult Sports
17.2.1. Business Overview
17.2.2. Company Revenue
17.2.3. Product Portfolio
17.2.4. Geographic Footprint
17.2.5. Strategic Partnership
17.2.6. Merger & Acquisition
17.2.7. Business Expansion
17.2.8. New Product Launch
17.2.9. Innovation, etc.
17.3. Cisco Systems, Inc.
17.3.1. Business Overview
17.3.2. Company Revenue
17.3.3. Product Portfolio
17.3.4. Geographic Footprint
17.3.5. Strategic Partnership
17.3.6. Merger & Acquisition
17.3.7. Business Expansion
17.3.8. New Product Launch
17.3.9. Innovation, etc.
17.4. HCL Technologies Limited
17.4.1. Business Overview
17.4.2. Company Revenue
17.4.3. Product Portfolio
17.4.4. Geographic Footprint
17.4.5. Strategic Partnership
17.4.6. Merger & Acquisition
17.4.7. Business Expansion
17.4.8. New Product Launch
17.4.9. Innovation, etc.
17.5. IBM Corporation
17.5.1. Business Overview
17.5.2. Company Revenue
17.5.3. Product Portfolio
17.5.4. Geographic Footprint
17.5.5. Strategic Partnership
17.5.6. Merger & Acquisition
17.5.7. Business Expansion
17.5.8. New Product Launch
17.5.9. Innovation, etc.
17.6. Infosys Limited
17.6.1. Business Overview
17.6.2. Company Revenue
17.6.3. Product Portfolio
17.6.4. Geographic Footprint
17.6.5. Strategic Partnership
17.6.6. Merger & Acquisition
17.6.7. Business Expansion
17.6.8. New Product Launch
17.6.9. Innovation, etc.
17.7. Modern Times Group (MTG)
17.7.1. Business Overview
17.7.2. Company Revenue
17.7.3. Product Portfolio
17.7.4. Geographic Footprint
17.7.5. Strategic Partnership
17.7.6. Merger & Acquisition
17.7.7. Business Expansion
17.7.8. New Product Launch
17.7.9. Innovation, etc.
17.8. Oracle
17.8.1. Business Overview
17.8.2. Company Revenue
17.8.3. Product Portfolio
17.8.4. Geographic Footprint
17.8.5. Strategic Partnership
17.8.6. Merger & Acquisition
17.8.7. Business Expansion
17.8.8. New Product Launch
17.8.9. Innovation, etc.
17.9. Panasonic Corporation
17.9.1. Business Overview
17.9.2. Company Revenue
17.9.3. Product Portfolio
17.9.4. Geographic Footprint
17.9.5. Strategic Partnership
17.9.6. Merger & Acquisition
17.9.7. Business Expansion
17.9.8. New Product Launch
17.9.9. Innovation, etc.
17.10. SAP SE
17.10.1. Business Overview
17.10.2. Company Revenue
17.10.3. Product Portfolio
17.10.4. Geographic Footprint
17.10.5. Strategic Partnership
17.10.6. Merger & Acquisition
17.10.7. Business Expansion
17.10.8. New Product Launch
17.10.9. Innovation, etc.
17.11. Sony Corporation
17.11.1. Business Overview
17.11.2. Company Revenue
17.11.3. Product Portfolio
17.11.4. Geographic Footprint
17.11.5. Strategic Partnership
17.11.6. Merger & Acquisition
17.11.7. Business Expansion
17.11.8. New Product Launch
17.11.9. Innovation, etc.
17.12. Stats LLC
17.12.1. Business Overview
17.12.2. Company Revenue
17.12.3. Product Portfolio
17.12.4. Geographic Footprint
17.12.5. Strategic Partnership
17.12.6. Merger & Acquisition
17.12.7. Business Expansion
17.12.8. New Product Launch
17.12.9. Innovation, etc.
17.13. Others
17.13.1. Business Overview
17.13.2. Company Revenue
17.13.3. Product Portfolio
17.13.4. Geographic Footprint
17.13.5. Strategic Partnership
17.13.6. Merger & Acquisition
17.13.7. Business Expansion
17.13.8. New Product Launch
17.13.9. Innovation, etc.
18. Key Takeaways
List of Tables
Table 1: Acronyms Used in Sports Technology Market
Table 2: North America Sports Technology Market Revenue Analysis, by Country, 2022 - 2031 (US$ Bn)
Table 3: Europe Sports Technology Market Revenue Analysis, by Country and Sub-region, 2022 - 2031 (US$ Bn)
Table 4: Asia Pacific Sports Technology Market Revenue Analysis, by Country and Sub-region, 2022 - 2031 (US$ Bn)
Table 5: Middle East & Africa Sports Technology Market Revenue Analysis, by Country and Sub-region, 2022 and 2031 (US$ Bn)
Table 6: South America Sports Technology Market Revenue Analysis, by Country and Sub-region, 2022 - 2031 (US$ Bn)
Table 7: Forecast Factors: Relevance and Impact (1/2)
Table 8: Forecast Factors: Relevance and Impact (2/2)
Table 9: Global Sports Technology Market Value (US$ Bn) Forecast, by Sports, 2018 – 2031
Table 10: Global Sports Technology Market Value (US$ Bn) Forecast, by Component, 2018 – 2031
Table 11: Global Sports Technology Market Value (US$ Bn) Forecast, by Application, 2018 – 2031
Table 12: Global Sports Technology Market Value (US$ Bn) Forecast, by End-user, 2018 – 2031
Table 13: Global Sports Technology Market Value (US$ Bn) Forecast, by Region, 2018 – 2031
Table 14: North America Sports Technology Market Value (US$ Bn) Forecast, by Sports, 2018 – 2031
Table 15: North America Sports Technology Market Value (US$ Bn) Forecast, by Component, 2018 – 2031
Table 16: North America Sports Technology Market Value (US$ Bn) Forecast, by Application, 2018 – 2031
Table 17: North America Sports Technology Market Value (US$ Bn) Forecast, by End-user, 2018 – 2031
Table 18: North America Sports Technology Market Value (US$ Bn) Forecast, by Country, 2018 - 2031
Table 19: U.S. Sports Technology Market Revenue CAGR Breakdown (%), by Growth Term
Table 20: Canada Sports Technology Market Revenue CAGR Breakdown (%), by Growth Term
Table 21: Mexico Sports Technology Market Revenue CAGR Breakdown (%), by Growth Term
Table 22: Europe Sports Technology Market Value (US$ Bn) Forecast, by Sports, 2018 – 2031
Table 23: Europe Sports Technology Market Value (US$ Bn) Forecast, by Component, 2018 – 2031
Table 24: Europe Sports Technology Market Value (US$ Bn) Forecast, by Application, 2018 – 2031
Table 25: Europe Sports Technology Market Value (US$ Bn) Forecast, by End-user, 2018 – 2031
Table 26: Europe Sports Technology Market Value (US$ Bn) Forecast, by Country, 2018 - 2031
Table 27: Germany Sports Technology Market Revenue CAGR Breakdown (%), by Growth Term
Table 28: U.K. Sports Technology Market Revenue CAGR Breakdown (%), by Growth Term
Table 29: France Sports Technology Market Revenue CAGR Breakdown (%), by Growth Term
Table 30: Spain Sports Technology Market Revenue CAGR Breakdown (%), by Growth Term
Table 31: Italy Sports Technology Market Revenue CAGR Breakdown (%), by Growth Term
Table 32: Asia Pacific Sports Technology Market Value (US$ Bn) Forecast, by Sports, 2018 – 2031
Table 33: Asia Pacific Sports Technology Market Value (US$ Bn) Forecast, by Component, 2018 – 2031
Table 34: Asia Pacific Sports Technology Market Value (US$ Bn) Forecast, by Application, 2018 – 2031
Table 35: Asia Pacific Sports Technology Market Value (US$ Bn) Forecast, by End-user, 2018 – 2031
Table 36: Asia Pacific Sports Technology Market Value (US$ Bn) Forecast, by Country and Sub-region, 2018 - 2031
Table 37: China Sports Technology Market Revenue CAGR Breakdown (%), by Growth Term
Table 38: India Sports Technology Market Revenue CAGR Breakdown (%), by Growth Term
Table 39: Japan Sports Technology Market Revenue CAGR Breakdown (%), by Growth Term
Table 40: ASEAN Sports Technology Market Revenue CAGR Breakdown (%), by Growth Term
Table 41: Middle East & Africa Sports Technology Market Value (US$ Bn) Forecast, by Sports, 2018 – 2031
Table 42: Middle East & Africa Sports Technology Market Value (US$ Bn) Forecast, by Component, 2018 – 2031
Table 43: Middle East & Africa Sports Technology Market Value (US$ Bn) Forecast, by Application, 2018 – 2031
Table 44: Middle East & Africa Sports Technology Market Value (US$ Bn) Forecast, by End-user, 2018 – 2031
Table 45: Middle East & Africa Sports Technology Market Value (US$ Bn) Forecast, by Country and Sub-region, 2018 - 2031
Table 46: Saudi Arabia Sports Technology Market Revenue CAGR Breakdown (%), by Growth Term
Table 47: UAE Sports Technology Market Revenue CAGR Breakdown (%), by Growth Term
Table 48: South Africa Sports Technology Market Revenue CAGR Breakdown (%), by Growth Term
Table 49: South America Sports Technology Market Value (US$ Bn) Forecast, by Sports, 2018 – 2031
Table 50: South America Sports Technology Market Value (US$ Bn) Forecast, by Component, 2018 – 2031
Table 51: South America Sports Technology Market Value (US$ Bn) Forecast, by Application, 2018 – 2031
Table 52: South America Sports Technology Market Value (US$ Bn) Forecast, by End-user, 2018 – 2031
Table 53: South America Sports Technology Market Value (US$ Bn) Forecast, by Country and Sub-region, 2018 - 2031
Table 54: Brazil Emirates Sports Technology Market Revenue CAGR Breakdown (%), by Growth Term
Table 55: Argentina Sports Technology Market Revenue CAGR Breakdown (%), by Growth Term
List of Figures
Figure 1: Global Sports Technology Market Size (US$ Bn) Forecast, 2018–2031
Figure 2: Global Sports Technology Market Revenue (US$ Bn) Opportunity Assessment, by Region, 2022E
Figure 3: Top Segment Analysis of Sports Technology Market
Figure 4: Global Sports Technology Market Revenue (US$ Bn) Opportunity Assessment, by Region, 2031F
Figure 5: Breach Incident Rates by Level of Security Spend During COVID-19 (In 2020)
Figure 6: Global Sports Technology Market Attractiveness Assessment, by Component
Figure 7: Global Sports Technology Market Attractiveness Assessment, by Sports
Figure 8: Global Sports Technology Market Attractiveness Assessment, by Application
Figure 9: Global Sports Technology Market Attractiveness Assessment, by End-user
Figure 10: Global Sports Technology Market Attractiveness Assessment, by Region
Figure 11: Global Sports Technology Market Revenue (US$ Bn) Historic Trends, 2016 - 2021
Figure 12: Global Sports Technology Market Revenue Opportunity (US$ Bn) Historic Trends, 2016 - 2021
Figure 13: Global Sports Technology Market Value Share Analysis, by Component, 2022
Figure 14: Global Sports Technology Market Value Share Analysis, by Component, 2031
Figure 15: Global Sports Technology Market Absolute Opportunity (US$ Bn), by Wearable Devices & Sports Equipment, 2022 – 2031
Figure 16: Global Sports Technology Market Absolute Opportunity (US$ Bn), by Software, 2022 – 2031
Figure 17: Global Sports Technology Market Absolute Opportunity (US$ Bn), by Services, 2022 – 2031
Figure 18: Global Sports Technology Market Value Share Analysis, by Sports, 2022
Figure 19: Global Sports Technology Market Value Share Analysis, by Sports, 2031
Figure 20: Global Sports Technology Market Absolute Opportunity (US$ Bn), by Baseball, 2022 – 2031
Figure 21: Global Sports Technology Market Absolute Opportunity (US$ Bn), by Basketball, 2022 – 2031
Figure 22: Global Sports Technology Market Absolute Opportunity (US$ Bn), by Cricket, 2022 – 2031
Figure 23: Global Sports Technology Market Absolute Opportunity (US$ Bn), by Cycling, 2022 – 2031
Figure 24: Global Sports Technology Market Absolute Opportunity (US$ Bn), by Football, 2022 – 2031
Figure 25: Global Sports Technology Market Absolute Opportunity (US$ Bn), by Golf, 2022 – 2031
Figure 26: Global Sports Technology Market Absolute Opportunity (US$ Bn), by Rugby, 2022 – 2031
Figure 27: Global Sports Technology Market Absolute Opportunity (US$ Bn), by Others, 2022 – 2031
Figure 28: Global Sports Technology Market Value Share Analysis, by Application, 2022
Figure 29: Global Sports Technology Market Value Share Analysis, by Application, 2031
Figure 30: Global Sports Technology Market Absolute Opportunity (US$ Bn), by Active, 2022 – 2031
Figure 31: Global Sports Technology Market Absolute Opportunity (US$ Bn), by Passive, 2022 – 2031
Figure 32: Global Sports Technology Market Value Share Analysis, by End-user, 2022
Figure 33: Global Sports Technology Market Value Share Analysis, by End-user, 2031
Figure 34: Global Sports Technology Market Absolute Opportunity (US$ Bn), by Coaches, 2022 – 2031
Figure 35: Global Sports Technology Market Absolute Opportunity (US$ Bn), by Clubs, 2022 – 2031
Figure 36: Global Sports Technology Market Absolute Opportunity (US$ Bn), by Leagues, 2022 – 2031
Figure 37: Global Sports Technology Market Absolute Opportunity (US$ Bn), by Sports Associations, 2022 – 2031
Figure 38: Global Sports Technology Market Absolute Opportunity (US$ Bn), by Others, 2022 – 2031
Figure 39: Global Sports Technology Market Opportunity (US$ Bn), by Region
Figure 40: Global Sports Technology Market Size (US$ Bn), by Region, 2022 & 2031
Figure 41: Global Sports Technology Market Value Share Analysis, by Region, 2022
Figure 42: Global Sports Technology Market Value Share Analysis, by Region, 2031
Figure 43: North America Sports Technology Market Absolute Opportunity (US$ Bn), 2022 – 2031
Figure 44: Europe Sports Technology Market Absolute Opportunity (US$ Bn), 2022 – 2031
Figure 45: Asia Pacific Sports Technology Market Absolute Opportunity (US$ Bn), 2022 – 2031
Figure 46: Middle East & Africa Sports Technology Market Absolute Opportunity (US$ Bn), 2022 – 2031
Figure 47: South America Sports Technology Market Absolute Opportunity (US$ Bn), 2022 – 2031
Figure 48: North America Sports Technology Market Attractiveness Assessment, by Component
Figure 49: North America Sports Technology Market Attractiveness Assessment, by Sports
Figure 50: North America Sports Technology Market Revenue Opportunity Share, by Application
Figure 51: North America Sports Technology Market Revenue Opportunity Share, by End-user
Figure 52: North America Sports Technology Market Revenue Opportunity Share, by Country
Figure 53: North America Sports Technology Market Value Share Analysis, by Component, 2022
Figure 54: North America Sports Technology Market Value Share Analysis, by Component, 2031
Figure 55: North America Sports Technology Market Absolute Opportunity (US$ Bn), by Wearable Devices & Sports Equipment, 2022 – 2031
Figure 56: North America Sports Technology Market Absolute Opportunity (US$ Bn), by Software, 2022 – 2031
Figure 57: North America Sports Technology Market Absolute Opportunity (US$ Bn), by Services, 2022 – 2031
Figure 58: North America Sports Technology Market Value Share Analysis, by Sports, 2022
Figure 59: North America Sports Technology Market Value Share Analysis, by Sports, 2031
Figure 60: North America Sports Technology Market Absolute Opportunity (US$ Bn), by Baseball, 2022 – 2031
Figure 61: North America Sports Technology Market Absolute Opportunity (US$ Bn), by Basketball, 2022 – 2031
Figure 62: North America Sports Technology Market Absolute Opportunity (US$ Bn), by Cricket, 2022 – 2031
Figure 63: North America Sports Technology Market Absolute Opportunity (US$ Bn), by Cycling, 2022 – 2031
Figure 64: North America Sports Technology Market Absolute Opportunity (US$ Bn), by Football, 2022 – 2031
Figure 65: North America Sports Technology Market Absolute Opportunity (US$ Bn), by Golf, 2022 – 2031
Figure 66: North America Sports Technology Market Absolute Opportunity (US$ Bn), by Rugby, 2022 – 2031
Figure 67: North America Sports Technology Market Absolute Opportunity (US$ Bn), by Others, 2022 – 2031
Figure 68: North America Sports Technology Market Value Share Analysis, by Application, 2022
Figure 69: North America Sports Technology Market Value Share Analysis, by Application, 2031
Figure 70: North America Sports Technology Market Absolute Opportunity (US$ Bn), by Active, 2022 – 2031
Figure 71: North America Sports Technology Market Absolute Opportunity (US$ Bn), by Passive, 2022 – 2031
Figure 72: North America Sports Technology Market Value Share Analysis, by End-user, 2022
Figure 73: North America Sports Technology Market Value Share Analysis, by End-user, 2031
Figure 74: North America Sports Technology Market Absolute Opportunity (US$ Bn), by Coaches, 2022 – 2031
Figure 75: North America Sports Technology Market Absolute Opportunity (US$ Bn), by Clubs, 2022 – 2031
Figure 76: North America Sports Technology Market Absolute Opportunity (US$ Bn), by Leagues, 2022 – 2031
Figure 77: North America Sports Technology Market Absolute Opportunity (US$ Bn), by Sports Associations, 2022 – 2031
Figure 78: North America Sports Technology Market Absolute Opportunity (US$ Bn), by Others, 2022 – 2031
Figure 79: North America Sports Technology Market Value Share Analysis, by Country, 2022
Figure 80: North America Sports Technology Market Value Share Analysis, by Country, 2031
Figure 81: U.S. Sports Technology Market Opportunity Growth Analysis (US$ Bn) Forecast, 2022 – 2031
Figure 82: Canada Sports Technology Market Opportunity Growth Analysis (US$ Bn) Forecast, 2022 – 2031
Figure 83: Mexico Sports Technology Market Opportunity Growth Analysis (US$ Bn) Forecast, 2022 – 2031
Figure 84: Europe Sports Technology Market Attractiveness Assessment, by Component
Figure 85: Europe Sports Technology Market Attractiveness Assessment, by Sports
Figure 86: Europe Sports Technology Market Revenue Opportunity Share, by Application
Figure 87: Europe Sports Technology Market Revenue Opportunity Share, by End-user
Figure 88: Europe Sports Technology Market Revenue Opportunity Share, by Country and Sub-region
Figure 89: Europe Sports Technology Market Value Share Analysis, by Sports, 2022
Figure 90: Europe Sports Technology Market Value Share Analysis, by Sports, 2031
Figure 91: Europe Sports Technology Market Absolute Opportunity (US$ Bn), by Baseball, 2022 – 2031
Figure 92: Europe Sports Technology Market Absolute Opportunity (US$ Bn), by Basketball, 2022 – 2031
Figure 93: Europe Sports Technology Market Absolute Opportunity (US$ Bn), by Cricket, 2022 – 2031
Figure 94: Europe Sports Technology Market Absolute Opportunity (US$ Bn), by Cycling, 2022 – 2031
Figure 95: Europe Sports Technology Market Absolute Opportunity (US$ Bn), by Football, 2022 – 2031
Figure 96: Europe Sports Technology Market Absolute Opportunity (US$ Bn), by Golf, 2022 – 2031
Figure 97: Europe Sports Technology Market Absolute Opportunity (US$ Bn), by Rugby, 2022 – 2031
Figure 98: Europe Sports Technology Market Absolute Opportunity (US$ Bn), by Others, 2022 – 2031
Figure 99: Europe Sports Technology Market Value Share Analysis, by Component, 2022
Figure 100: Europe Sports Technology Market Value Share Analysis, by Component, 2031
Figure 101: Europe Sports Technology Market Absolute Opportunity (US$ Bn), by Wearable Devices & Sports Equipment, 2022 – 2031
Figure 102: Europe Sports Technology Market Absolute Opportunity (US$ Bn), by Software, 2022 – 2031
Figure 103: Europe Sports Technology Market Absolute Opportunity (US$ Bn), by Services, 2022 – 2031
Figure 104: Europe Sports Technology Market Value Share Analysis, by Application, 2022
Figure 105: Europe Sports Technology Market Value Share Analysis, by Application, 2031
Figure 106: Europe Sports Technology Market Absolute Opportunity (US$ Bn), by Active, 2022 – 2031
Figure 107: Europe Sports Technology Market Absolute Opportunity (US$ Bn), by Passive, 2022 – 2031
Figure 108: Europe Sports Technology Market Value Share Analysis, by End-user, 2022
Figure 109: Europe Sports Technology Market Value Share Analysis, by End-user, 2031
Figure 110: Europe Sports Technology Market Absolute Opportunity (US$ Bn), by Coaches, 2022 – 2031
Figure 111: Europe Sports Technology Market Absolute Opportunity (US$ Bn), by Clubs, 2022 – 2031
Figure 112: Europe Sports Technology Market Absolute Opportunity (US$ Bn), by Leagues, 2022 – 2031
Figure 113: Europe Sports Technology Market Absolute Opportunity (US$ Bn), by Sports Associations, 2022 – 2031
Figure 114: Europe Sports Technology Market Absolute Opportunity (US$ Bn), by Others, 2022 – 2031
Figure 115: Europe Sports Technology Market Value Share Analysis, by Country, 2022
Figure 116: Europe Sports Technology Market Value Share Analysis, by Country, 2031
Figure 117: Germany Sports Technology Market Opportunity Growth Analysis (US$ Bn) Forecast, 2022 – 2031
Figure 118: U.K. Sports Technology Market Opportunity Growth Analysis (US$ Bn) Forecast, 2022 – 2031
Figure 119: France Sports Technology Market Opportunity Growth Analysis (US$ Bn) Forecast, 2022 – 2031
Figure 120: Spain Sports Technology Market Opportunity Growth Analysis (US$ Bn) Forecast, 2022 – 2031
Figure 121: Italy Sports Technology Market Opportunity Growth Analysis (US$ Bn) Forecast, 2022 – 2031
Figure 122: Asia Pacific Sports Technology Market Revenue Opportunity Share, by Component
Figure 123: Asia Pacific Sports Technology Market Revenue Opportunity Share, by Sports
Figure 124: Asia Pacific Sports Technology Market Revenue Opportunity Share, by Application
Figure 125: Asia Pacific Sports Technology Market Revenue Opportunity Share, by End-user
Figure 126: Asia Pacific Sports Technology Market Revenue Opportunity Share, by Country and Sub-region
Figure 127: Asia Pacific Sports Technology Market Value Share Analysis, by Sports, 2022
Figure 128: Asia Pacific Sports Technology Market Value Share Analysis, by Sports, 2031
Figure 129: Asia Pacific Sports Technology Market Absolute Opportunity (US$ Bn), by Baseball, 2022 – 2031
Figure 130: Asia Pacific Sports Technology Market Absolute Opportunity (US$ Bn), by Basketball, 2022 – 2031
Figure 131: Asia Pacific Sports Technology Market Absolute Opportunity (US$ Bn), by Cricket, 2022 – 2031
Figure 132: Asia Pacific Sports Technology Market Absolute Opportunity (US$ Bn), by Cycling, 2022 – 2031
Figure 133: Asia Pacific Sports Technology Market Absolute Opportunity (US$ Bn), by Football, 2022 – 2031
Figure 134: Asia Pacific Sports Technology Market Absolute Opportunity (US$ Bn), by Golf, 2022 – 2031
Figure 135: Asia Pacific Sports Technology Market Absolute Opportunity (US$ Bn), by Rugby, 2022 – 2031
Figure 136: Asia Pacific Sports Technology Market Absolute Opportunity (US$ Bn), by Others, 2022 – 2031
Figure 137: Asia Pacific Sports Technology Market Value Share Analysis, by Component, 2022
Figure 138: Asia Pacific Sports Technology Market Value Share Analysis, by Component, 2031
Figure 139: Asia Pacific Sports Technology Market Absolute Opportunity (US$ Bn), by Wearable Devices & Sports Equipment, 2022 – 2031
Figure 140: Asia Pacific Sports Technology Market Absolute Opportunity (US$ Bn), by Software, 2022 – 2031
Figure 141: Asia Pacific Sports Technology Market Absolute Opportunity (US$ Bn), by Services, 2022 – 2031
Figure 142: Asia Pacific Sports Technology Market Value Share Analysis, by Application, 2022
Figure 143: Asia Pacific Sports Technology Market Value Share Analysis, by Application, 2031
Figure 144: Asia Pacific Sports Technology Market Absolute Opportunity (US$ Bn), by Active, 2022 – 2031
Figure 145: Asia Pacific Sports Technology Market Absolute Opportunity (US$ Bn), by Passive, 2022 – 2031
Figure 146: Asia Pacific Sports Technology Market Value Share Analysis, by End-user, 2022
Figure 147: Asia Pacific Sports Technology Market Value Share Analysis, by End-user, 2031
Figure 148: Asia Pacific Sports Technology Market Absolute Opportunity (US$ Bn), by Coaches, 2022 – 2031
Figure 149: Asia Pacific Sports Technology Market Absolute Opportunity (US$ Bn), by Clubs, 2022 – 2031
Figure 150: Asia Pacific Sports Technology Market Absolute Opportunity (US$ Bn), by Leagues, 2022 – 2031
Figure 151: Asia Pacific Sports Technology Market Absolute Opportunity (US$ Bn), by Sports Associations, 2022 – 2031
Figure 152: Asia Pacific Sports Technology Market Absolute Opportunity (US$ Bn), by Others, 2022 – 2031
Figure 153: Asia Pacific Sports Technology Market Value Share Analysis, by Country, 2022
Figure 154: Asia Pacific Sports Technology Market Value Share Analysis, by Country, 2031
Figure 155: China Sports Technology Market Opportunity Growth Analysis (US$ Bn) Forecast, 2022 – 2031
Figure 156: India Sports Technology Market Opportunity Growth Analysis (US$ Bn) Forecast, 2022 – 2031
Figure 157: Japan Sports Technology Market Opportunity Growth Analysis (US$ Bn) Forecast, 2022 – 2031
Figure 158: ASEAN Sports Technology Market Opportunity Growth Analysis (US$ Bn) Forecast, 2022 – 2031
Figure 159: Middle East & Africa Sports Technology Market Revenue Opportunity Share, by Sports
Figure 160: Middle East & Africa Sports Technology Market Revenue Opportunity Share, by Component
Figure 161: Middle East & Africa Sports Technology Market Revenue Opportunity Share, by Application
Figure 162: Middle East & Africa Sports Technology Market Revenue Opportunity Share, by End-user
Figure 163: Middle East & Africa Sports Technology Market Revenue Opportunity Share, by Country and Sub-region
Figure 164: Middle East & Africa Sports Technology Market Value Share Analysis, by Sports, 2022
Figure 165: Middle East & Africa Sports Technology Market Value Share Analysis, by Sports, 2031
Figure 166: Middle East & Africa Sports Technology Market Absolute Opportunity (US$ Bn), by Baseball, 2022 – 2031
Figure 167: Middle East & Africa Sports Technology Market Absolute Opportunity (US$ Bn), by Basketball, 2022 – 2031
Figure 168: Middle East & Africa Sports Technology Market Absolute Opportunity (US$ Bn), by Cricket, 2022 – 2031
Figure 169: Middle East & Africa Sports Technology Market Absolute Opportunity (US$ Bn), by Cycling, 2022 – 2031
Figure 170: Middle East & Africa Sports Technology Market Absolute Opportunity (US$ Bn), by Football, 2022 – 2031
Figure 171: Middle East & Africa Sports Technology Market Absolute Opportunity (US$ Bn), by Golf, 2022 – 2031
Figure 172: Middle East & Africa Sports Technology Market Absolute Opportunity (US$ Bn), by Rugby, 2022 – 2031
Figure 173: Middle East & Africa Sports Technology Market Absolute Opportunity (US$ Bn), by Others, 2022 – 2031
Figure 174: Middle East & Africa Sports Technology Market Value Share Analysis, by Component, 2022
Figure 175: Middle East & Africa Sports Technology Market Value Share Analysis, by Component, 2031
Figure 176: Middle East & Africa Sports Technology Market Absolute Opportunity (US$ Bn), by Wearable Devices & Sports Equipment, 2022 – 2031
Figure 177: Middle East & Africa Sports Technology Market Absolute Opportunity (US$ Bn), by Software, 2022 – 2031
Figure 178: Middle East & Africa Sports Technology Market Absolute Opportunity (US$ Bn), by Services, 2022 – 2031
Figure 179: Middle East & Africa Sports Technology Market Value Share Analysis, by Application, 2022
Figure 180: Middle East & Africa Sports Technology Market Value Share Analysis, by Application, 2031
Figure 181: Middle East & Africa Sports Technology Market Absolute Opportunity (US$ Bn), by Active, 2022 – 2031
Figure 182: Middle East & Africa Sports Technology Market Absolute Opportunity (US$ Bn), by Passive, 2022 – 2031
Figure 183: Middle East & Africa Sports Technology Market Value Share Analysis, by End-user, 2022
Figure 184: Middle East & Africa Sports Technology Market Value Share Analysis, by End-user, 2031
Figure 185: Middle East & Africa Sports Technology Market Absolute Opportunity (US$ Bn), by Coaches, 2022 – 2031
Figure 186: Middle East & Africa Sports Technology Market Absolute Opportunity (US$ Bn), by Clubs, 2022 – 2031
Figure 187: Middle East & Africa Sports Technology Market Absolute Opportunity (US$ Bn), by Leagues, 2022 – 2031
Figure 188: Middle East & Africa Sports Technology Market Absolute Opportunity (US$ Bn), by Sports Associations, 2022 – 2031
Figure 189: Middle East & Africa Sports Technology Market Absolute Opportunity (US$ Bn), by Others, 2022 – 2031
Figure 190: Middle East & Africa Sports Technology Market Value Share Analysis, by Country, 2022
Figure 191: Middle East & Africa Sports Technology Market Value Share Analysis, by Country, 2031
Figure 192: Saudi Arabia Sports Technology Market Opportunity Growth Analysis (US$ Bn) Forecast, 2022 – 2031
Figure 193: UAE Sports Technology Market Opportunity Growth Analysis (US$ Bn) Forecast, 2022 – 2031
Figure 194: South Africa Sports Technology Market Opportunity Growth Analysis (US$ Bn) Forecast, 2022 – 2031
Figure 195: South America Sports Technology Market Revenue Opportunity Share, by Sports
Figure 196: South America Sports Technology Market Revenue Opportunity Share, by Component
Figure 197: South America Sports Technology Market Revenue Opportunity Share, by Application
Figure 198: South America Sports Technology Market Revenue Opportunity Share, by End-user
Figure 199: South America Sports Technology Market Revenue Opportunity Share, by Country and Sub-region
Figure 200: South America Sports Technology Market Value Share Analysis, by Sports, 2022
Figure 201: South America Sports Technology Market Value Share Analysis, by Sports, 2031
Figure 202: South America Sports Technology Market Absolute Opportunity (US$ Bn), by Baseball, 2022 – 2031
Figure 203: South America Sports Technology Market Absolute Opportunity (US$ Bn), by Basketball, 2022 – 2031
Figure 204: South America Sports Technology Market Absolute Opportunity (US$ Bn), by Cricket, 2022 – 2031
Figure 205: South America Sports Technology Market Absolute Opportunity (US$ Bn), by Cycling, 2022 – 2031
Figure 206: South America Sports Technology Market Absolute Opportunity (US$ Bn), by Football, 2022 – 2031
Figure 207: South America Sports Technology Market Absolute Opportunity (US$ Bn), by Golf, 2022 – 2031
Figure 208: South America Sports Technology Market Absolute Opportunity (US$ Bn), by Rugby, 2022 – 2031
Figure 209: South America Sports Technology Market Absolute Opportunity (US$ Bn), by Others, 2022 – 2031
Figure 210: South America Sports Technology Market Value Share Analysis, by Component, 2022
Figure 211: South America Sports Technology Market Value Share Analysis, by Component, 2031
Figure 212: South America Sports Technology Market Absolute Opportunity (US$ Bn), by Wearable Devices & Sports Equipment, 2022 – 2031
Figure 213: South America Sports Technology Market Absolute Opportunity (US$ Bn), by Software, 2022 – 2031
Figure 214: South America Sports Technology Market Absolute Opportunity (US$ Bn), by Services, 2022 – 2031
Figure 215: South America Sports Technology Market Value Share Analysis, by Application, 2022
Figure 216: South America Sports Technology Market Value Share Analysis, by Application, 2031
Figure 217: South America Sports Technology Market Absolute Opportunity (US$ Bn), by Active, 2022 – 2031
Figure 218: South America Sports Technology Market Absolute Opportunity (US$ Bn), by Passive, 2022 – 2031
Figure 219: South America Sports Technology Market Value Share Analysis, by End-user, 2022
Figure 220: South America Sports Technology Market Value Share Analysis, by End-user, 2031
Figure 221: South America Sports Technology Market Absolute Opportunity (US$ Bn), by Coaches, 2022 – 2031
Figure 222: South America Sports Technology Market Absolute Opportunity (US$ Bn), by Clubs, 2022 – 2031
Figure 223: South America Sports Technology Market Absolute Opportunity (US$ Bn), by Leagues, 2022 – 2031
Figure 224: South America Sports Technology Market Absolute Opportunity (US$ Bn), by Sports Associations, 2022 – 2031
Figure 225: South America Sports Technology Market Absolute Opportunity (US$ Bn), by Others, 2022 – 2031
Figure 226: South America Sports Technology Market Value Share Analysis, by Country, 2022
Figure 227: South America Sports Technology Market Value Share Analysis, by Country, 2031
Figure 228: Brazil Sports Technology Market Opportunity Growth Analysis (US$ Bn) Forecast, 2022 – 2031
Figure 229: Argentina Sports Technology Market Opportunity Growth Analysis (US$ Bn) Forecast, 2022 – 2031
Copyright © Transparency Market Research, Inc. All Rights reserved
Trust Online

Sports Technology Market