
Reports
Reports
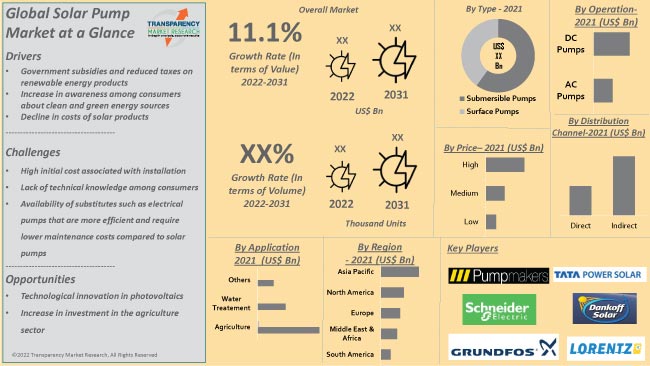
Analysts’ Viewpoint on Solar Pumps Market Scenario
Rise in the demand for solar submersible pumps and smart solar pumps is driving the global solar pumps market. The smart solar photovoltaic water pump (SSPWP) consists of a photovoltaic panel, solar charger control, accumulator, inverter, water pump, mobile phone, and alarm. The solar cell in the photovoltaic panel is exposed to sunlight to produce electricity that is supplied to water pumps in order to irrigate farms. This system is connected to a mobile phone so that farmers can automatically control the irrigation of their farms. The solar pumps market is expected to witness an increase in product diversity as several international companies with R&D capabilities are expected to enter the arena of solar pump manufacturing, aiming to obtain maximal market share. Companies operating in the market are also introducing technologically advanced DC solar pumps to enhance their market share post the COVID-19 pandemic.
Solar pumps use solar energy to irrigate crops, water livestock, or provide potable drinking water. Solar-powered pumps run on electricity generated by photovoltaic (PV) panels or the radiated thermal energy available from sunlight, as opposed to grid electricity or diesel-run pumps. Solar pumps are robust, easy to install, and usually require low or minimum maintenance. The lifespan of solar pumping systems is a maximum of 20 years. These systems are primarily used where a consistent power supply is not accessible. Solar-powered pumps are more cost-effective in operation, offer lower maintenance costs, and have a lesser environmental impact than pumps powered by an internal combustion engine.
The use of smart solar pumps is expected to be high in rural areas where the penetration of electricity is limited. Solar water pumps provide a reliable, safe, and adequate water supply in remote locations. Use of solar pump PV technology provides several environmental benefits as compared to traditional technologies; however, care should be taken that the installation of solar water pumps does not increase the use of groundwater.
Solar water pumps contribute to social development in several ways. A reliable and clean water supply is an essential need; however, a large number of people, currently, lack this basic provision. Solar water pumps are often a cost-effective preferred technology for remote locations beyond the reach of conventional power lines.
Solar water pumps also offer protection to the environment by replacing either diesel-powered or grid-based systems. Diesel generators emit CO2 during operation and grid-based electricity is usually generated using coal, oil, or natural gas, which also emit considerable quantities of CO2. Solar-based water pump systems do not result in greenhouse gas emissions. Extensive usage of solar water pumps can, therefore, lead to a substantial decrease in greenhouse gas emissions. These factors are contributing to the growth of the solar water pumps market size across the globe.
Increase in the usage of solar pump for agriculture purposes is driving the solar pumps global market. Solar pumps require less labor and maintenance as compared to fossil fuel pumps. These pumps can reduce the amount of labor and time that is needed to irrigate crops. PV systems generally require only 14% of the labor hours that are consumed while using diesel generators. Thus, the demand for low-cost and low-maintenance products is rising in countries such as India, China, and Bangladesh where agriculture is practiced by a large group of low-income farmers.
Solar PV systems, once manufactured, are closed systems; during operation and electricity production they neither require inputs such as fuel nor generate any outputs such as solids, liquids, or gases (apart from electricity). Furthermore, 80% of the bulk material in solar panels is recyclable; recycling solar panels is already economically viable. This long-term economic advantage makes solar water pumping more cost-effective than conventional pumping systems such as diesel-powered pumps. A 2006 study investigating the economics of solar water pumps in seven countries (Argentina, Brazil, Indonesia, Jordan, the Philippines, Tunisia, and Zimbabwe) reported that solar water pump systems had a cost advantage over diesel pumping systems in the power range of up to 4 kWp. Likewise, a study by the Bureau of Land Management at Battle Mountain, Nevada, U.S., showed that certain PV systems cost only 64% over 20 years as compared to a comparable diesel generator system over 10 years. Governments in several countries, such as India, are offering subsidies to farmers and solar equipment manufacturers. Such initiatives are propelling the solar pumps market.
Asia Pacific is expected to hold dominant position in the global solar pumps market during the forecast period. Agriculture is a major revenue-generating sector in the region. Manufacturers operating in the region are focused on maximizing the potential of solar pumps for irrigation and other agricultural duties. Strategies of manufacturers have changed as a result of government initiatives to boost the adoption of renewable energy in order to promote the sustainable development of countries in Asia Pacific.
The market in North America and Europe is anticipated to grow at a considerable pace in the near future, owing to rise in the demand for solar pumps in these regions. Countries such as the U.S., Canada, Germany, France, the U.K., and Italy are shifting from fossil fuel energy to renewable energy sources in order to contribute to a sustainable environment. Middle East & Africa is an emerging market for solar pumps due to the decrease in the cost of PV panels and solar-powered water pumps and several advancements in PV technology.
Prominent solar pump manufacturers are investing significantly in R&D activities to launch new products. Key players in the market are also adopting M&A strategies to enhance their market share. Bernt Lorentz GmbH, Bright Solar Ltd., C.R.I. Pumps Private Limited, Dankoff Solar, Franklin Electric, Grundfos, K.S.B. Ltd., PM Pumpmakers GmbH, Schneider Electric SE, and Tata Power Solar Systems Ltd are the prominent entities operating in the market.
Each of these players has been profiled in the solar pumps market report based on parameters such as company overview, financial overview, business strategies, product portfolio, business segments, and recent developments.
|
Attribute |
Detail |
|
Market Size Value in 2021 |
US$ 1.2 Bn |
|
Market Forecast Value in 2031 |
US$ 3.38 Bn |
|
Growth Rate (CAGR) |
11.1% |
|
Forecast Period |
2022–2031 |
|
Historical Data Available for |
2017–2020 |
|
Quantitative Units |
US$ Bn for Value & Thousand Units for Volume |
|
Market Analysis |
Includes cross segment analysis at regional as well as country level. Furthermore, qualitative analysis includes drivers, restraints, opportunities, key trends, Porter’s Five Forces analysis, value chain analysis, and key trend analysis. |
|
Competition Landscape |
|
|
Format |
Electronic (PDF) + Excel |
|
Market Segmentation |
|
|
Region Covered |
|
|
Countries Covered |
|
|
Companies Profiled |
|
|
Customization Scope |
Available upon request |
|
Pricing |
Available upon request |
The global solar pumps market was valued at US$ 1.2 Bn in 2021.
The global solar pumps market is projected to advance at a CAGR of 11.1% from 2022 to 2031.
Increase in demand for clean energy and rise in adoption of solar pumps in the agriculture sector in emerging economies.
The submersible pumps segment accounted for significant share of the global market in 2021.
Asia Pacific is likely to be one of the lucrative markets during the forecast period.
Bernt Lorentz GmbH, Bright Solar Ltd., C.R.I. Pumps Private Limited, Dankoff Solar, Franklin Electric, Grundfos, K.S.B. Ltd., PM Pumpmakers GmbH, Schneider Electric SE, and Tata Power Solar Systems Ltd.
1. Preface
1.1. Market Definition and Scope
1.2. Market Segmentation
1.3. Key Research Objectives
1.4. Research Highlights
2. Assumptions
3. Research Methodology
4. Executive Summary
5. Market Overview
5.1. Regional Snapshot
5.2. Market Dynamics
5.2.1. Drivers
5.2.2. Restraints
5.2.3. Opportunities
5.3. Key Trends Analysis
5.3.1. Demand Side Analysis
5.3.2. Supply Side Analysis
5.4. Key Market Indicators
5.5. Porter’s Five Forces Analysis
5.6. Value Chain Analysis
5.7. Industry SWOT Analysis
5.8. Technological Overview Analysis
5.9. Standards & Regulations
5.10. Global Solar Pumps Market Analysis and Forecast, 2017 - 2031
5.10.1. Market Revenue Projections (US$ Million)
5.10.2. Market Revenue Projections (Thousand Units)
6. Global Solar Pumps Market Analysis and Forecast, by Type
6.1. Solar Pumps Market (US$ Mn and Thousand Units) Forecast, by Type, 2017 - 2031
6.1.1. Submersible Pumps
6.1.2. Surface Pumps
6.2. Incremental Opportunity, by Type
7. Global Solar Pumps Market Analysis and Forecast, by Operation
7.1. Solar Pumps Market (US$ Mn and Thousand Units) Forecast, by Operation, 2017 - 2031
7.1.1. AC Pumps
7.1.2. DC Pumps
7.2. Incremental Opportunity, by Operation
8. Global Solar Pumps Market Analysis and Forecast, by Price
8.1. Solar Pumps Market (US$ Mn and Thousand Units) Forecast, by Price, 2017 - 2031
8.1.1. Low
8.1.2. Medium
8.1.3. High
8.2. Incremental Opportunity, by Price
9. Global Solar Pumps Market Analysis and Forecast, by Application
9.1. Solar Pumps Market (US$ Mn and Thousand Units) Forecast, by Application, 2017 - 2031
9.1.1. Agriculture
9.1.2. Water Treatment
9.1.3. Others (water for livestock, housing applications, etc.)
9.2. Incremental Opportunity, by Application
10. Global Solar Pumps Market Analysis and Forecast, by Distribution Channel
10.1. Solar Pumps Market (US$ Mn and Thousand Units), by Distribution Channel, 2017 - 2031
10.1.1. Direct
10.1.2. Indirect
10.2. Incremental Opportunity, by Distribution Channel
11. Global Solar Pumps Market Analysis and Forecast, by Region
11.1. Solar Pumps Market (US$ Mn and Thousand Units), Region, 2017 - 2031
11.1.1. North America
11.1.2. Europe
11.1.3. Asia Pacific
11.1.4. Middle East & Africa
11.1.5. South America
11.2. Incremental Opportunity, by Region
12. North America Solar Pumps Market Analysis and Forecast
12.1. Regional Snapshot
12.2. Price Trend Analysis
12.2.1. Weighted Average Selling Price (US$)
12.3. Key Trends Analysis
12.3.1. Demand Side
12.3.2. Supply Side
12.4. Key Supplier Analysis
12.5. Solar Pumps Market (US$ Mn and Thousand Units) Forecast, by Type, 2017 - 2031
12.5.1. Submersible Pumps
12.5.2. Surface Pumps
12.6. Solar Pumps Market (US$ Mn and Thousand Units) Forecast, by Operation, 2017 - 2031
12.6.1. AC Pumps
12.6.2. DC Pumps
12.7. Solar Pumps Market (US$ Mn and Thousand Units) Forecast, by Price, 2017 - 2031
12.7.1. Low
12.7.2. Medium
12.7.3. High
12.8. Solar Pumps Market (US$ Mn and Thousand Units) Forecast, by Application, 2017 - 2031
12.8.1. Agriculture
12.8.2. Water Treatment
12.8.3. Others (water for livestock, housing applications, etc.)
12.9. Solar Pumps Market (US$ Mn and Thousand Units), by Distribution Channel, 2017 - 2031
12.9.1. Direct
12.9.2. Indirect
12.10. Solar Pumps Market (US$ Mn and Thousand Units) Forecast, by Country & Sub-region, 2017 - 2031
12.10.1. U.S.
12.10.2. Canada
12.10.3. Rest of North America
12.11. Incremental Opportunity Analysis
13. Europe Solar Pumps Market Analysis and Forecast
13.1. Regional Snapshot
13.2. Price Trend Analysis
13.2.1. Weighted Average Selling Price (US$)
13.3. Key Trends Analysis
13.3.1. Demand Side
13.3.2. Supply Side
13.4. Key Supplier Analysis
13.5. Solar Pumps Market (US$ Mn and Thousand Units) Forecast, by Type, 2017 - 2031
13.5.1. Submersible Pumps
13.5.2. Surface Pumps
13.6. Solar Pumps Market (US$ Mn and Thousand Units) Forecast, by Operation, 2017 - 2031
13.6.1. AC Pumps
13.6.2. DC Pumps
13.7. Solar Pumps Market (US$ Mn and Thousand Units) Forecast, by Price, 2017 - 2031
13.7.1. Low
13.7.2. Medium
13.7.3. High
13.8. Solar Pumps Market (US$ Mn and Thousand Units) Forecast, by Application, 2017 - 2031
13.8.1. Agriculture
13.8.2. Water Treatment
13.8.3. Others (water for livestock, housing applications, etc.)
13.9. Solar Pumps Market (US$ Mn and Thousand Units), by Distribution Channel, 2017 - 2031
13.9.1. Direct
13.9.2. Indirect
13.10. Solar Pumps Market (US$ Mn and Thousand Units) Forecast, by Country & Sub-region, 2017 - 2031
13.10.1. U.K
13.10.2. Germany
13.10.3. France
13.10.4. Rest of Europe
13.11. Incremental Opportunity Analysis
14. Asia Pacific Solar Pumps Market Analysis and Forecast
14.1. Regional Snapshot
14.2. Price Trend Analysis
14.2.1. Weighted Average Selling Price (US$)
14.3. Key Trends Analysis
14.3.1. Demand Side
14.3.2. Supply Side
14.4. Key Supplier Analysis
14.5. Solar Pumps Market (US$ Mn and Thousand Units) Forecast, by Type, 2017 - 2031
14.5.1. Submersible Pumps
14.5.2. Surface Pumps
14.6. Solar Pumps Market (US$ Mn and Thousand Units) Forecast, by Operation, 2017 - 2031
14.6.1. AC Pumps
14.6.2. DC Pumps
14.7. Solar Pumps Market (US$ Mn and Thousand Units) Forecast, by Price, 2017 - 2031
14.7.1. Low
14.7.2. Medium
14.7.3. High
14.8. Solar Pumps Market (US$ Mn and Thousand Units) Forecast, by Application, 2017 - 2031
14.8.1. Agriculture
14.8.2. Water Treatment
14.8.3. Others (water for livestock, housing applications, etc.)
14.9. Solar Pumps Market (US$ Mn and Thousand Units), by Distribution Channel, 2017 - 2031
14.9.1. Direct
14.9.2. Indirect
14.10. Solar Pumps Market (US$ Mn and Thousand Units) Forecast, by Country & Sub-region, 2017 - 2031
14.10.1. China
14.10.2. India
14.10.3. Japan
14.10.4. Rest of Asia Pacific
14.11. Incremental Opportunity Analysis
15. Middle East & Africa Solar Pumps Market Analysis and Forecast
15.1. Regional Snapshot
15.2. Price Trend Analysis
15.2.1. Weighted Average Selling Price (US$)
15.3. Key Trends Analysis
15.3.1. Demand Side
15.3.2. Supply Side
15.4. Key Supplier Analysis
15.5. Solar Pumps Market (US$ Mn and Thousand Units) Forecast, by Type, 2017 - 2031
15.5.1. Submersible Pumps
15.5.2. Surface Pumps
15.6. Solar Pumps Market (US$ Mn and Thousand Units) Forecast, by Operation, 2017 - 2031
15.6.1. AC Pumps
15.6.2. DC Pumps
15.7. Solar Pumps Market (US$ Mn and Thousand Units) Forecast, by Price, 2017 - 2031
15.7.1. Low
15.7.2. Medium
15.7.3. High
15.8. Solar Pumps Market (US$ Mn and Thousand Units) Forecast, by Application, 2017 - 2031
15.8.1. Agriculture
15.8.2. Water Treatment
15.8.3. Others (water for livestock, housing applications, etc.)
15.9. Solar Pumps Market (US$ Mn and Thousand Units), by Distribution Channel, 2017 - 2031
15.9.1. Direct
15.9.2. Indirect
15.10. Solar Pumps Market (US$ Mn and Thousand Units) Forecast, by Country & Sub-region, 2017 - 2031
15.10.1. GCC
15.10.2. South Africa
15.10.3. Rest of Middle East & Africa
15.11. Incremental Opportunity Analysis
16. South America Solar Pumps Market Analysis and Forecast
16.1. Regional Snapshot
16.2. Price Trend Analysis
16.2.1. Weighted Average Selling Price (US$)
16.3. Key Trends Analysis
16.3.1. Demand Side
16.3.2. Supply Side
16.4. Key Supplier Analysis
16.5. Solar Pumps Market (US$ Mn and Thousand Units) Forecast, by Type, 2017 - 2031
16.5.1. Submersible Pumps
16.5.2. Surface Pumps
16.6. Solar Pumps Market (US$ Mn and Thousand Units) Forecast, by Operation, 2017 - 2031
16.6.1. AC Pumps
16.6.2. DC Pumps
16.7. Solar Pumps Market (US$ Mn and Thousand Units) Forecast, by Price, 2017 - 2031
16.7.1. Low
16.7.2. Medium
16.7.3. High
16.8. Solar Pumps Market (US$ Mn and Thousand Units) Forecast, by Application, 2017 - 2031
16.8.1. Agriculture
16.8.2. Water Treatment
16.8.3. Others (water for livestock, housing applications, etc.)
16.9. Solar Pumps Market (US$ Mn and Thousand Units), by Distribution Channel, 2017 - 2031
16.9.1. Direct
16.9.2. Indirect
16.10. Solar Pumps Market (US$ Mn and Thousand Units) Forecast, by Country & Sub-region, 2017 - 2031
16.10.1. Brazil
16.10.2. Rest of South America
16.11. Incremental Opportunity Analysis
17. Competition Landscape
17.1. Market Player – Competition Dashboard
17.2. Market Revenue Share Analysis (%), By Company, (2021)
17.3. Company Profiles (Details – Company Overview, Sales Area/Geographical Presence, Revenue, Strategy & Business Overview)
17.3.1. Bernt Lorentz GmbH
17.3.1.1. Company Overview
17.3.1.2. Sales Area/Geographical Presence
17.3.1.3. Revenue
17.3.1.4. Strategy & Business Overview
17.3.2. Bright Solar Ltd.
17.3.2.1. Company Overview
17.3.2.2. Sales Area/Geographical Presence
17.3.2.3. Revenue
17.3.2.4. Strategy & Business Overview
17.3.3. C.R.I. Pumps Private Limited
17.3.3.1. Company Overview
17.3.3.2. Sales Area/Geographical Presence
17.3.3.3. Revenue
17.3.3.4. Strategy & Business Overview
17.3.4. Dankoff Solar
17.3.4.1. Company Overview
17.3.4.2. Sales Area/Geographical Presence
17.3.4.3. Revenue
17.3.4.4. Strategy & Business Overview
17.3.5. Franklin Electric
17.3.5.1. Company Overview
17.3.5.2. Sales Area/Geographical Presence
17.3.5.3. Revenue
17.3.5.4. Strategy & Business Overview
17.3.6. Grundfos
17.3.6.1. Company Overview
17.3.6.2. Sales Area/Geographical Presence
17.3.6.3. Revenue
17.3.6.4. Strategy & Business Overview
17.3.7. K.S.B. Ltd.
17.3.7.1. Company Overview
17.3.7.2. Sales Area/Geographical Presence
17.3.7.3. Revenue
17.3.7.4. Strategy & Business Overview
17.3.8. PM Pumpmakers GmbH
17.3.8.1. Company Overview
17.3.8.2. Sales Area/Geographical Presence
17.3.8.3. Revenue
17.3.8.4. Strategy & Business Overview
17.3.9. Schneider Electric SE
17.3.9.1. Company Overview
17.3.9.2. Sales Area/Geographical Presence
17.3.9.3. Revenue
17.3.9.4. Strategy & Business Overview
17.3.10. Tata Power Solar Systems Ltd.
17.3.10.1. Company Overview
17.3.10.2. Sales Area/Geographical Presence
17.3.10.3. Revenue
17.3.10.4. Strategy & Business Overview
18. Key Takeaway
18.1. Identification of Potential Market Spaces
18.1.1. Type
18.1.2. Operation
18.1.3. Price
18.1.4. Application
18.1.5. Distribution Channel
18.1.6. Region
18.1.7. Prevailing Market Risks
List of Figures
Table 1: Global Solar Pumps Market Volume (Thousand Units), by Type, 2017 - 2031
Table 2: Global Solar Pumps Market Value (US$ Mn), by Type, 2017 - 2031
Table 3: Global Solar Pumps Market Volume (Thousand Units), by Operation, 2017 - 2031
Table 4: Global Solar Pumps Market Value (US$ Mn), by Operation, 2017 - 2031
Table 5: Global Solar Pumps Market Volume (Thousand Units), by Price, 2017 - 2031
Table 6: Global Solar Pumps Market Value (US$ Mn), by Price, 2017 - 2031
Table 7: Global Solar Pumps Market Volume (Thousand Units), by Application, 2017 - 2031
Table 8: Global Solar Pumps Market Value (US$ Mn), by Application, 2017 - 2031
Table 9: Global Solar Pumps Market Volume (Thousand Units), by Distribution Channel, 2017 - 2031
Table 10: Global Solar Pumps Market Value (US$ Mn), by Distribution Channel, 2017 - 2031
Table 11: Global Solar Pumps Market Volume (Thousand Units), by Region, 2017 - 2031
Table 12: Global Solar Pumps Market Value (US$ Mn), by Region, 2017 - 2031
Table 13: North America Solar Pumps Market Volume (Thousand Units), by Type, 2017 - 2031
Table 14: North America Solar Pumps Market Value (US$ Mn), by Type, 2017 - 2031
Table 15: North America Solar Pumps Market Volume (Thousand Units), by Operation, 2017 - 2031
Table 16: North America Solar Pumps Market Value (US$ Mn), by Operation, 2017 - 2031
Table 17: North America Solar Pumps Market Volume (Thousand Units), by Price, 2017 - 2031
Table 18: North America Solar Pumps Market Value (US$ Mn), by Price, 2017 - 2031
Table 19: North America Solar Pumps Market Volume (Thousand Units), by Application, 2017 - 2031
Table 20: North America Solar Pumps Market Value (US$ Mn), by Application, 2017 - 2031
Table 21: North America Solar Pumps Market Volume (Thousand Units), by Distribution Channel,
Table 22: North America Solar Pumps Market Value (US$ Mn), by Distribution Channel, 2017 - 2031
Table 23: North America Solar Pumps Market Volume (Thousand Units), by Country & Sub-region, 2017 - 2031
Table 24: North America Solar Pumps Market Value (US$ Mn), by Country & Sub-region, 2017 - 2031
Table 25: Europe Solar Pumps Market Volume (Thousand Units), by Type, 2017 - 2031
Table 26: Europe Solar Pumps Market Value (US$ Mn), by Type, 2017 - 2031
Table 27: Europe Solar Pumps Market Volume (Thousand Units), by Operation, 2017 - 2031
Table 28: Europe Solar Pumps Market Value (US$ Mn), by Operation, 2017 - 2031
Table 29: Europe Solar Pumps Market Volume (Thousand Units), by Price, 2017 - 2031
Table 30: Europe Solar Pumps Market Value (US$ Mn), by Price, 2017 - 2031
Table 31: Europe Solar Pumps Market Volume (Thousand Units), by Application, 2017 - 2031
Table 32: Europe Solar Pumps Market Value (US$ Mn), by Application, 2017 - 2031
Table 33: Europe Solar Pumps Market Volume (Thousand Units), by Distribution Channel, 2017 - 2031
Table 34: Europe Solar Pumps Market Value (US$ Mn), by Distribution Channel, 2017 - 2031
Table 35: Europe Solar Pumps Market Volume (Thousand Units), by Country & Sub-region, 2017 - 2031
Table 36: Europe Solar Pumps Market Value (US$ Mn), by Country & Sub-region, 2017 - 2031
Table 37: APAC Solar Pumps Market Volume (Thousand Units), by Type, 2017 - 2031
Table 38: APAC Solar Pumps Market Value (US$ Mn), by Type, 2017 - 2031
Table 39: APAC Solar Pumps Market Volume (Thousand Units), by Operation, 2017 - 2031
Table 40: APAC Solar Pumps Market Value (US$ Mn), by Operation, 2017 - 2031
Table 41: APAC Solar Pumps Market Volume (Thousand Units), by Price, 2017 - 2031
Table 42: APAC Solar Pumps Market Value (US$ Mn), by Price, 2017 - 2031
Table 43: APAC Solar Pumps Market Volume (Thousand Units), by Application, 2017 - 2031
Table 44: APAC Solar Pumps Market Value (US$ Mn), by Application, 2017 - 2031
Table 45: APAC Solar Pumps Market Volume (Thousand Units), by Distribution Channel, 2017 - 2031
Table 46: APAC Solar Pumps Market Value (US$ Mn), by Distribution Channel, 2017 - 2031
Table 47: APAC Solar Pumps Market Volume (Thousand Units), by Country & Sub-region, 2017 - 2031
Table 48: APAC Solar Pumps Market Value (US$ Mn), by Country & Sub-region, 2017 - 2031
Table 49: MEA Solar Pumps Market Volume (Thousand Units), by Type, 2017 - 2031
Table 50: MEA Solar Pumps Market Value (US$ Mn), by Type, 2017 - 2031
Table 51: MEA Solar Pumps Market Volume (Thousand Units), by Operation, 2017 - 2031
Table 52: MEA Solar Pumps Market Value (US$ Mn), by Operation, 2017 - 2031
Table 53: MEA Solar Pumps Market Volume (Thousand Units), by Price, 2017 - 2031
Table 54: MEA Solar Pumps Market Value (US$ Mn), by Price, 2017 - 2031
Table 55: MEA Solar Pumps Market Volume (Thousand Units), by Application, 2017 - 2031
Table 56: MEA Solar Pumps Market Value (US$ Mn), by Application, 2017 - 2031
Table 57: MEA Solar Pumps Market Volume (Thousand Units), by Distribution Channel, 2017 - 2031
Table 58: MEA Solar Pumps Market Value (US$ Mn), by Distribution Channel, 2017 - 2031
Table 59: MEA Solar Pumps Market Volume (Thousand Units), by Country & Sub-region, 2017 - 2031
Table 60: MEA Solar Pumps Market Value (US$ Mn), by Country & Sub-region, 2017 - 2031
Table 61: South America Solar Pumps Market Volume (Thousand Units), by Type, 2017 - 2031
Table 62: South America Solar Pumps Market Value (US$ Mn), by Type, 2017 - 2031
Table 63: South America Solar Pumps Market Volume (Thousand Units), by Operation, 2017 - 2031
Table 64: South America Solar Pumps Market Value (US$ Mn), by Operation, 2017 - 2031
Table 65: South America Solar Pumps Market Volume (Thousand Units), by Price, 2017 - 2031
Table 66: South America Solar Pumps Market Value (US$ Mn), by Price, 2017 - 2031
Table 67: South America Solar Pumps Market Volume (Thousand Units), by Application, 2017 - 2031
Table 68: South America Solar Pumps Market Value (US$ Mn), by Application, 2017 - 2031
Table 69: South America Solar Pumps Market Volume (Thousand Units), by Distribution Channel, 2017 - 2031
Table 70: South America Solar Pumps Market Value (US$ Mn), by Distribution Channel, 2017 - 2031
Table 71: South America Solar Pumps Market Volume (Thousand Units), by Country & Sub-region, 2017 - 2031
Table 72: South America Solar Pumps Market Value (US$ Mn), by Country & Sub-region, 2017 - 2031
List of Figures
Figure 1: Global Solar Pumps Market Volume (Thousand Units), by Type, 2017 - 2031
Figure 2: Global Solar Pumps Market Value (US$ Mn), by Type, 2017 - 2031
Figure 3: Global Solar Pumps Market Incremental Opportunity by Type, Forecast 2022 - 2031
Figure 4: Global Solar Pumps Market Volume (Thousand Units), by Operation, 2017 - 2031
Figure 5: Global Solar Pumps Market Value (US$ Mn), by Operation, 2017 - 2031
Figure 6: Global Solar Pumps Market Incremental Opportunity by Operation, Forecast 2022 - 2031
Figure 7: Global Solar Pumps Market Volume (Thousand Units), by Price, 2017 - 2031
Figure 8: Global Solar Pumps Market Value (US$ Mn), by Price, 2017 - 2031
Figure 9: Global Solar Pumps Market Incremental Opportunity by Price, Forecast, 2022 - 2031
Figure 10: Global Solar Pumps Market Volume (Thousand Units), by Application, 2017 - 2031
Figure 11: Global Solar Pumps Market Value (US$ Mn), by Application, 2017 - 2031
Figure 12: Global Solar Pumps Market Incremental Opportunity by Application, Forecast 2022 - 2031
Figure 13: Global Solar Pumps Market Volume (Thousand Units), by Distribution Channel, 2017 - 2031
Figure 14: Global Solar Pumps Market Value (US$ Mn), by Distribution Channel, 2017 - 2031
Figure 15: Global Solar Pumps Market Incremental Opportunity by Distribution Channel, Forecast 2022 - 2031
Figure 16: Global Solar Pumps Market Volume (Thousand Units), by Region, 2017 - 2031
Figure 17: Global Solar Pumps Market Value (US$ Mn), by Region, 2017 - 2031
Figure 18: Global Solar Pumps Market Incremental Opportunity by Region, Forecast 2022 - 2031
Figure 19: North America Solar Pumps Market Volume (Thousand Units), by Type, 2017 - 2031
Figure 20: North America Solar Pumps Market Value (US$ Mn), by Type, 2017 - 2031
Figure 21: North America Solar Pumps Market Incremental Opportunity by Type, Forecast 2022 - 2031
Figure 22: North America Solar Pumps Market Volume (Thousand Units), by Operation, 2017 - 2031
Figure 23: North America Solar Pumps Market Value (US$ Mn), by Operation, 2017 - 2031
Figure 24: North America Solar Pumps Market Incremental Opportunity by Operation, Forecast 2022 - 2031
Figure 25: North America Solar Pumps Market Volume (Thousand Units), by Price, 2017 - 2031
Figure 26: North America Solar Pumps Market Value (US$ Mn), by Price, 2017 - 2031
Figure 27: North America Solar Pumps Market Incremental Opportunity by Price, Forecast, 2022 - 2031
Figure 28: North America Solar Pumps Market Volume (Thousand Units), by Application, 2017 - 2031
Figure 29: North America Solar Pumps Market Value (US$ Mn), by Application, 2017 - 2031
Figure 30: North America Solar Pumps Market Incremental Opportunity by Application, Forecast 2022 - 2031
Figure 31: North America Solar Pumps Market Volume (Thousand Units), by Distribution Channel, 2017 - 2031
Figure 32: North America Solar Pumps Market Value (US$ Mn), by Distribution Channel, 2017 - 2031
Figure 33: North America Solar Pumps Market Incremental Opportunity by Distribution Channel, Forecast 2022 - 2031
Figure 34: North America Solar Pumps Market Volume (Thousand Units), by Country & Sub-region, 2017 - 2031
Figure 35: North America Solar Pumps Market Value (US$ Mn), by Country & Sub-region, 2017 - 2031
Figure 36: North America Solar Pumps Market Incremental Opportunity by Country & Sub-region, Forecast 2022 - 2031
Figure 37: Europe Solar Pumps Market Volume (Thousand Units), by Type, 2017 - 2031
Figure 38: Europe Solar Pumps Market Value (US$ Mn), by Type, 2017 - 2031
Figure 39: Europe Solar Pumps Market Incremental Opportunity by Type, Forecast 2022 - 2031
Figure 40: Europe Solar Pumps Market Volume (Thousand Units), by Operation, 2017 - 2031
Figure 41: Europe Solar Pumps Market Value (US$ Mn), by Operation, 2017 - 2031
Figure 42: Europe Solar Pumps Market Incremental Opportunity by Operation, Forecast 2022 - 2031
Figure 43: Europe Solar Pumps Market Volume (Thousand Units), by Price, 2017 - 2031
Figure 44: Europe Solar Pumps Market Value (US$ Mn), by Price, 2017 - 2031
Figure 45: Europe Solar Pumps Market Incremental Opportunity by Price, Forecast, 2022 - 2031
Figure 46: Europe Solar Pumps Market Volume (Thousand Units), by Application, 2017 - 2031
Figure 47: Europe Solar Pumps Market Value (US$ Mn), by Application, 2017 - 2031
Figure 48: Europe Solar Pumps Market Incremental Opportunity by Application, Forecast 2022 - 2031
Figure 49: Europe Solar Pumps Market Volume (Thousand Units), by Distribution Channel, 2017 - 2031
Figure 50: Europe Solar Pumps Market Value (US$ Mn), by Distribution Channel, 2017 - 2031
Figure 51: Europe Solar Pumps Market Incremental Opportunity by Distribution Channel, Forecast 2022 - 2031
Figure 52: Europe Solar Pumps Market Volume (Thousand Units), by Country & Sub-region, 2017 - 2031
Figure 53: Europe Solar Pumps Market Value (US$ Mn), by Country & Sub-region, 2017 - 2031
Figure 54: Europe Solar Pumps Market Incremental Opportunity by Country & Sub-region, Forecast 2022 - 2031
Figure 55: APAC Solar Pumps Market Volume (Thousand Units), by Type, 2017 - 2031
Figure 56: APAC Solar Pumps Market Value (US$ Mn), by Type, 2017 - 2031
Figure 57: APAC Solar Pumps Market Incremental Opportunity by Type, Forecast 2022 - 2031
Figure 58: APAC Solar Pumps Market Volume (Thousand Units), by Operation, 2017 - 2031
Figure 59: APAC Solar Pumps Market Value (US$ Mn), by Operation, 2017 - 2031
Figure 60: APAC Solar Pumps Market Incremental Opportunity by Operation, Forecast 2022 - 2031
Figure 61: APAC Solar Pumps Market Volume (Thousand Units), by Price, 2017 - 2031
Figure 62: APAC Solar Pumps Market Value (US$ Mn), by Price, 2017 - 2031
Figure 63: APAC Solar Pumps Market Incremental Opportunity by Price, Forecast, 2022 - 2031
Figure 64: APAC Solar Pumps Market Volume (Thousand Units), by Application, 2017 - 2031
Figure 65: APAC Solar Pumps Market Value (US$ Mn), by Application, 2017 - 2031
Figure 66: APAC Solar Pumps Market Incremental Opportunity by Application, Forecast 2022 - 2031
Figure 67: APAC Solar Pumps Market Volume (Thousand Units), by Distribution Channel, 2017 - 2031
Figure 68: APAC Solar Pumps Market Value (US$ Mn), by Distribution Channel, 2017 - 2031
Figure 69: APAC Solar Pumps Market Incremental Opportunity by Distribution Channel, Forecast 2022 - 2031
Figure 70: APAC Solar Pumps Market Volume (Thousand Units), by Country & Sub-region, 2017 - 2031
Figure 71: APAC Solar Pumps Market Value (US$ Mn), by Country & Sub-region, 2017 - 2031
Figure 72: APAC Solar Pumps Market Incremental Opportunity by Country & Sub-region, Forecast 2022 - 2031
Figure 73: MEA Solar Pumps Market Volume (Thousand Units), by Type, 2017 - 2031
Figure 74: MEA Solar Pumps Market Value (US$ Mn), by Type, 2017 - 2031
Figure 75: MEA Solar Pumps Market Incremental Opportunity by Type, Forecast 2022 - 2031
Figure 76: MEA Solar Pumps Market Volume (Thousand Units), by Operation, 2017 - 2031
Figure 77: MEA Solar Pumps Market Value (US$ Mn), by Operation, 2017 - 2031
Figure 78: MEA Solar Pumps Market Incremental Opportunity by Operation, Forecast 2022 - 2031
Figure 79: MEA Solar Pumps Market Volume (Thousand Units), by Price, 2017 - 2031
Figure 80: MEA Solar Pumps Market Value (US$ Mn), by Price, 2017 - 2031
Figure 81: MEA Solar Pumps Market Incremental Opportunity by Price, Forecast, 2022 - 2031
Figure 82: MEA Solar Pumps Market Volume (Thousand Units), by Application, 2017 - 2031
Figure 83: MEA Solar Pumps Market Value (US$ Mn), by Application, 2017 - 2031
Figure 84: MEA Solar Pumps Market Incremental Opportunity by Application, Forecast 2022 - 2031
Figure 85: MEA Solar Pumps Market Volume (Thousand Units), by Distribution Channel, 2017 - 2031
Figure 86: MEA Solar Pumps Market Value (US$ Mn), by Distribution Channel, 2017 - 2031
Figure 87: MEA Solar Pumps Market Incremental Opportunity by Distribution Channel, Forecast 2022 - 2031
Figure 88: MEA Solar Pumps Market Volume (Thousand Units), by Country & Sub-region, 2017 - 2031
Figure 89: MEA Solar Pumps Market Value (US$ Mn), by Country & Sub-region, 2017 - 2031
Figure 90: MEA Solar Pumps Market Incremental Opportunity by Country & Sub-region, Forecast 2022 - 2031
Figure 91: South America Solar Pumps Market Volume (Thousand Units), by Type, 2017 - 2031
Figure 92: South America Solar Pumps Market Value (US$ Mn), by Type, 2017 - 2031
Figure 93: South America Solar Pumps Market Incremental Opportunity by Type, Forecast 2022 - 2031
Figure 94: South America Solar Pumps Market Volume (Thousand Units), by Operation, 2017 - 2031
Figure 95: South America Solar Pumps Market Value (US$ Mn), by Operation, 2017 - 2031
Figure 96: South America Solar Pumps Market Incremental Opportunity by Operation, Forecast 2022 - 2031
Figure 97: South America Solar Pumps Market Volume (Thousand Units), by Price, 2017 - 2031
Figure 98: South America Solar Pumps Market Value (US$ Mn), by Price, 2017 - 2031
Figure 99: South America Solar Pumps Market Incremental Opportunity by Price, Forecast, 2022 - 2031
Figure 100: South America Solar Pumps Market Volume (Thousand Units), by Application, 2017 - 2031
Figure 101: South America Solar Pumps Market Value (US$ Mn), by Application, 2017 - 2031
Figure 102: South America Solar Pumps Market Incremental Opportunity by Application, Forecast 2022 - 2031
Figure 103: South America Solar Pumps Market Volume (Thousand Units), by Distribution Channel, 2017 - 2031
Figure 104: South America Solar Pumps Market Value (US$ Mn), by Distribution Channel, 2017 - 2031
Figure 105: South America Solar Pumps Market Incremental Opportunity by Distribution Channel, Forecast 2022 - 2031
Figure 106: South America Solar Pumps Market Volume (Thousand Units), by Country & Sub-region, 2017 - 2031
Figure 107: South America Solar Pumps Market Value (US$ Mn), by Country & Sub-region, 2017 - 2031
Figure 108: South America Solar Pumps Market Incremental Opportunity by Country & Sub-region, Forecast 2022 - 2031
Copyright © Transparency Market Research, Inc. All Rights reserved
Trust Online

Solar Pumps Market