
Reports
Reports
Analysts’ Viewpoint on SMT Inspection Equipment Market Scenario
The semiconductor capital equipment industry has been growing continuously due to increase in demand for semiconductors among leading edge foundry and logic manufacturers to support computational power and connectivity for markets such as artificial intelligence (AI) and 5G wireless technology. Technological advancement in the semiconductor industry supports this multi-segmented market growth. Rapid growth in automotive and electronics industry is expected to drive the global SMT inspection equipment market during the forecast period. SMT manufacturing companies are developing 3D inspection equipment suitable for components such as QFP, mini transistors, and connectors. 3D systems are capable of inspecting the co-planarity of components, detecting lifted leads, and reducing false call rates. Demand for 3D AOI systems is expected to rise at a high CAGR in the overall inspection equipment market. Manufacturers should tap into incremental opportunities in high-speed and cost-efficient AOI technology to broaden their revenue streams.
Increase in need to install inspection systems in electronic assembly lines due to changes in size and density of components is expected to drive the global SMT inspection equipment market during the forecast period. Earlier, bigger size of components allowed operators to carry out inspection without any hitches. However, component sizes have now become smaller, while PCB assemblies have become denser. It is difficult to control production and therefore defects arise. Thus, it is necessary to use an automated inspection system. Major technologies such as automatic optical inspection, automatic x-ray inspection, solder paste inspection, and test equipment such as flying probe tester, and ICT are involved in SMT inspection machines. Inspection, metrology, and data analytics technologies play a key role in enabling companies to develop and manufacture advanced semiconductor devices.
Continual evolution of semiconductors to smaller geometries and more complex multi-level circuitry has significantly increased the performance and cost requirements of the capital equipment used to manufacture these devices. Construction of an advanced wafer fabrication facility can cost well above US$10 Bn. This is substantially more than previous-generation facilities. Additionally, chipmakers are demanding increased productivity and higher returns from their manufacturing equipment and are also seeking ways to extend the performance of their existing equipment. Changing the dimension of devices and components has augmented the growth of 3D. This is especially important when dealing with material variance from one lot to the next, which is prevalent in today's industrial environment. Debugging time has reduced and false calls are eliminated, resulting in increased throughput and overall efficiency. Quantitative height measurement identifies the component size and positional accuracy across a wide range of components. Top vendors in the surface mount technology equipment are expected to gain growth opportunities in automated optical inspection in SMT environment and online SMT inspection machines during the forecast period.
The printed circuit board (PCB) industry has been growing at a rapid pace since the last few years, primarily due to the continuous development in consumer electronics devices and increase in demand for miniature PCBs in electronics and electrical equipment. These electronic devices come in various shapes, forms, and sizes; and are developed according to the application requirement. Thus, the processing lifecycle of an electronic device travels through the entire surface mount technology equipment from being a printed circuit board to a finished electronic device. Internet of Things (IoT) offers new opportunities to manufacturers of consumer electronics and wearable devices. Innovation in designs of wearable devices such as smart watches that incorporate chips and flexible sensors is likely to significantly impact the PCB market.
The number of systems connected over the internet has increased substantially across the globe over the last decade. Global installed base of SMT lines stood at approximately 70,176 in 2019 and increased to around 73,231 in 2020, despite the COVID-19 crisis. Together, these SMT lines annually process up to 8 trillion active and passive components that populate some 33 billion printed circuit boards, which form the heart of Smart Phones, Notebooks, FTVs, and future IoT applications. Inspection and testing are significant steps in the process of bringing a product to the market. SMT inspection system can accurately detect component-level defects such as reversed polarity, and missing, damaged, and wrong components. Furthermore, PCB inspection is an essential element in an electronics manufacturing process. It allows faults to be detected as soon as possible after the manufacturing process.
Increase in penetration of EVs and HEVs; rise in demand for advanced driver assistance systems (ADAS); and proliferation of high-end in-car infotainment systems are some of the key factors fueling the integration of electronics in cars. Increase in amount of electronics that go into a car has resulted in the car becoming less of a mechanical thing consisting of a few electronics and more of a computer with wheels. According to the International Energy Agency, sales of electric cars touched 6.6 million in 2021, more than tripling their market share from two years earlier. In response to such demands, the SMT equipment industry has introduced special machines for the development of PCBs for electric and autonomous vehicles.
Manufacturers are witnessing an increase in transition from “inspecting” to “measure” in various applications. In the automotive electronics industry, the challenges regarding 100% functionality of all components are increasing constantly. This means maximization of quality assurance and inspection depth in production processes. Increase in usage of electric vehicles across the world is also creating significant opportunities for SMT repair and inspection equipment manufacturers.
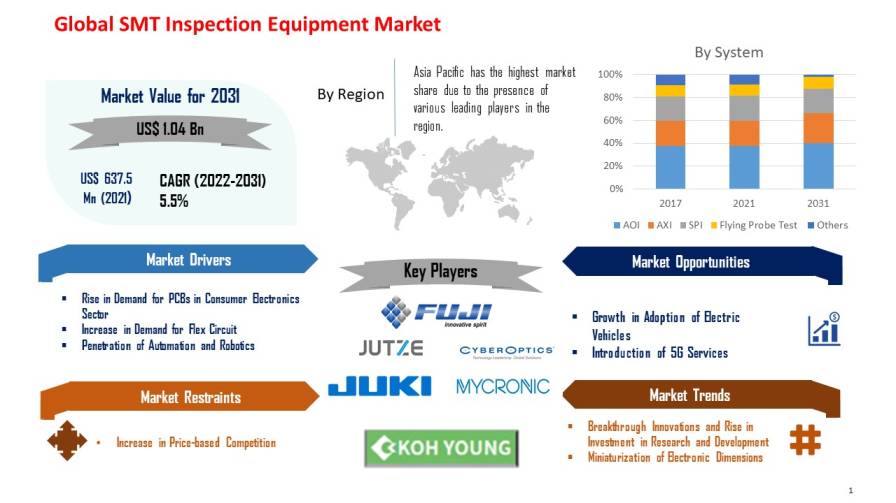
In terms of system, the AOI segment held the largest share of around 37.89% of the global SMT inspection equipment market in 2021, owing to advancements in digital computing, machine vision, and image processing. It has become essential to automate the inspection process with the help of high-resolution cameras, lighting devices, illumination techniques, and an efficient processing algorithm. The revenue from automated optical inspection (AOI) equipment is anticipated to grow at a CAGR of 5.6% during the forecast period. Automated optical inspection systems are the ideal solution for high-throughput and high-resolution applications. These systems are suitable for a wide range of applications requiring automated defect detection and high-accuracy measurements, including Microelectromechanical systems (for MEMS inspection or MEMS measurement), and semiconductor and discrete device inspection and measurement.
AOI inline and offline/benchtop systems offer high-speed PCB inspection with exceptional defect coverage. Inspecting solder joints and verifying correct part assembly quickly and accurately enables users to improve quality on the fly and increase throughput. Despite significant advancements, modern circuits are significantly more complex than circuit boards were even a few years ago. Development of surface mount technology and the subsequent size reductions has resulted in extremely tiny boards. Thousands of soldered joints can be discovered on even the most basic boards, and this is where the majority of issues occur. Manual inspection is no longer a realistic alternative due to the increase in complexity of boards. AOI or automatic optical inspection is a critical tool in an integrated electronic test strategy for keeping costs as low as possible by detecting faults early in the production line. One of the solutions to this is to use automated or automatic optical inspection systems. Automated optical inspection systems can be placed into the production line just after the soldering process. Thus, rise in demand for SMT AOI equipment is expected to dominate the global market during the forecast period.
Asia Pacific is expected to dominate the global SMT inspection equipment market during the forecast period, owing to the presence of a large customer base and major manufacturing hubs in the region. Rise in demand for consumer electronics; increase in demand for safety and autonomous features in vehicles; and penetration of 5G and IoT in several sectors are expected to drive the SMT inspection equipment market in Asia Pacific. China accounted for major share of the market in the region in 2021. OEMs, ODMs, EMS providers, PCB manufacturers, component suppliers, and semiconductor assembly companies imported 60% of China’s automatic placement machines from major SMT (mounting) and FCB (bonding) equipment vendors during 2016 to 2019. Asia Pacific and Europe lead in terms of investment in products such as AXI, SPI and other inspection systems. Growth in the semiconductor manufacturing sector in North America is expected to fuel the demand for SMT inspection equipment in the region in the next few years.
The global SMT inspection equipment market is consolidated, with a small number of large-scale vendors controlling majority of the share. Key players are significantly investing in research and development activities to enhance their market share. Expansion of product portfolios and mergers & acquisitions are major strategies adopted by market players. Mycronics, Koh Young, Test Research, SAKI Corporation, Jutze Intelligence, and Pemtron Corporation are some of the key players operating in the global SMT inspection equipment market.
Each of these players has been profiled in the global SMT inspection equipment market report based on parameters such as company overview, financial overview, business strategies, product portfolio, business segments, and recent developments.
|
Attribute |
Detail |
|
Market Size Value in 2021 |
US$ 637.5 Mn |
|
Market Forecast Value in 2031 |
US$ 1.04 Bn |
|
Growth Rate (CAGR) |
5.5% |
|
Forecast Period |
2022–2031 |
|
Historical Data Available for |
2017–2020 |
|
Quantitative Units |
US$ Mn/Bn for Value & Thousand Units for Volume |
|
Market Analysis |
It includes cross segment analysis at global as well as regional level. Furthermore, qualitative analysis includes drivers, restraints, opportunities, key trends, Porter’s Five Forces analysis, value chain analysis, and key trend analysis. |
|
Competition Landscape |
|
|
Format |
Electronic (PDF) + Excel |
|
Market Segmentation |
|
|
Regions Covered |
|
|
Countries Covered |
|
|
Companies Profiled |
|
|
Customization Scope |
Available upon request |
|
Pricing |
Available upon request |
The global SMT inspection equipment market stood at US$ 637.5 Mn in 2021.
The global SMT inspection equipment market is estimated to grow at a CAGR of 5.5% during the forecast period.
The global SMT inspection equipment market would be worth US$ 1.04 Bn in 2031.
Omron Corporation, Koh Young, Test Research, SAKI Corporation, Jutze Intelligence, and Pemtron Corporation.
The U.S. accounted for 20.94% share of the global SMT inspection equipment market in 2021.
In terms of revenue, the Automatic Optical Inspection (AOI) dominated the market with around 37.89% share in 2021.
Increase in demand for consumer electronics and rapidly evolving AOI technology are the prominent trends in global SMT inspection equipment market.
Asia Pacific is a highly lucrative region of the global SMT inspection equipment market.
1. Preface
1.1. Research Scope
1.2. SMT Inspection Equipment Market Overview
1.3. Market and Segments Definition
1.4. Market Taxonomy
1.5. Research Methodology
1.6. Assumption and Acronyms
2. Executive Summary
2.1. Global SMT Inspection Equipment Market Analysis and Forecast
2.2. Regional Outline
2.3. Market Dynamics Snapshot
2.4. Competition Blueprint
3. Market Dynamics
3.1. Macro-economic Factors
3.2. Key Market Indicator
3.3. Drivers
3.4. Restraints
3.5. Opportunities
3.6. Trends
4. Associated Industry and Key Indicator Assessment
4.1. Parent Industry Overview
4.2. Supply Chain Analysis
4.3. Pricing Analysis
4.4. Industry SWOT Analysis
4.5. Porter Five Forces Analysis
4.6. COVID-19 Impact Analysis
5. Global SMT Inspection Equipment Market Analysis, by System
5.1. Global SMT Inspection Equipment Market Size (US$ Mn) and Volume (Thousand Units) Analysis & Forecast, by System, 2017‒2031
5.1.1. Automatic Optical Inspection (AOI)
5.1.2. Automated X-Ray Inspection (AXI)
5.1.3. Solder Paste Inspection (SPI)
5.1.4. Flying Probe Test
5.1.5. Others
5.2. Global SMT Inspection Equipment Market Attractiveness Analysis, by System
6. Global SMT Inspection Equipment Market Analysis, by Dimension
6.1. Global SMT Inspection Equipment Market Size (US$ Mn) Analysis & Forecast, by Dimension, 2017‒2031
6.1.1. 2D
6.1.2. 3D
6.2. Global SMT Inspection Equipment Market Attractiveness Analysis, by Dimension
7. Global SMT Inspection Equipment Market Analysis, by Configuration
7.1. Global SMT Inspection Equipment Market Size (US$ Mn) Analysis & Forecast, by Configuration, 2017‒2031
7.1.1. Inline
7.1.2. Offline
7.2. Global SMT Inspection Equipment Market Attractiveness Analysis, by Configuration
8. Global SMT Inspection Equipment Market Analysis, by Phase
8.1. Global SMT Inspection Equipment Market Size (US$ Mn) Analysis & Forecast, by Phase, 2017‒2031
8.1.1. Incoming Inspection
8.1.2. In-Process Inspection
8.1.3. Product Inspection and Rework
8.2. Global SMT Inspection Equipment Market Attractiveness Analysis, by Phase
9. Global SMT Inspection Equipment Market Analysis, by End-user
9.1. Global SMT Inspection Equipment Market Size (US$ Mn) Analysis & Forecast, by End-user, 2017‒2031
9.1.1. Integrated Device Manufacturer (IDM)
9.1.2. Outsourced Semiconductor Assembly and Test (OSAT)
9.1.3. Foundry
9.2. Global SMT Inspection Equipment Market Attractiveness Analysis, by End-user
10. Global SMT Inspection Equipment Market Analysis and Forecast, by Region
10.1. Global SMT Inspection Equipment Market Size (US$ Mn) and Volume (Thousand Units) Analysis & Forecast, by Region, 2017 – 2031
10.1.1. North America
10.1.2. Europe
10.1.3. Asia Pacific
10.1.4. Middle East & Africa
10.1.5. South America
10.2. Global SMT Inspection Equipment Market Attractiveness Analysis, by Region
11. North America SMT Inspection Equipment Market Analysis and Forecast
11.1. Market Snapshot
11.2. North America SMT Inspection Equipment Market Size (US$ Mn) and Volume (Thousand Units) Analysis & Forecast, by System, 2017‒2031
11.2.1. Automatic Optical Inspection (AOI)
11.2.2. Automated X-Ray Inspection (AXI)
11.2.3. Solder Paste Inspection (SPI)
11.2.4. Flying Probe Test
11.2.5. Others
11.3. North America SMT Inspection Equipment Market Size (US$ Mn) Analysis & Forecast, by Dimension, 2017‒2031
11.3.1. 2D
11.3.2. 3D
11.4. North America SMT Inspection Equipment Market Size (US$ Mn) Analysis & Forecast, by Phase, 2017‒2031
11.4.1. Incoming Inspection
11.4.2. In-Process Inspection
11.4.3. Product Inspection and Rework
11.5. North America SMT Inspection Equipment Market Size (US$ Mn) Analysis & Forecast, by Phase, 2017‒2031
11.5.1. Incoming Inspection
11.5.2. In-Process Inspection
11.5.3. Product Inspection and Rework
11.6. North America SMT Inspection Equipment Market Size (US$ Mn) Analysis & Forecast, by End-user, 2017‒2031
11.6.1. Integrated Device Manufacturer (IDM)
11.6.2. Outsourced Semiconductor Assembly and Test (OSAT)
11.6.3. Foundry
11.7. North America SMT Inspection Equipment Market Size (US$ Mn) and Volume (Thousand Units) Analysis & Forecast, by Country & Sub-region, 2017 – 2031
11.7.1. U.S.
11.7.2. Canada
11.7.3. Mexico
11.8. North America SMT Inspection Equipment Market Attractiveness Analysis
11.8.1. By System
11.8.2. By Dimension
11.8.3. By Configuration
11.8.4. By Phase
11.8.5. By End-user
11.8.6. By Country & Sub-region
12. Europe SMT Inspection Equipment Market Analysis and Forecast
12.1. Market Snapshot
12.2. Europe SMT Inspection Equipment Market Size (US$ Mn) and Volume (Thousand Units) Analysis & Forecast, by System, 2017‒2031
12.2.1. Automatic Optical Inspection (AOI)
12.2.2. Automated X-Ray Inspection (AXI)
12.2.3. Solder Paste Inspection (SPI)
12.2.4. Flying Probe Test
12.2.5. Others
12.3. Europe SMT Inspection Equipment Market Size (US$ Mn) Analysis & Forecast, by Dimension, 2017‒2031
12.3.1. 2D
12.3.2. 3D
12.4. Europe SMT Inspection Equipment Market Size (US$ Mn) Analysis & Forecast, by Phase, 2017‒2031
12.4.1. Incoming Inspection
12.4.2. In-Process Inspection
12.4.3. Product Inspection and Rework
12.5. Europe SMT Inspection Equipment Market Size (US$ Mn) Analysis & Forecast, by Phase, 2017‒2031
12.5.1. Incoming Inspection
12.5.2. In-Process Inspection
12.5.3. Product Inspection and Rework
12.6. Europe SMT Inspection Equipment Market Size (US$ Mn) Analysis & Forecast, by End-user, 2017‒2031
12.6.1. Integrated Device Manufacturer (IDM)
12.6.2. Outsourced Semiconductor Assembly and Test (OSAT)
12.6.3. Foundry
12.7. Europe SMT Inspection Equipment Market Size (US$ Mn) and Volume (Thousand Units) Analysis & Forecast, by Country & Sub-region, 2017 – 2031
12.7.1. U.K.
12.7.2. Germany
12.7.3. France
12.7.4. Rest of Europe
12.8. Europe SMT Inspection Equipment Market Attractiveness Analysis
12.8.1. By System
12.8.2. By Dimension
12.8.3. By Configuration
12.8.4. By Phase
12.8.5. By End-user
12.8.6. By Country & Sub-region
13. Asia Pacific SMT Inspection Equipment Market Analysis and Forecast
13.1. Market Snapshot
13.2. Asia Pacific SMT Inspection Equipment Market Size (US$ Mn) and Volume (Thousand Units) Analysis & Forecast, by System, 2017‒2031
13.2.1. Automatic Optical Inspection (AOI)
13.2.2. Automated X-Ray Inspection (AXI)
13.2.3. Solder Paste Inspection (SPI)
13.2.4. Flying Probe Test
13.2.5. Others
13.3. Asia Pacific SMT Inspection Equipment Market Size (US$ Mn) Analysis & Forecast, by Dimension, 2017‒2031
13.3.1. 2D
13.3.2. 3D
13.4. Asia Pacific SMT Inspection Equipment Market Size (US$ Mn) Analysis & Forecast, by Phase, 2017‒2031
13.4.1. Incoming Inspection
13.4.2. In-Process Inspection
13.4.3. Product Inspection and Rework
13.5. Asia Pacific SMT Inspection Equipment Market Size (US$ Mn) Analysis & Forecast, by Phase, 2017‒2031
13.5.1. Incoming Inspection
13.5.2. In-Process Inspection
13.5.3. Product Inspection and Rework
13.6. Asia Pacific SMT Inspection Equipment Market Size (US$ Mn) Analysis & Forecast, by End-user, 2017‒2031
13.6.1. Integrated Device Manufacturer (IDM)
13.6.2. Outsourced Semiconductor Assembly and Test (OSAT)
13.6.3. Foundry
13.7. Asia Pacific SMT Inspection Equipment Market Size (US$ Mn) and Volume (Thousand Units) Analysis & Forecast, by Country & Sub-region, 2017 – 2031
13.7.1. China
13.7.2. India
13.7.3. Japan
13.7.4. South Korea
13.7.5. ASEAN
13.7.6. Rest of Asia Pacific
13.8. Asia Pacific SMT Inspection Equipment Market Attractiveness Analysis
13.8.1. By System
13.8.2. By Dimension
13.8.3. By Configuration
13.8.4. By Phase
13.8.5. By End-user
13.8.6. By Country & Sub-region
14. Middle East & Africa (MEA) SMT Inspection Equipment Market Analysis and Forecast
14.1. Market Snapshot
14.2. MEA SMT Inspection Equipment Market Size (US$ Mn) and Volume (Thousand Units) Analysis & Forecast, by System, 2017‒2031
14.2.1. Automatic Optical Inspection (AOI)
14.2.2. Automated X-Ray Inspection (AXI)
14.2.3. Solder Paste Inspection (SPI)
14.2.4. Flying Probe Test
14.2.5. Others
14.3. MEA SMT Inspection Equipment Market Size (US$ Mn) Analysis & Forecast, by Dimension, 2017‒2031
14.3.1. 2D
14.3.2. 3D
14.4. MEA SMT Inspection Equipment Market Size (US$ Mn) Analysis & Forecast, by Phase, 2017‒2031
14.4.1. Incoming Inspection
14.4.2. In-Process Inspection
14.4.3. Product Inspection and Rework
14.5. MEA SMT Inspection Equipment Market Size (US$ Mn) Analysis & Forecast, by Phase, 2017‒2031
14.5.1. Incoming Inspection
14.5.2. In-Process Inspection
14.5.3. Product Inspection and Rework
14.6. MEA SMT Inspection Equipment Market Size (US$ Mn) Analysis & Forecast, by End-user, 2017‒2031
14.6.1. Integrated Device Manufacturer (IDM)
14.6.2. Outsourced Semiconductor Assembly and Test (OSAT)
14.6.3. Foundry
14.7. MEA SMT Inspection Equipment Market Size (US$ Mn) and Volume (Thousand Units) Analysis & Forecast, by Country & Sub-region, 2017 – 2031
14.7.1. GCC
14.7.2. South Africa
14.7.3. North Africa
14.7.4. Rest of Middle East & Africa
14.8. MEA SMT Inspection Equipment Market Attractiveness Analysis
14.8.1. By System
14.8.2. By Dimension
14.8.3. By Configuration
14.8.4. By Phase
14.8.5. By End-user
14.8.6. By Country & Sub-region
15. South America SMT Inspection Equipment Market Analysis and Forecast
15.1. Market Snapshot
15.2. South America SMT Inspection Equipment Market Size (US$ Mn) and Volume (Thousand Units) Analysis & Forecast, by System, 2017‒2031
15.2.1. Automatic Optical Inspection (AOI)
15.2.2. Automated X-Ray Inspection (AXI)
15.2.3. Solder Paste Inspection (SPI)
15.2.4. Flying Probe Test
15.2.5. Others
15.3. South America SMT Inspection Equipment Market Size (US$ Mn) Analysis & Forecast, by Dimension, 2017‒2031
15.3.1. 2D
15.3.2. 3D
15.4. South America SMT Inspection Equipment Market Size (US$ Mn) Analysis & Forecast, by Phase, 2017‒2031
15.4.1. Incoming Inspection
15.4.2. In-Process Inspection
15.4.3. Product Inspection and Rework
15.5. South America SMT Inspection Equipment Market Size (US$ Mn) Analysis & Forecast, by Phase, 2017‒2031
15.5.1. Incoming Inspection
15.5.2. In-Process Inspection
15.5.3. Product Inspection and Rework
15.6. South America SMT Inspection Equipment Market Size (US$ Mn) Analysis & Forecast, by End-user, 2017‒2031
15.6.1. Integrated Device Manufacturer (IDM)
15.6.2. Outsourced Semiconductor Assembly and Test (OSAT)
15.6.3. Foundry
15.7. South America SMT Inspection Equipment Market Size (US$ Mn) and Volume (Thousand Units) Analysis & Forecast, by Country & Sub-region, 2017 – 2031
15.7.1. Brazil
15.7.2. Rest of South America
15.8. South America SMT Inspection Equipment Market Attractiveness Analysis
15.8.1. By System
15.8.2. By Dimension
15.8.3. By Configuration
15.8.4. By Phase
15.8.5. By End-user
15.8.6. By Country & Sub-region
16. Competition Assessment
16.1. Global SMT Inspection Equipment Market Competition Matrix - a Dashboard View
16.2. Global SMT Inspection Equipment Market Company Share Analysis, by Value (2020)
16.3. Technological Differentiator
17. Company Profiles (Manufacturers/Suppliers)
17.1. Acculogic Inc.
17.1.1. Overview
17.1.2. Product Portfolio
17.1.3. Sales Footprint
17.1.4. Key Subsidiaries or Distributors
17.1.5. Strategy and Recent Developments
17.1.6. Key Financials
17.2. AOI Systems Ltd
17.2.1. Overview
17.2.2. Product Portfolio
17.2.3. Sales Footprint
17.2.4. Key Subsidiaries or Distributors
17.2.5. Strategy and Recent Developments
17.2.6. Key Financials
17.3. Camtek
17.3.1. Overview
17.3.2. Product Portfolio
17.3.3. Sales Footprint
17.3.4. Key Subsidiaries or Distributors
17.3.5. Strategy and Recent Developments
17.3.6. Key Financials
17.4. CKD Corporation
17.4.1. Overview
17.4.2. Product Portfolio
17.4.3. Sales Footprint
17.4.4. Key Subsidiaries or Distributors
17.4.5. Strategy and Recent Developments
17.4.6. Key Financials
17.5. GÖPEL electronic GmbH
17.5.1. Overview
17.5.2. Product Portfolio
17.5.3. Sales Footprint
17.5.4. Key Subsidiaries or Distributors
17.5.5. Strategy and Recent Developments
17.5.6. Key Financials
17.6. HIOKI E.E. CORPORATION
17.6.1. Overview
17.6.2. Product Portfolio
17.6.3. Sales Footprint
17.6.4. Key Subsidiaries or Distributors
17.6.5. Strategy and Recent Developments
17.6.6. Key Financials
17.7. JOINT STARS TECHNOLOGY CO., LTD
17.7.1. Overview
17.7.2. Product Portfolio
17.7.3. Sales Footprint
17.7.4. Key Subsidiaries or Distributors
17.7.5. Strategy and Recent Developments
17.7.6. Key Financials
17.8. Jutze Intelligence
17.8.1. Overview
17.8.2. Product Portfolio
17.8.3. Sales Footprint
17.8.4. Key Subsidiaries or Distributors
17.8.5. Strategy and Recent Developments
17.8.6. Key Financials
17.9. Koh Young
17.9.1. Overview
17.9.2. Product Portfolio
17.9.3. Sales Footprint
17.9.4. Key Subsidiaries or Distributors
17.9.5. Strategy and Recent Developments
17.9.6. Key Financials
17.10. Machine Vision Products (MVP)
17.10.1. Overview
17.10.2. Product Portfolio
17.10.3. Sales Footprint
17.10.4. Key Subsidiaries or Distributors
17.10.5. Strategy and Recent Developments
17.10.6. Key Financials
17.11. MIRTEC CO., LTD
17.11.1. Overview
17.11.2. Product Portfolio
17.11.3. Sales Footprint
17.11.4. Key Subsidiaries or Distributors
17.11.5. Strategy and Recent Developments
17.11.6. Key Financials
17.12. Mycronics (atg Luther & Maelzer)
17.12.1. Overview
17.12.2. Product Portfolio
17.12.3. Sales Footprint
17.12.4. Key Subsidiaries or Distributors
17.12.5. Strategy and Recent Developments
17.12.6. Key Financials
17.13. Omron Corporation
17.13.1. Overview
17.13.2. Product Portfolio
17.13.3. Sales Footprint
17.13.4. Key Subsidiaries or Distributors
17.13.5. Strategy and Recent Developments
17.13.6. Key Financials
17.14. PARMI Co., Ltd.
17.14.1. Overview
17.14.2. Product Portfolio
17.14.3. Sales Footprint
17.14.4. Key Subsidiaries or Distributors
17.14.5. Strategy and Recent Developments
17.14.6. Key Financials
17.15. Pemtron Corporation
17.15.1. Overview
17.15.2. Product Portfolio
17.15.3. Sales Footprint
17.15.4. Key Subsidiaries or Distributors
17.15.5. Strategy and Recent Developments
17.15.6. Key Financials
17.16. SAKI Corporation
17.16.1. Overview
17.16.2. Product Portfolio
17.16.3. Sales Footprint
17.16.4. Key Subsidiaries or Distributors
17.16.5. Strategy and Recent Developments
17.16.6. Key Financials
17.17. Seica
17.17.1. Overview
17.17.2. Product Portfolio
17.17.3. Sales Footprint
17.17.4. Key Subsidiaries or Distributors
17.17.5. Strategy and Recent Developments
17.17.6. Key Financials
17.18. SPEA
17.18.1. Overview
17.18.2. Product Portfolio
17.18.3. Sales Footprint
17.18.4. Key Subsidiaries or Distributors
17.18.5. Strategy and Recent Developments
17.18.6. Key Financials
17.19. TAKAYA
17.19.1. Overview
17.19.2. Product Portfolio
17.19.3. Sales Footprint
17.19.4. Key Subsidiaries or Distributors
17.19.5. Strategy and Recent Developments
17.19.6. Key Financials
17.20. Test Research.
17.20.1. Overview
17.20.2. Product Portfolio
17.20.3. Sales Footprint
17.20.4. Key Subsidiaries or Distributors
17.20.5. Strategy and Recent Developments
17.20.6. Key Financials
17.21. ViTechnology.
17.21.1. Overview
17.21.2. Product Portfolio
17.21.3. Sales Footprint
17.21.4. Key Subsidiaries or Distributors
17.21.5. Strategy and Recent Developments
17.21.6. Key Financials
17.22. ViTrox
17.22.1. Overview
17.22.2. Product Portfolio
17.22.3. Sales Footprint
17.22.4. Key Subsidiaries or Distributors
17.22.5. Strategy and Recent Developments
17.22.6. Key Financials
17.23. Yxlon International
17.23.1. Overview
17.23.2. Product Portfolio
17.23.3. Sales Footprint
17.23.4. Key Subsidiaries or Distributors
17.23.5. Strategy and Recent Developments
17.23.6. Key Financials
18. Recommendation
18.1. Opportunity Assessment
18.1.1. By System
18.1.2. By Dimension
18.1.3. By Configuration
18.1.4. By Phase
18.1.5. By End-user
18.1.6. By Region
List of Tables
Table 1: Global SMT Inspection Equipment Market Value (US$ Mn) & Forecast, by System, 2017‒2031
Table 2: Global SMT Inspection Equipment Market Volume (Thousand Units) & Forecast, by System, 2017‒2031
Table 3: Global SMT Inspection Equipment Market Value (US$ Mn) & Forecast, by Dimension 2017‒2031
Table 4: Global SMT Inspection Equipment Market Value (US$ Mn) & Forecast, by Configuration 2017‒2031
Table 5: Global SMT Inspection Equipment Market Value (US$ Mn) & Forecast, by Phase 2017‒2031
Table 6: Global SMT Inspection Equipment Market Value (US$ Mn) & Forecast, by End-user, 2017‒2033
Table 7: Global SMT Inspection Equipment Market Value (US$ Mn) & Forecast, by Region, 2017‒2031
Table 8: Global SMT Inspection Equipment Market Volume (Thousand Units) & Forecast, by Region, 2017‒2031
Table 9: North America SMT Inspection Equipment Market Value (US$ Mn) & Forecast, by System, 2017‒2031
Table 10: North America SMT Inspection Equipment Market Volume (Thousand Units) & Forecast, by System, 2017‒2031
Table 11: North America SMT Inspection Equipment Market Value (US$ Mn) & Forecast, by Dimension 2017‒2031
Table 12: North America SMT Inspection Equipment Market Value (US$ Mn) & Forecast, by Configuration 2017‒2031
Table 13: North America SMT Inspection Equipment Market Value (US$ Mn) & Forecast, by Phase 2017‒2031
Table 14: North America SMT Inspection Equipment Market Value (US$ Mn) & Forecast, by End-user, 2017‒2033
Table 15: North America SMT Inspection Equipment Market Value (US$ Mn) & Forecast, by Region, 2017‒2031
Table 16: North America SMT Inspection Equipment Market Volume (Thousand Units) & Forecast, by Region, 2017‒2031
Table 17: Europe SMT Inspection Equipment Market Value (US$ Mn) & Forecast, by System, 2017‒2031
Table 18: Europe SMT Inspection Equipment Market Volume (Thousand Units) & Forecast, by System, 2017‒2031
Table 19: Europe SMT Inspection Equipment Market Value (US$ Mn) & Forecast, by Dimension 2017‒2031
Table 20: Europe SMT Inspection Equipment Market Value (US$ Mn) & Forecast, by Configuration 2017‒2031
Table 21: Europe SMT Inspection Equipment Market Value (US$ Mn) & Forecast, by Phase 2017‒2031
Table 22: Europe SMT Inspection Equipment Market Value (US$ Mn) & Forecast, by End-user, 2017‒2033
Table 23: Europe SMT Inspection Equipment Market Value (US$ Mn) & Forecast, by Region, 2017‒2031
Table 24: Europe SMT Inspection Equipment Market Volume (Thousand Units) & Forecast, by Region, 2017‒2031
Table 25: Asia Pacific SMT Inspection Equipment Market Value (US$ Mn) & Forecast, by System, 2017‒2031
Table 26: Asia Pacific SMT Inspection Equipment Market Volume (Thousand Units) & Forecast, by System, 2017‒2031
Table 27: Asia Pacific SMT Inspection Equipment Market Value (US$ Mn) & Forecast, by Dimension 2017‒2031
Table 28: Asia Pacific SMT Inspection Equipment Market Value (US$ Mn) & Forecast, by Configuration 2017‒2031
Table 29: Asia Pacific SMT Inspection Equipment Market Value (US$ Mn) & Forecast, by Phase 2017‒2031
Table 30: Asia Pacific SMT Inspection Equipment Market Value (US$ Mn) & Forecast, by End-user, 2017‒2033
Table 31: Asia Pacific SMT Inspection Equipment Market Value (US$ Mn) & Forecast, by Region, 2017‒2031
Table 32: Asia Pacific SMT Inspection Equipment Market Volume (Thousand Units) & Forecast, by Region, 2017‒2031
Table 33: Middle East and Africa SMT Inspection Equipment Market Value (US$ Mn) & Forecast, by System, 2017‒2031
Table 34: Middle East and Africa SMT Inspection Equipment Market Volume (Thousand Units) & Forecast, by System, 2017‒2031
Table 35: Middle East and Africa SMT Inspection Equipment Market Value (US$ Mn) & Forecast, by Dimension 2017‒2031
Table 36: Middle East and Africa SMT Inspection Equipment Market Value (US$ Mn) & Forecast, by Configuration 2017‒2031
Table 37: Middle East and Africa SMT Inspection Equipment Market Value (US$ Mn) & Forecast, by Phase 2017‒2031
Table 38: Middle East and Africa SMT Inspection Equipment Market Value (US$ Mn) & Forecast, by End-user, 2017‒2033
Table 39: Middle East and Africa SMT Inspection Equipment Market Value (US$ Mn) & Forecast, by Region, 2017‒2031
Table 40: Middle East and Africa SMT Inspection Equipment Market Volume (Thousand Units) & Forecast, by Region, 2017‒2031
Table 41: South America SMT Inspection Equipment Market Value (US$ Mn) & Forecast, by System, 2017‒2031
Table 42: South America SMT Inspection Equipment Market Volume (Thousand Units) & Forecast, by System, 2017‒2031
Table 43: South America SMT Inspection Equipment Market Value (US$ Mn) & Forecast, by Dimension 2017‒2031
Table 44: South America SMT Inspection Equipment Market Value (US$ Mn) & Forecast, by Configuration 2017‒2031
Table 45: South America SMT Inspection Equipment Market Value (US$ Mn) & Forecast, by Phase 2017‒2031
Table 46: South America SMT Inspection Equipment Market Value (US$ Mn) & Forecast, by End-user, 2017‒2033
Table 47: South America SMT Inspection Equipment Market Value (US$ Mn) & Forecast, by Region, 2017‒2031
Table 48: South America SMT Inspection Equipment Market Volume (Thousand Units) & Forecast, by Region, 2017‒2031
List of Figures
Figure 01: Global SMT Inspection Equipment Market Size & Forecast, Value (US$ Mn), 2017‒2031
Figure 02: Global SMT Inspection Equipment Market Size & Forecast, Volume (Thousand Units), 2017‒2031
Figure 03: Global SMT Inspection Equipment Market Size & Forecast, Y-O-Y, Value (US$ Mn), 2017‒2031
Figure 04: Global SMT Inspection Equipment Market Projections by System, Value (US$ Mn), 2017‒2031
Figure 05: Global SMT Inspection Equipment Market Share Analysis, by System, 2021 and 2031
Figure 06: Global SMT Inspection Equipment Market, Incremental Opportunity, by System, 2021‒2031
Figure 07: Global SMT Inspection Equipment Market Projections by Dimension, Value (US$ Mn), 2017‒2031
Figure 08: Global SMT Inspection Equipment Market Share Analysis, by Dimension, 2021 and 2031
Figure 09: Global SMT Inspection Equipment Market, Incremental Opportunity, by Dimension, 2021‒2031
Figure 10: Global SMT Inspection Equipment Market Projections by Configuration, Value (US$ Mn), 2017‒2031
Figure 11: Global SMT Inspection Equipment Market Share Analysis, by Configuration, 2021 and 2031
Figure 12: Global SMT Inspection Equipment Market, Incremental Opportunity, by Configuration, 2021‒2031
Figure 13: Global SMT Inspection Equipment Market Projections by Phase, Value (US$ Mn), 2017‒2031
Figure 14: Global SMT Inspection Equipment Market Share Analysis, by Phase, 2021 and 2031
Figure 15: Global SMT Inspection Equipment Market, Incremental Opportunity, by Phase, 2021‒2031
Figure 16: Global SMT Inspection Equipment Market Projections by End-user, Value (US$ Mn), 2017‒2031
Figure 17: Global SMT Inspection Equipment Market Share Analysis, by End-user, 2021 and 2031
Figure 18: Global SMT Inspection Equipment Market, Incremental Opportunity, by End-user, 2021‒2031
Figure 19: Global SMT Inspection Equipment Market Projections by Region, Value (US$ Mn), 2017‒2031
Figure 20: Global SMT Inspection Equipment Market Share Analysis, by Region 2021 and 2031
Figure 21: Global SMT Inspection Equipment Market, Incremental Opportunity, by Region, 2021‒2031
Figure 22: North America SMT Inspection Equipment Market Size & Forecast, Value (US$ Mn), 2017‒2031
Figure 23: North America SMT Inspection Equipment Market Size & Forecast, Volume (Thousand Units), 2017‒2031
Figure 24: North America SMT Inspection Equipment Market Size & Forecast, Y-O-Y, Value (US$ Mn), 2017‒2031
Figure 25: North America SMT Inspection Equipment Market Projections by System, Value (US$ Mn), 2017‒2031
Figure 26: North America SMT Inspection Equipment Market Share Analysis, by System, 2021 and 2031
Figure 27: North America SMT Inspection Equipment Market, Incremental Opportunity, by System, 2021‒2031
Figure 28: North America SMT Inspection Equipment Market Projections by Dimension, Value (US$ Mn), 2017‒2031
Figure 29: North America SMT Inspection Equipment Market Share Analysis, by Dimension, 2021 and 2031
Figure 30: North America SMT Inspection Equipment Market, Incremental Opportunity, by Dimension, 2021‒2031
Figure 31: North America SMT Inspection Equipment Market Projections by Configuration, Value (US$ Mn), 2017‒2031
Figure 32: North America SMT Inspection Equipment Market Share Analysis, by Configuration, 2021 and 2031
Figure 33: North America SMT Inspection Equipment Market, Incremental Opportunity, by Configuration, 2021‒2031
Figure 34: North America SMT Inspection Equipment Market Projections by Phase, Value (US$ Mn), 2017‒2031
Figure 35: North America SMT Inspection Equipment Market Share Analysis, by Phase, 2021 and 2031
Figure 36: North America SMT Inspection Equipment Market, Incremental Opportunity, by Phase, 2021‒2031
Figure 37: North America SMT Inspection Equipment Market Projections by End-user, Value (US$ Mn), 2017‒2031
Figure 38: North America SMT Inspection Equipment Market Share Analysis, by End-user, 2021 and 2031
Figure 39: North America SMT Inspection Equipment Market, Incremental Opportunity, by End-user, 2021‒2031
Figure 40: North America SMT Inspection Equipment Market Projections by Country and sub-region, Value (US$ Mn), 2017‒2031
Figure 41: North America SMT Inspection Equipment Market Share Analysis, by Country and sub-region 2021 and 2031
Figure 42: North America SMT Inspection Equipment Market, Incremental Opportunity, by Country and sub-region, 2021‒2031
Figure 43: Europe SMT Inspection Equipment Market Size & Forecast, Value (US$ Mn), 2017‒2031
Figure 44: Europe SMT Inspection Equipment Market Size & Forecast, Volume (Thousand Units), 2017‒2031
Figure 45: Europe SMT Inspection Equipment Market Size & Forecast, Y-O-Y, Value (US$ Mn), 2017‒2031
Figure 46: Europe SMT Inspection Equipment Market Projections by System, Value (US$ Mn), 2017‒2031
Figure 47: Europe SMT Inspection Equipment Market Share Analysis, by System, 2021 and 2031
Figure 48: Europe SMT Inspection Equipment Market, Incremental Opportunity, by System, 2021‒2031
Figure 49: Europe SMT Inspection Equipment Market Projections by Dimension, Value (US$ Mn), 2017‒2031
Figure 50: Europe SMT Inspection Equipment Market Share Analysis, by Dimension, 2021 and 2031
Figure 51: Europe SMT Inspection Equipment Market, Incremental Opportunity, by Dimension, 2021‒2031
Figure 52: Europe SMT Inspection Equipment Market Projections by Configuration, Value (US$ Mn), 2017‒2031
Figure 53: Europe SMT Inspection Equipment Market Share Analysis, by Configuration, 2021 and 2031
Figure 54: Europe SMT Inspection Equipment Market, Incremental Opportunity, by Configuration, 2021‒2031
Figure 55: Europe SMT Inspection Equipment Market Projections by Phase, Value (US$ Mn), 2017‒2031
Figure 56: Europe SMT Inspection Equipment Market Share Analysis, by Phase, 2021 and 2031
Figure 57: Europe SMT Inspection Equipment Market, Incremental Opportunity, by Phase, 2021‒2031
Figure 58: Europe SMT Inspection Equipment Market Projections by End-user, Value (US$ Mn), 2017‒2031
Figure 59: Europe SMT Inspection Equipment Market Share Analysis, by End-user, 2021 and 2031
Figure 60: Europe SMT Inspection Equipment Market, Incremental Opportunity, by End-user, 2021‒2031
Figure 61: Europe SMT Inspection Equipment Market Projections by Country and sub-region, Value (US$ Mn), 2017‒2031
Figure 62: Europe SMT Inspection Equipment Market Share Analysis, by Country and sub-region 2021 and 2031
Figure 63: Europe SMT Inspection Equipment Market, Incremental Opportunity, by Country and sub-region, 2021‒2031
Figure 64: Asia Pacific SMT Inspection Equipment Market Size & Forecast, Value (US$ Mn), 2017‒2031
Figure 65: Asia Pacific SMT Inspection Equipment Market Size & Forecast, Volume (Thousand Units), 2017‒2031
Figure 66: Asia Pacific SMT Inspection Equipment Market Size & Forecast, Y-O-Y, Value (US$ Mn), 2017‒2031
Figure 67: Asia Pacific SMT Inspection Equipment Market Projections by System, Value (US$ Mn), 2017‒2031
Figure 68: Asia Pacific SMT Inspection Equipment Market Share Analysis, by System, 2021 and 2031
Figure 69: Asia Pacific SMT Inspection Equipment Market, Incremental Opportunity, by System, 2021‒2031
Figure 70: Asia Pacific SMT Inspection Equipment Market Projections by Dimension, Value (US$ Mn), 2017‒2031
Figure 71: Asia Pacific SMT Inspection Equipment Market Share Analysis, by Dimension, 2021 and 2031
Figure 72: Asia Pacific SMT Inspection Equipment Market, Incremental Opportunity, by Dimension, 2021‒2031
Figure 73: Global SMT Inspection Equipment Market Projections by Configuration, Value (US$ Mn), 2017‒2031
Figure 74: Global SMT Inspection Equipment Market Share Analysis, by Configuration, 2021 and 2031
Figure 75: Global SMT Inspection Equipment Market, Incremental Opportunity, by Configuration, 2021‒2031
Figure 76: Global SMT Inspection Equipment Market Projections by Phase, Value (US$ Mn), 2017‒2031
Figure 77: Global SMT Inspection Equipment Market Share Analysis, by Phase, 2021 and 2031
Figure 78: Global SMT Inspection Equipment Market, Incremental Opportunity, by Phase, 2021‒2031
Figure 79: Asia Pacific SMT Inspection Equipment Market Projections by End-user, Value (US$ Mn), 2017‒2031
Figure 80: Asia Pacific SMT Inspection Equipment Market Share Analysis, by End-user, 2021 and 2031
Figure 81: Asia Pacific SMT Inspection Equipment Market, Incremental Opportunity, by End-user, 2021‒2031
Figure 82: Asia Pacific SMT Inspection Equipment Market Projections by Country and sub-region, Value (US$ Mn), 2017‒2031
Figure 83: Asia Pacific SMT Inspection Equipment Market Share Analysis, by Country and sub-region 2021 and 2031
Figure 84: Asia Pacific SMT Inspection Equipment Market, Incremental Opportunity, by Country and sub-region, 2021‒2031
Figure 85: Middle East and Africa SMT Inspection Equipment Market Size & Forecast, Value (US$ Mn), 2017‒2031
Figure 86: Middle East and Africa SMT Inspection Equipment Market Size & Forecast, Volume (Thousand Units), 2017‒2031
Figure 87: Middle East and Africa SMT Inspection Equipment Market Size & Forecast, Y-O-Y, Value (US$ Mn), 2017‒2031
Figure 88: Middle East and Africa SMT Inspection Equipment Market Projections by System, Value (US$ Mn), 2017‒2031
Figure 89: Middle East and Africa SMT Inspection Equipment Market Share Analysis, by System, 2021 and 2031
Figure 90: Middle East and Africa SMT Inspection Equipment Market, Incremental Opportunity, by System, 2021‒2031
Figure 91: Middle East and Africa SMT Inspection Equipment Market Projections by Dimension, Value (US$ Mn), 2017‒2031
Figure 92: Middle East and Africa SMT Inspection Equipment Market Share Analysis, by Dimension, 2021 and 2031
Figure 93: Middle East and Africa SMT Inspection Equipment Market, Incremental Opportunity, by Dimension, 2021‒2031
Figure 94: Middle East and Africa SMT Inspection Equipment Market Projections by Configuration, Value (US$ Mn), 2017‒2031
Figure 95: Middle East and Africa SMT Inspection Equipment Market Share Analysis, by Configuration, 2021 and 2031
Figure 96: Middle East and Africa SMT Inspection Equipment Market, Incremental Opportunity, by Configuration, 2021‒2031
Figure 97: Middle East and Africa SMT Inspection Equipment Market Projections by Phase, Value (US$ Mn), 2017‒2031
Figure 98: Middle East and Africa SMT Inspection Equipment Market Share Analysis, by Phase, 2021 and 2031
Figure 99: Middle East and Africa SMT Inspection Equipment Market, Incremental Opportunity, by Phase, 2021‒2031
Figure 100: Middle East and Africa SMT Inspection Equipment Market Projections by End-user, Value (US$ Mn), 2017‒2031
Figure 101: Middle East and Africa SMT Inspection Equipment Market Share Analysis, by End-user, 2021 and 2031
Figure 102: Middle East and Africa SMT Inspection Equipment Market, Incremental Opportunity, by End-user, 2021‒2031
Figure 103: Middle East and Africa SMT Inspection Equipment Market Projections by Country and sub-region, Value (US$ Mn), 2017‒2031
Figure 104: Middle East and Africa SMT Inspection Equipment Market Share Analysis, by Country and sub-region 2021 and 2031
Figure 105: Middle East and Africa SMT Inspection Equipment Market, Incremental Opportunity, by Country and sub-region, 2021‒2031
Figure 106: South America SMT Inspection Equipment Market Size & Forecast, Value (US$ Mn), 2017‒2031
Figure 107: South America SMT Inspection Equipment Market Size & Forecast, Volume (Thousand Units), 2017‒2031
Figure 108: South America SMT Inspection Equipment Market Size & Forecast, Y-O-Y, Value (US$ Mn), 2017‒2031
Figure 109: South America SMT Inspection Equipment Market Projections by System, Value (US$ Mn), 2017‒2031
Figure 110: South America SMT Inspection Equipment Market Share Analysis, by System, 2021 and 2031
Figure 111: South America SMT Inspection Equipment Market, Incremental Opportunity, by System, 2021‒2031
Figure 112: South America SMT Inspection Equipment Market Projections by Dimension, Value (US$ Mn), 2017‒2031
Figure 113: South America SMT Inspection Equipment Market Share Analysis, by Dimension, 2021 and 2031
Figure 114: South America SMT Inspection Equipment Market, Incremental Opportunity, by Dimension, 2021‒2031
Figure 115: South America SMT Inspection Equipment Market Projections by Configuration, Value (US$ Mn), 2017‒2031
Figure 116: South America SMT Inspection Equipment Market Share Analysis, by Configuration, 2021 and 2031
Figure 117: South America SMT Inspection Equipment Market, Incremental Opportunity, by Configuration, 2021‒2031
Figure 118: South America SMT Inspection Equipment Market Projections by Phase, Value (US$ Mn), 2017‒2031
Figure 119: South America SMT Inspection Equipment Market Share Analysis, by Phase, 2021 and 2031
Figure 120: South America SMT Inspection Equipment Market, Incremental Opportunity, by Phase, 2021‒2031
Figure 121: South America SMT Inspection Equipment Market Projections by End-user, Value (US$ Mn), 2017‒2031
Figure 122: South America SMT Inspection Equipment Market Share Analysis, by End-user, 2021 and 2031
Figure 123: South America SMT Inspection Equipment Market, Incremental Opportunity, by End-user, 2021‒2031
Figure 124: South America SMT Inspection Equipment Market Projections by Country and sub-region, Value (US$ Mn), 2017‒2031
Figure 125: South America SMT Inspection Equipment Market Share Analysis, by Country and sub-region 2021 and 2031
Figure 126: South America SMT Inspection Equipment Market, Incremental Opportunity, by Country and sub-region, 2021‒2031
Figure 127: Company Share Analysis (2021)
Copyright © Transparency Market Research, Inc. All Rights reserved
Trust Online

SMT Inspection Equipment Market