
Reports
Reports
Analysts’ Viewpoint on Smart Oven Market Scenario
Smart ovens simplify cooking and help reduce the expenses on different types of cooking appliances. As a result, rise in shift toward the manufacture of smart ovens is anticipated to boost the smart oven market in the near future. Companies operating in the smart oven market are increasingly focusing on manufacturing products that offer multiple functions including toasting, baking, roasting, broiling, slow cooking, and pizza making. Burgeoning growth in e-commerce and online shopping apps is translating into lucrative revenue opportunities for stakeholders in the smart oven market, especially post the peak of the COVID-19 pandemic.
Smart oven is a high-tech oven that comes with various functionalities including the ability to make certain adjustments with just the push of a button. Basic features of smart ovens are similar to that of conventional ovens; however, smart ovens are simpler and easier to use, as smart technologies such as IoT and artificial intelligence are infused into the oven to increase automation.
The global smart oven market is likely to grow at a rapid pace during the forecast period, owing to the increase in preference for smart appliances around the globe due to their convenience in daily life.
Food outlet businesses are growing significantly owing to the rise in number of people preferring to dine out at such places. This is directly impacting expenses made on kitchen appliances including smart high-speed ovens. In turn, this is anticipated to boost the demand for smart commercial ovens, including conveyor ovens.
Increase in purchase of household appliances is also expected to propel the market in the near future. According to the Federal Reserve Bank of St. Louis, U.S., personal consumption expenses for household appliances stood at US$ 71.20 Bn in 2020, a rise from US$ 65.20 Bn in 2019. Growth in production of smart ovens with artificial intelligence is an emerging trend in the smart oven market. This is also anticipated to augment the demand for these ovens in the next few years.
The millennial generation is increasingly dominating the global workforce. Large percentage of millennials possess high purchasing ability and are inclined toward tech-infused products. Smart oven is considered one of the best smart kitchen appliances by many millennials.
Countries around the world are witnessing rapid urbanization. People in urban places are more exposed to new technological innovations and product launches (including intelligent ovens). According to the statistical information published by the World Bank, 56% of the global population was living in urban places in 2019, a rise from 55% in 2018.
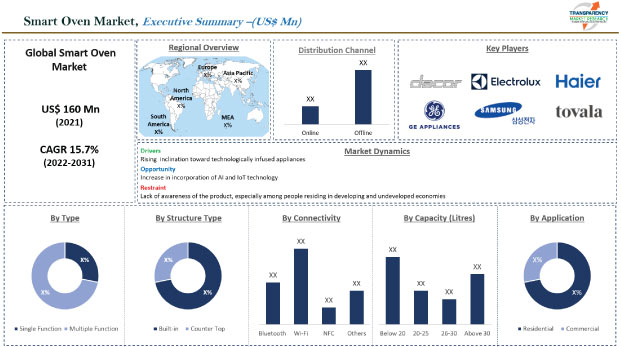
In terms of type, the multiple function ovens segment held major share of around 70% of the global market in 2021. It is likely to maintain the status quo with a significant growth rate during the forecast period. Demand for multiple-function ovens is driven by the increase in number of oven users who prefer to own a single smart oven for multiple cooking purposes such as grilling, baking, roasting, and defrosting.
Smart ovens are classified into built-in and countertop in terms of structure type. The built-in segment dominated the global smart oven market with around 54% share in 2021. Dominance of the built-in segment is primarily ascribed to the seamless, sleek, and futuristic design of the product. Larger cooking capacity vis-à-vis most countertops available in the market is also likely to boost the demand for built-in ovens.
North America held the largest share of around 35% of the global smart oven market in 2021. Increase in penetration of smart homes is leading to a rise in adoption of smart appliances such as cookers and ovens. This is expected to positively impact the market in the region.
Europe and Asia Pacific also have a large consumer base for smart ovens. These regions held significant share of the market in 2021. Europe is anticipated to be the fastest-growing market for smart ovens during the forecast period. Market players are increasingly introducing smart ovens in these regions to attract more customers.
South America has a large customer base as compared to Middle East & Africa. However, the market in Middle East & Africa is likely to grow at a faster pace during the forecast period. Rise in disposable income of the people, increase in employment & business opportunities, and changing lifestyles of individuals in South America and the Middle East & Africa are providing lucrative opportunities for smart oven retailers in these regions.
Players operating in the global smart oven market are increasingly focusing on investing in expansion of their manufacturing plants. This is likely to bolster their manufacturing capacity and increase the production of innovative ovens. For instance, in December 2021, GE Appliances announced its plan to invest US$ 118 Mn in the expansion of its manufacturing facility in Northwest Georgia.
BSH Home Appliances Corporation, Dacor, Inc., Haier Inc., LG Electronics, Tovala, Sub-Zero Group, Inc., Ge Appliances, Breville Group Limited, Electrolux, Samsung, and Candy Hoover Group S.R.L. are the key stakeholders operating in the smart oven market.
Each of these players has been profiled in the smart oven market report based on parameters such as company overview, financial overview, business strategies, product portfolio, business segments, and recent developments
|
Attribute |
Detail |
|
Market Value of Smart Oven in 2021 |
US$ 160.0 Mn |
|
Market Forecast Value in 2031 |
US$ 666.8 Mn |
|
Growth Rate (CAGR) |
15.7% |
|
Forecast Period |
2022–2031 |
|
Historical Data Available for |
2017–2020 |
|
Quantitative Units |
US$ Mn for Value & Thousand Units for Volume |
|
Market Analysis |
It includes cross-segment analysis at the global as well as regional levels. Furthermore, the qualitative analysis includes drivers, restraints, opportunities, key trends, Porter’s Five Forces analysis, value chain analysis, and key trend analysis. |
|
Competition Landscape |
|
|
Format |
Electronic (PDF) + Excel |
|
Market Segmentation |
|
|
Regions Covered |
|
|
Countries Covered |
|
|
Companies Profiled |
|
|
Customization Scope |
Available upon request |
|
Pricing |
Available upon request |
The market stood at US$ 160 Mn in 2021
The market is estimated to expand at a CAGR of 15.7% during 2022-2031
• Rise in penetration of smart homes • Increase in penetration of IoT enabled devices
The residential segment accounted for around 65% share of the market in 2021
Asia Pacific is likely to be one of the lucrative markets in the near future
GE Appliances, Breville Group Limited, Electrolux, SAMSUNG, Candy Hoover Group S.r.l., BSH Home Appliances Corporation, Dacor, Inc., Haier Inc., LG Electronics, TOVALA, and Sub-Zero Group, Inc.
1. Preface
1.1. Market Definition and Scope
1.2. Market Segmentation
1.3. Key Research Objectives
1.4. Research Highlights
2. Assumptions
3. Research Methodology
4. Executive Summary
5. Market Overview
5.1. Market Dynamics
5.1.1. Drivers
5.1.2. Restraints
5.1.3. Opportunities
5.2. Key Trends Analysis
5.2.1. Demand Side Analysis
5.2.2. Supply Side Analysis
5.3. Key Market Indicators
5.3.1. Oven Market Overview
5.4. Porter’s Five Forces Analysis
5.5. Value Chain Analysis
5.6. Industry SWOT Analysis
5.7. COVID-19 Impact Analysis
5.8. Technology Overview
5.9. Global Smart Oven Market Analysis and Forecast, 2017 - 2031
5.9.1. Market Value Projections (US$ Mn)
5.9.2. Market Volume Projections (Thousand Units)
6. Global Smart Oven Market Analysis and Forecast, By Type
6.1. Global Smart Oven Market Size (US$ Mn and Thousand Units), By Type, 2017 - 2031
6.1.1. Single Function
6.1.2. Multiple Function
6.2. Incremental Opportunity, By Type
7. Global Smart Oven Market Analysis and Forecast, By Structure Type
7.1. Global Smart Oven Market Size (US$ Mn and Thousand Units), By Structure Type, 2017 - 2031
7.1.1. Built-in
7.1.2. Counter Top
7.2. Incremental Opportunity, By Structure Type
8. Global Smart Oven Market Analysis and Forecast, By Connectivity
8.1. Global Smart Oven Market Size (US$ Mn and Thousand Units), By Connectivity, 2017 - 2031
8.1.1. Bluetooth
8.1.2. Wi-Fi
8.1.3. NFC
8.1.4. Others
8.2. Incremental Opportunity, By Connectivity
9. Global Smart Oven Market Analysis and Forecast, By Capacity (Liters)
9.1. Global Smart Oven Market Size (US$ Mn and Thousand Units), By Capacity, 2017 - 2031
9.1.1. Below 20
9.1.2. 20-25
9.1.3. 26-30
9.1.4. Above 30
9.2. Incremental Opportunity, By Capacity
10. Global Smart Oven Market Analysis and Forecast, By Application
10.1. Global Smart Oven Market Size (US$ Mn and Thousand Units), By Application, 2017 - 2031
10.1.1. Residential
10.1.2. Commercial
10.2. Incremental Opportunity, By Application
11. Global Smart Oven Market Analysis and Forecast, By Distribution Channel
11.1. Global Smart Oven Market Size (US$ Mn and Thousand Units), By Distribution Channel, 2017 - 2031
11.1.1. Online Stores
11.1.2. Offline Stores
11.2. Incremental Opportunity, By Distribution Channel
12. Global Smart Oven Market Analysis and Forecast, Region
12.1. Global Smart Oven Market Size (US$ Mn and Thousand Units), By Region, 2017 - 2031
12.1.1. North America
12.1.2. Europe
12.1.3. Asia Pacific
12.1.4. Middle East & Africa
12.1.5. South America
12.2. Incremental Opportunity, By Region
13. North America Smart Oven Market Analysis and Forecast
13.1. Regional Snapshot
13.2. Price Trend Analysis
13.2.1. Weighted Average Selling Price (US$)
13.3. Brand Analysis
13.4. Consumer Buying Behavior Analysis
13.4.1. Brand Awareness
13.4.2. Average Spend
13.4.3. Purchasing Factors
13.5. Key Trends Analysis
13.5.1. Demand Side Analysis
13.5.2. Supply Side Analysis
13.6. COVID-19 Impact Analysis
13.7. Smart Oven Market Size (US$ Mn and Thousand Units), By Type, 2017 - 2031
13.7.1. Single Function
13.7.2. Multiple Function
13.8. Smart Oven Market Size (US$ Mn and Thousand Units), By Structure Type, 2017 - 2031
13.8.1. Built-in
13.8.2. Counter Top
13.9. Smart Oven Market Size (US$ Mn and Thousand Units), By Connectivity, 2017 - 2031
13.9.1. Bluetooth
13.9.2. Wi-Fi
13.9.3. NFC
13.9.4. Others
13.10. Smart Oven Market Size (US$ Mn and Thousand Units), By Capacity (Liters), 2017 - 2031
13.10.1. Below 20
13.10.2. 20-25
13.10.3. 26-30
13.10.4. Above 30
13.11. Smart Oven Market Size (US$ Mn and Thousand Units), By Application, 2017 - 2031
13.11.1. Residential
13.11.2. Commercial
13.12. Smart Oven Market Size (US$ Mn and Thousand Units), By Distribution Channel, 2017 - 2031
13.12.1. Online
13.12.2. Offline
13.13. Smart Oven Market Size (US$ Mn and Thousand Units), By Country & Sub-region, 2017 - 2031
13.13.1. The U.S.
13.13.2. Canada
13.13.3. Rest of North America
13.14. Incremental Opportunity Analysis
14. Europe Smart Oven Market Analysis and Forecast
14.1. Regional Snapshot
14.2. Price Trend Analysis
14.2.1. Weighted Average Selling Price (US$)
14.3. Brand Analysis
14.4. Consumer Buying Behavior Analysis
14.4.1. Brand Awareness
14.4.2. Average Spend
14.4.3. Purchasing Factors
14.5. Key Trends Analysis
14.5.1. Demand Side Analysis
14.5.2. Supply Side Analysis
14.6. COVID-19 Impact Analysis
14.7. Smart Oven Market Size (US$ Mn and Thousand Units), By Type, 2017 - 2031
14.7.1. Single Function
14.7.2. Multiple Function
14.8. Smart Oven Market Size (US$ Mn and Thousand Units), By Structure Type, 2017 - 2031
14.8.1. Built-in
14.8.2. Counter-Top
14.9. Smart Oven Market Size (US$ Mn and Thousand Units), By Connectivity, 2017 - 2031
14.9.1. Bluetooth
14.9.2. Wi-Fi
14.9.3. NFC
14.9.4. Others
14.10. Smart Oven Market Size (US$ Mn and Thousand Units), By Capacity (Liters), 2017 - 2031
14.10.1. Below 20
14.10.2. 20-25
14.10.3. 26-30
14.10.4. Above 30
14.11. Smart Oven Market Size (US$ Mn and Thousand Units), By Application, 2017 - 2031
14.11.1. Residential
14.11.2. Commercial
14.12. Smart Oven Market Size (US$ Mn and Thousand Units), By Distribution Channel, 2017 - 2031
14.12.1. Online
14.12.2. Offline
14.13. Smart Oven Market Size (US$ Mn and Thousand Units), By Country & Sub-region, 2017 - 2031
14.13.1. U.K.
14.13.2. Germany
14.13.3. France
14.13.4. Rest of Europe
14.14. Incremental Opportunity Analysis
15. Asia Pacific Smart Oven Market Analysis and Forecast
15.1. Regional Snapshot
15.2. Price Trend Analysis
15.2.1. Weighted Average Selling Price (US$)
15.3. Brand Analysis
15.4. Consumer Buying Behavior Analysis
15.4.1. Brand Awareness
15.4.2. Average Spend
15.4.3. Purchasing Factors
15.5. Key Trends Analysis
15.5.1. Demand Side Analysis
15.5.2. Supply Side Analysis
15.6. COVID-19 Impact Analysis
15.7. Smart Oven Market Size (US$ Mn and Thousand Units), By Type, 2017 - 2031
15.7.1. Single Function
15.7.2. Multiple Function
15.8. Smart Oven Market Size (US$ Mn and Thousand Units), By Structure Type, 2017 - 2031
15.8.1. Built-in
15.8.2. Counter-Top
15.9. Smart Oven Market Size (US$ Mn and Thousand Units), By Connectivity, 2017 - 2031
15.9.1. Bluetooth
15.9.2. Wi-Fi
15.9.3. NFC
15.9.4. Others
15.10. Smart Oven Market Size (US$ Mn and Thousand Units), By Capacity (Liters), 2017 - 2031
15.10.1. Below 20
15.10.2. 20-25
15.10.3. 26-30
15.10.4. Above 30
15.11. Smart Oven Market Size (US$ Mn and Thousand Units), By Application, 2017 - 2031
15.11.1. Residential
15.11.2. Commercial
15.12. Smart Oven Market Size (US$ Mn and Thousand Units), By Distribution Channel, 2017 - 2031
15.12.1. Online
15.12.2. Offline
15.13. Smart Oven Market Size (US$ Mn and Thousand Units), By Country & Sub-region, 2017 - 2031
15.13.1. China
15.13.2. India
15.13.3. Japan
15.13.4. Rest of Asia Pacific
15.14. Incremental Opportunity Analysis
16. Middle East & Africa Smart Oven Market Analysis and Forecast
16.1. Regional Snapshot
16.2. Price Trend Analysis
16.2.1. Weighted Average Selling Price (US$)
16.3. Brand Analysis
16.4. Consumer Buying Behavior Analysis
16.4.1. Brand Awareness
16.4.2. Average Spend
16.4.3. Purchasing Factors
16.5. Key Trends Analysis
16.5.1. Demand Side Analysis
16.5.2. Supply Side Analysis
16.6. COVID-19 Impact Analysis
16.7. Smart Oven Market Size (US$ Mn and Thousand Units), By Type, 2017 - 2031
16.7.1. Single Function
16.7.2. Multiple Function
16.8. Smart Oven Market Size (US$ Mn and Thousand Units), By Structure Type, 2017 - 2031
16.8.1. Built-in
16.8.2. Counter Top
16.9. Smart Oven Market Size (US$ Mn and Thousand Units), By Connectivity, 2017 - 2031
16.9.1. Bluetooth
16.9.2. Wi-Fi
16.9.3. NFC
16.9.4. Others
16.10. Smart Oven Market Size (US$ Mn and Thousand Units), By Capacity (Liters), 2017 - 2031
16.10.1. Below 20
16.10.2. 20-25
16.10.3. 26-30
16.10.4. Above 30
16.11. Smart Oven Market Size (US$ Mn and Thousand Units), By Application, 2017 - 2031
16.11.1. Residential
16.11.2. Commercial
16.12. Smart Oven Market Size (US$ Mn and Thousand Units), By Distribution Channel, 2017 - 2031
16.12.1. Online
16.12.2. Offline
16.13. Smart Oven Market Size (US$ Mn and Thousand Units), By Country & Sub-region, 2017 - 2031
16.13.1. GCC
16.13.2. South Africa
16.13.3. Rest of Middle East & Africa
16.14. Incremental Opportunity Analysis
17. South America Smart Oven Market Analysis and Forecast
17.1. Regional Snapshot
17.2. Price Trend Analysis
17.2.1. Weighted Average Selling Price (US$)
17.3. Brand Analysis
17.4. Consumer Buying Behavior Analysis
17.4.1. Brand Awareness
17.4.2. Average Spend
17.4.3. Purchasing Factors
17.5. Key Trends Analysis
17.5.1. Demand Side Analysis
17.5.2. Supply Side Analysis
17.6. COVID-19 Impact Analysis
17.7. Smart Oven Market Size (US$ Mn and Thousand Units), By Type, 2017 - 2031
17.7.1. Single Function
17.7.2. Multiple Function
17.8. Smart Oven Market Size (US$ Mn and Thousand Units), By Structure Type, 2017 - 2031
17.8.1. Built-in
17.8.2. Counter Top
17.9. Smart Oven Market Size (US$ Mn and Thousand Units), By Connectivity, 2017 - 2031
17.9.1. Bluetooth
17.9.2. Wi-Fi
17.9.3. NFC
17.9.4. Others
17.10. Smart Oven Market Size (US$ Mn and Thousand Units), By Capacity (Liters), 2017 - 2031
17.10.1. Below 20
17.10.2. 20-25
17.10.3. 26-30
17.10.4. Above 30
17.11. Smart Oven Market Size (US$ Mn and Thousand Units), By Application, 2017 - 2031
17.11.1. Residential
17.11.2. Commercial
17.12. Smart Oven Market Size (US$ Mn and Thousand Units), By Distribution Channel, 2017 - 2031
17.12.1. Online
17.12.2. Offline
17.13. Smart Oven Market Size (US$ Mn and Thousand Units), By Country & Sub-region, 2017 - 2031
17.13.1. Brazil
17.13.2. Rest of South America
17.14. Incremental Opportunity Analysis
18. Competition Landscape
18.1. Market Player – Competition Dashboard
18.2. Market Share Analysis (%), 2021
18.3. Company Profiles (Details – Company Overview, Sales Area/Geographical Presence, Financial/Revenue, Strategy & Business Overview, Sales Channel Analysis, Size Portfolio)
18.3.1. BSH Home Appliances Corporation
18.3.1.1. Company Overview
18.3.1.2. Sales Area/Geographical Presence
18.3.1.3. Financial/Revenue
18.3.1.4. Strategy & Business Overview
18.3.1.5. Sales Channel Analysis
18.3.1.6. Size Portfolio
18.3.2. Dacor, Inc.
18.3.2.1. Company Overview
18.3.2.2. Sales Area/Geographical Presence
18.3.2.3. Financial/Revenue
18.3.2.4. Strategy & Business Overview
18.3.2.5. Sales Channel Analysis
18.3.2.6. Size Portfolio
18.3.3. Haier Inc.
18.3.3.1. Company Overview
18.3.3.2. Sales Area/Geographical Presence
18.3.3.3. Financial/Revenue
18.3.3.4. Strategy & Business Overview
18.3.3.5. Sales Channel Analysis
18.3.3.6. Size Portfolio
18.3.4. LG Electronics
18.3.4.1. Company Overview
18.3.4.2. Sales Area/Geographical Presence
18.3.4.3. Financial/Revenue
18.3.4.4. Strategy & Business Overview
18.3.4.5. Sales Channel Analysis
18.3.4.6. Size Portfolio
18.3.5. Tovala
18.3.5.1. Company Overview
18.3.5.2. Sales Area/Geographical Presence
18.3.5.3. Financial/Revenue
18.3.5.4. Strategy & Business Overview
18.3.5.5. Sales Channel Analysis
18.3.5.6. Size Portfolio
18.3.6. Sub-Zero Group, Inc.
18.3.6.1. Company Overview
18.3.6.2. Sales Area/Geographical Presence
18.3.6.3. Financial/Revenue
18.3.6.4. Strategy & Business Overview
18.3.6.5. Sales Channel Analysis
18.3.6.6. Size Portfolio
18.3.7. GE Appliances
18.3.7.1. Company Overview
18.3.7.2. Sales Area/Geographical Presence
18.3.7.3. Financial/Revenue
18.3.7.4. Strategy & Business Overview
18.3.7.5. Sales Channel Analysis
18.3.7.6. Size Portfolio
18.3.8. Breville Group Limited
18.3.8.1. Company Overview
18.3.8.2. Sales Area/Geographical Presence
18.3.8.3. Financial/Revenue
18.3.8.4. Strategy & Business Overview
18.3.8.5. Sales Channel Analysis
18.3.8.6. Size Portfolio
18.3.9. Electrolux
18.3.9.1. Company Overview
18.3.9.2. Sales Area/Geographical Presence
18.3.9.3. Financial/Revenue
18.3.9.4. Strategy & Business Overview
18.3.9.5. Sales Channel Analysis
18.3.9.6. Size Portfolio
18.3.10. Samsung
18.3.10.1. Company Overview
18.3.10.2. Sales Area/Geographical Presence
18.3.10.3. Financial/Revenue
18.3.10.4. Strategy & Business Overview
18.3.10.5. Sales Channel Analysis
18.3.10.6. Size Portfolio
18.3.11. Candy Hoover Group S.R.L.
18.3.11.1. Company Overview
18.3.11.2. Sales Area/Geographical Presence
18.3.11.3. Financial/Revenue
18.3.11.4. Strategy & Business Overview
18.3.11.5. Sales Channel Analysis
18.3.11.6. Size Portfolio
19. Key Takeaways
19.1. Identification of Potential Market Spaces
19.1.1. Type
19.1.2. Structure Type
19.1.3. Connectivity
19.1.4. Capacity
19.1.5. Application
19.1.6. Distribution Channel
19.1.7. Geography
19.2. Understanding the Buying Process of Customers
19.3. Preferred Sales & Marketing Strategy
List of Tables
Table 1: Global Smart Oven Market, by Type, Thousand Units, 2017-2031
Table 2: Global Smart Oven Market, by Type, US$ Mn, 2017-2031
Table 3: Global Smart Oven Market, by Structure Type, Thousand Units, 2017-2031
Table 4: Global Smart Oven Market, by Structure Type, US$ Mn, 2017-2031
Table 5: Global Smart Oven Market, by Connectivity, Thousand Units, 2017-2031
Table 6: Global Smart Oven Market, by Connectivity, US$ Mn, 2017-2031
Table 7: Global Smart Oven Market, by Capacity, Thousand Units, 2017-2031
Table 8: Global Smart Oven Market, by Capacity, US$ Mn, 2017-2031
Table 9: Global Smart Oven Market, by Application, Thousand Units, 2017-2031
Table 10: Global Smart Oven Market, by Application, US$ Mn, 2017-2031
Table 11: Global Smart Oven Market, by Distribution Channel, Thousand Units, 2017-2031
Table 12: Global Smart Oven Market, by Distribution Channel, US$ Mn, 2017-2031
Table 13: Global Smart Oven Market, by Region, Thousand Units, 2017-2031
Table 14: Global Smart Oven Market, by Region, US$ Mn, 2017-2031
Table 15: North America Smart Oven Market, by Type, Thousand Units, 2017-2031
Table 16: North America Smart Oven Market, by Type, US$ Mn, 2017-2031
Table 17: North America Smart Oven Market, by Structure Type, Thousand Units, 2017-2031
Table 18: North America Smart Oven Market, by Structure Type, US$ Mn, 2017-2031
Table 19: North America Smart Oven Market, by Connectivity, Thousand Units, 2017-2031
Table 20: North America Smart Oven Market, by Connectivity, US$ Mn, 2017-2031
Table 21: North America Smart Oven Market, by Capacity, Thousand Units, 2017-2031
Table 22: North America Smart Oven Market, by Capacity, US$ Mn, 2017-2031
Table 23: North America Smart Oven Market, by Application, Thousand Units, 2017-2031
Table 24: North America Smart Oven Market, by Application, US$ Mn, 2017-2031
Table 25: North America Smart Oven Market, by Distribution Channel, Thousand Units, 2017-2031
Table 26: North America Smart Oven Market, by Distribution Channel, US$ Mn, 2017-2031
Table 27: North America Smart Oven Market, by Country, Thousand Units, 2017-2031
Table 28: North America Smart Oven Market, by Country, US$ Mn, 2017-2031
Table 29: Europe Smart Oven Market, by Type, Thousand Units, 2017-2031
Table 30: Europe Smart Oven Market, by Type, US$ Mn, 2017-2031
Table 31: Europe Smart Oven Market, by Structure Type, Thousand Units, 2017-2031
Table 32: Europe Smart Oven Market, by Structure Type, US$ Mn, 2017-2031
Table 33: Europe Smart Oven Market, by Connectivity, Thousand Units, 2017-2031
Table 34: Europe Smart Oven Market, by Connectivity, US$ Mn, 2017-2031
Table 35: Europe Smart Oven Market, by Capacity, Thousand Units, 2017-2031
Table 36: Europe Smart Oven Market, by Capacity, US$ Mn, 2017-2031
Table 37: Europe Smart Oven Market, by Application, Thousand Units, 2017-2031
Table 38: Europe Smart Oven Market, by Application, US$ Mn, 2017-2031
Table 39: Europe Smart Oven Market, by Distribution Channel, Thousand Units, 2017-2031
Table 40: Europe Smart Oven Market, by Distribution Channel, US$ Mn, 2017-2031
Table 41: Europe Smart Oven Market, by Country, Thousand Units, 2017-2031
Table 42: Europe Smart Oven Market, by Country, US$ Mn, 2017-2031
Table 43: Asia Pacific Smart Oven Market, by Type, Thousand Units, 2017-2031
Table 44: Asia Pacific Smart Oven Market, by Type, US$ Mn, 2017-2031
Table 45: Asia Pacific Smart Oven Market, by Structure Type, Thousand Units, 2017-2031
Table 46: Asia Pacific Smart Oven Market, by Structure Type, US$ Mn, 2017-2031
Table 47: Asia Pacific Smart Oven Market, by Connectivity, Thousand Units, 2017-2031
Table 48: Asia Pacific Smart Oven Market, by Connectivity, US$ Mn, 2017-2031
Table 49: Asia Pacific Smart Oven Market, by Capacity, Thousand Units, 2017-2031
Table 50: Asia Pacific Smart Oven Market, by Capacity, US$ Mn, 2017-2031
Table 51: Asia Pacific Smart Oven Market, by Application, Thousand Units, 2017-2031
Table 52: Asia Pacific Smart Oven Market, by Application, US$ Mn, 2017-2031
Table 53: Asia Pacific Smart Oven Market, by Distribution Channel, Thousand Units, 2017-2031
Table 54: Asia Pacific Smart Oven Market, by Distribution Channel, US$ Mn, 2017-2031
Table 55: Asia Pacific Smart Oven Market, by Country, Thousand Units, 2017-2031
Table 56: Asia Pacific Smart Oven Market, by Country, US$ Mn, 2017-2031
Table 57: Middle East & Africa Smart Oven Market, by Type, Thousand Units, 2017-2031
Table 58: Middle East & Africa Smart Oven Market, by Type, US$ Mn, 2017-2031
Table 59: Middle East & Africa Smart Oven Market, by Structure Type, Thousand Units, 2017-2031
Table 60: Middle East & Africa Smart Oven Market, by Structure Type, US$ Mn, 2017-2031
Table 61: Middle East & Africa Smart Oven Market, by Connectivity, Thousand Units, 2017-2031
Table 62: Middle East & Africa Smart Oven Market, by Connectivity, US$ Mn, 2017-2031
Table 63: Middle East & Africa Smart Oven Market, by Capacity, Thousand Units, 2017-2031
Table 64: Middle East & Africa Smart Oven Market, by Capacity, US$ Mn, 2017-2031
Table 65: Middle East & Africa Smart Oven Market, by Application, Thousand Units, 2017-2031
Table 66: Middle East & Africa Smart Oven Market, by Application, US$ Mn, 2017-2031
Table 67: Middle East & Africa Smart Oven Market, by Distribution Channel, Thousand Units, 2017-2031
Table 68: Middle East & Africa Smart Oven Market, by Distribution Channel, US$ Mn, 2017-2031
Table 69: Middle East & Africa Smart Oven Market, by Country, Thousand Units, 2017-2031
Table 70: Middle East & Africa Smart Oven Market, by Country, US$ Mn, 2017-2031
Table 71: South America Smart Oven Market, by Type, Thousand Units, 2017-2031
Table 72: South America Smart Oven Market, by Type, US$ Mn, 2017-2031
Table 73: South America Smart Oven Market, by Structure Type, Thousand Units, 2017-2031
Table 74: South America Smart Oven Market, by Structure Type, US$ Mn, 2017-2031
Table 75: South America Smart Oven Market, by Connectivity, Thousand Units, 2017-2031
Table 76: South America Smart Oven Market, by Connectivity, US$ Mn, 2017-2031
Table 77: South America Smart Oven Market, by Capacity, Thousand Units, 2017-2031
Table 78: South America Smart Oven Market, by Capacity, US$ Mn, 2017-2031
Table 79: South America Smart Oven Market, by Application, Thousand Units, 2017-2031
Table 80: South America Smart Oven Market, by Application, US$ Mn, 2017-2031
Table 81: South America Smart Oven Market, by Distribution Channel, Thousand Units, 2017-2031
Table 82: South America Smart Oven Market, by Distribution Channel, US$ Mn, 2017-2031
Table 83: South America Smart Oven Market, by Region, Thousand Units, 2017-2031
Table 84: South America Smart Oven Market, by Country, US$ Mn, 2017-2031
List of Figures
Figure 1: Global Smart Oven Market, by Type, Thousand Units, 2017-2031
Figure 2: Global Smart Oven Market, by Type, US$ Mn, 2017-2031
Figure 3: Global Smart Oven Market Incremental Opportunity, by Type, US$ Mn, 2017-2031
Figure 4: Global Smart Oven Market, by Structure Type, Thousand Units, 2017-2031
Figure 5: Global Smart Oven Market, by Structure Type, US$ Mn, 2017-2031
Figure 6: Global Smart Oven Market Incremental Opportunity, by Structure Type, US$ Mn, 2017-2031
Figure 7: Global Smart Oven Market, by Connectivity, Thousand Units, 2017-2031
Figure 8: Global Smart Oven Market, by Connectivity, US$ Mn, 2017-2031
Figure 9: Global Smart Oven Market Incremental Opportunity, by Connectivity, US$ Mn, 2017-2031
Figure 10: Global Smart Oven Market, by Capacity, Thousand Units, 2017-2031
Figure 11: Global Smart Oven Market, by Capacity, US$ Mn, 2017-2031
Figure 12: Global Smart Oven Market Incremental Opportunity, by Capacity, US$ Mn, 2017-2031
Figure 13: Global Smart Oven Market, by Application, Thousand Units, 2017-2031
Figure 14: Global Smart Oven Market, by Application, US$ Mn, 2017-2031
Figure 15: Global Smart Oven Market Incremental Opportunity, by Application, US$ Mn, 2017-2031
Figure 16: Global Smart Oven Market, by Distribution Channel, Thousand Units, 2017-2031
Figure 17: Global Smart Oven Market, by Distribution Channel, US$ Mn, 2017-2031
Figure 18: Global Smart Oven Market Incremental Opportunity, by Distribution Channel, US$ Mn, 2017-2031
Figure 19: Global Smart Oven Market, by Region, Thousand Units, 2017-2031
Figure 20: Global Smart Oven Market, by Region, US$ Mn, 2017-2031
Figure 21: Global Smart Oven Market Incremental Opportunity, by Region, US$ Mn, 2017-2031
Figure 22: North America Smart Oven Market, by Type, Thousand Units, 2017-2031
Figure 23: North America Smart Oven Market, by Type, US$ Mn, 2017-2031
Figure 24: North America Smart Oven Market Incremental Opportunity, by Type, US$ Mn, 2017-2031
Figure 25: North America Smart Oven Market, by Structure Type, Thousand Units, 2017-2031
Figure 26: North America Smart Oven Market, by Structure Type, US$ Mn, 2017-2031
Figure 27: North America Smart Oven Market Incremental Opportunity, by Structure Type, US$ Mn, 2017-2031
Figure 28: North America Smart Oven Market, by Connectivity, Thousand Units, 2017-2031
Figure 29: North America Smart Oven Market, by Connectivity, US$ Mn, 2017-2031
Figure 30: North America Smart Oven Market Incremental Opportunity, by Connectivity, US$ Mn, 2017-2031
Figure 31: North America Smart Oven Market, by Capacity, Thousand Units, 2017-2031
Figure 32: North America Smart Oven Market, by Capacity, US$ Mn, 2017-2031
Figure 33: North America Smart Oven Market Incremental Opportunity, by Capacity, US$ Mn, 2017-2031
Figure 34: North America Smart Oven Market, by Application, Thousand Units, 2017-2031
Figure 35: North America Smart Oven Market, by Application, US$ Mn, 2017-2031
Figure 36: North America Smart Oven Market Incremental Opportunity, by Application, US$ Mn, 2017-2031
Figure 37: North America Smart Oven Market, by Distribution Channel, Thousand Units, 2017-2031
Figure 38: North America Smart Oven Market, by Distribution Channel, US$ Mn, 2017-2031
Figure 39: North America Smart Oven Market Incremental Opportunity, by Distribution Channel, US$ Mn, 2017-2031
Figure 40: North America Smart Oven Market, by Country, Thousand Units, 2017-2031
Figure 41: North America Smart Oven Market, by Country, US$ Mn, 2017-2031
Figure 42: North America Smart Oven Market Incremental Opportunity, by Country, US$ Mn, 2017-2031
Figure 43: Europe Smart Oven Market, by Type, Thousand Units, 2017-2031
Figure 44: Europe Smart Oven Market, by Type, US$ Mn, 2017-2031
Figure 45: Europe Smart Oven Market Incremental Opportunity, by Type, US$ Mn, 2017-2031
Figure 46: Europe Smart Oven Market, by Structure Type, Thousand Units, 2017-2031
Figure 47: Europe Smart Oven Market, by Structure Type, US$ Mn, 2017-2031
Figure 48: Europe Smart Oven Market Incremental Opportunity, by Structure Type, US$ Mn, 2017-2031
Figure 49: Europe Smart Oven Market, by Connectivity, Thousand Units, 2017-2031
Figure 50: Europe Smart Oven Market, by Connectivity, US$ Mn, 2017-2031
Figure 51: Europe Smart Oven Market Incremental Opportunity, by Connectivity, US$ Mn, 2017-2031
Figure 52: Europe Smart Oven Market, by Capacity, Thousand Units, 2017-2031
Figure 53: Europe Smart Oven Market, by Capacity, US$ Mn, 2017-2031
Figure 54: Europe Smart Oven Market Incremental Opportunity, by Capacity, US$ Mn, 2017-2031
Figure 55: Europe Smart Oven Market, by Application, Thousand Units, 2017-2031
Figure 56: Europe Smart Oven Market, by Application, US$ Mn, 2017-2031
Figure 57: Europe Smart Oven Market Incremental Opportunity, by Application, US$ Mn, 2017-2031
Figure 58: Europe Smart Oven Market, by Distribution Channel, Thousand Units, 2017-2031
Figure 59: Europe Smart Oven Market, by Distribution Channel, US$ Mn, 2017-2031
Figure 60: Europe Smart Oven Market Incremental Opportunity, by Distribution Channel, US$ Mn, 2017-2031
Figure 61: Europe Smart Oven Market, by Country, Thousand Units, 2017-2031
Figure 62: Europe Smart Oven Market, by Country, US$ Mn, 2017-2031
Figure 63: Europe Smart Oven Market Incremental Opportunity, by Country, US$ Mn, 2017-2031
Figure 64: Asia Pacific Smart Oven Market, by Type, Thousand Units, 2017-2031
Figure 65: Asia Pacific Smart Oven Market, by Type, US$ Mn, 2017-2031
Figure 66: Asia Pacific Smart Oven Market Incremental Opportunity, by Type, US$ Mn, 2017-2031
Figure 67: Asia Pacific Smart Oven Market, by Structure Type, Thousand Units, 2017-2031
Figure 68: Asia Pacific Smart Oven Market, by Structure Type, US$ Mn, 2017-2031
Figure 69: Asia Pacific Smart Oven Market Incremental Opportunity, by Structure Type, US$ Mn, 2017-2031
Figure 70: Asia Pacific Smart Oven Market, by Connectivity, Thousand Units, 2017-2031
Figure 71: Asia Pacific Smart Oven Market, by Connectivity, US$ Mn, 2017-2031
Figure 72: Asia Pacific Smart Oven Market Incremental Opportunity, by Connectivity, US$ Mn, 2017-2031
Figure 73: Asia Pacific Smart Oven Market, by Capacity, Thousand Units, 2017-2031
Figure 74: Asia Pacific Smart Oven Market, by Capacity, US$ Mn, 2017-2031
Figure 75: Asia Pacific Smart Oven Market Incremental Opportunity, by Capacity, US$ Mn, 2017-2031
Figure 76: Asia Pacific Smart Oven Market, by Application, Thousand Units, 2017-2031
Figure 77: Asia Pacific Smart Oven Market, by Application, US$ Mn, 2017-2031
Figure 78: Asia Pacific Smart Oven Market Incremental Opportunity, by Application, US$ Mn, 2017-2031
Figure 79: Asia Pacific Smart Oven Market, by Distribution Channel, Thousand Units, 2017-2031
Figure 80: Asia Pacific Smart Oven Market, by Distribution Channel, US$ Mn, 2017-2031
Figure 81: Asia Pacific Smart Oven Market Incremental Opportunity, by Distribution Channel, US$ Mn, 2017-2031
Figure 82: Asia Pacific Smart Oven Market, by Country, Thousand Units, 2017-2031
Figure 83: Asia Pacific Smart Oven Market, by Country, US$ Mn, 2017-2031
Figure 84: Asia Pacific Smart Oven Market Incremental Opportunity, by Country, US$ Mn, 2017-2031
Figure 85: Middle East & Africa Smart Oven Market, by Type, Thousand Units, 2017-2031
Figure 86: Middle East & Africa Smart Oven Market, by Type, US$ Mn, 2017-2031
Figure 87: Middle East & Africa Smart Oven Market Incremental Opportunity, by Type, US$ Mn, 2017-2031
Figure 88: Middle East & Africa Smart Oven Market, by Structure Type, Thousand Units, 2017-2031
Figure 89: Middle East & Africa Smart Oven Market, by Structure Type, US$ Mn, 2017-2031
Figure 90: Middle East & Africa Smart Oven Market Incremental Opportunity, by Structure Type, US$ Mn, 2017-2031
Figure 91: Middle East & Africa Smart Oven Market, by Connectivity, Thousand Units, 2017-2031
Figure 92: Middle East & Africa Smart Oven Market, by Connectivity, US$ Mn, 2017-2031
Figure 93: Middle East & Africa Smart Oven Market Incremental Opportunity, by Connectivity, US$ Mn, 2017-2031
Figure 94: Middle East & Africa Smart Oven Market, by Capacity, Thousand Units, 2017-2031
Figure 95: Middle East & Africa Smart Oven Market, by Capacity, US$ Mn, 2017-2031
Figure 96: Middle East & Africa Smart Oven Market Incremental Opportunity, by Capacity, US$ Mn, 2017-2031
Figure 97: Middle East & Africa Smart Oven Market, by Application, Thousand Units, 2017-2031
Figure 98: Middle East & Africa Smart Oven Market, by Application, US$ Mn, 2017-2031
Figure 99: Middle East & Africa Smart Oven Market Incremental Opportunity, by Application, US$ Mn, 2017-2031
Figure 100: Middle East & Africa Smart Oven Market, by Distribution Channel, Thousand Units, 2017-2031
Figure 101: Middle East & Africa Smart Oven Market, by Distribution Channel, US$ Mn, 2017-2031
Figure 102: Middle East & Africa Smart Oven Market Incremental Opportunity, by Distribution Channel, US$ Mn, 2017-2031
Figure 103: Middle East & Africa Smart Oven Market, by Country, Thousand Units, 2017-2031
Figure 104: Middle East & Africa Smart Oven Market, by Country, US$ Mn, 2017-2031
Figure 105: Middle East & Africa Smart Oven Market Incremental Opportunity, by Country, US$ Mn, 2017-2031
Figure 106: South America Smart Oven Market, by Type, Thousand Units, 2017-2031
Figure 107: South America Smart Oven Market, by Type, US$ Mn, 2017-2031
Figure 108: South America Smart Oven Market Incremental Opportunity, by Type, US$ Mn, 2017-2031
Figure 109: South America Smart Oven Market, by Structure Type, Thousand Units, 2017-2031
Figure 110: South America Smart Oven Market, by Structure Type, US$ Mn, 2017-2031
Figure 111: South America Smart Oven Market Incremental Opportunity, by Structure Type, US$ Mn, 2017-2031
Figure 112: South America Smart Oven Market, by Connectivity, Thousand Units, 2017-2031
Figure 113: South America Smart Oven Market, by Connectivity, US$ Mn, 2017-2031
Figure 114: South America Smart Oven Market Incremental Opportunity, by Connectivity, US$ Mn, 2017-2031
Figure 115: South America Smart Oven Market, by Capacity, Thousand Units, 2017-2031
Figure 116: South America Smart Oven Market, by Capacity, US$ Mn, 2017-2031
Figure 117: South America Smart Oven Market Incremental Opportunity, by Capacity, US$ Mn, 2017-2031
Figure 118: South America Smart Oven Market, by Application, Thousand Units, 2017-2031
Figure 119: South America Smart Oven Market, by Application, US$ Mn, 2017-2031
Figure 120: South America Smart Oven Market Incremental Opportunity, by Application, US$ Mn, 2017-2031
Figure 121: South America Smart Oven Market, by Distribution Channel, Thousand Units, 2017-2031
Figure 122: South America Smart Oven Market, by Distribution Channel, US$ Mn, 2017-2031
Figure 123: South America Smart Oven Market Incremental Opportunity, by Distribution Channel, US$ Mn, 2017-2031
Figure 124: South America Smart Oven Market, by Country, Thousand Units, 2017-2031
Figure 125: South America Smart Oven Market, by Country, US$ Mn, 2017-2031
Figure 126: South America Smart Oven Market Incremental Opportunity, by Country, US$ Mn, 2017-2031
Copyright © Transparency Market Research, Inc. All Rights reserved
Trust Online

Smart Oven Market