
Reports
Reports
Analysts’ Viewpoint on Market Scenario
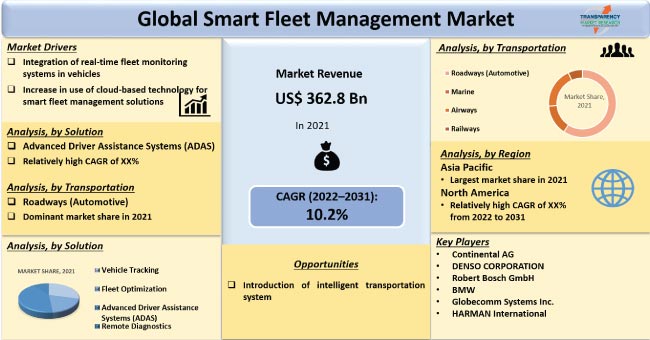
Increased use of cloud-based technology for smart fleet management solutions, integration of real-time fleet monitoring systems in vehicles, and improved vehicle monitoring and fuel management are anticipated to boost the growth of the smart fleet management business across the globe during the forecast period.
However, the growth is anticipated to be constrained by price concerns and worries about cyber security among fleet owners. Additionally, development of intelligent transportation systems, increased business decision-making for fleet owners, improved driver and vehicle safety, and rising demand in developed nations, are all expected to offer significant opportunities for market development in the near future.
Smart fleet management integrates several fleet management technologies in order to manage, maintain, and achieve the most effective operations for the fleet. In addition to driver safety, telematics, tracking, and intelligent surveillance, it offers digital technology applications for maintenance and fuel management.
The fleet management system is utilized to keep an eye on all moving assets in real-time with the help of GPS tracking system. Additionally, it has the capacity to store and control various vehicles, such as corporate cars, vans, trucks, and lorries.
These systems encourage safer driving practices and continuously offer feedback and alerts on driving habits. Businesses across the globe are integrating fleet management systems, as they save fuel, lower maintenance costs, and offer peace of mind to fleet or vehicle owners regarding the management of their vehicles and users.
Fleet managers can monitor if drivers are taking the suggested route or if there are deviations, thanks to real-time vehicle tracking. Cloud-based tools, such as artificial intelligence (AI), internet of things (IoT), and big data, are used to gather the initial fleet management data. Majority of OEMs employ integrated automobile sensors to track expensive products, as these sensors can connect to the cloud and transmit real-time data.
Smart fleet management also includes additional activities such as tracking cars and drivers, managing assets, keeping two-way communication open, controlling driver safety & time, and rescheduling the delivery assignment. Demand for these services is estimated to increase in the near future, which in turn, is likely to propel the demand for smart fleet management during the forecast period.
Developed countries such as U. S. have become major markets for shared mobility services, which includes vehicle leasing, rental, ride sharing, and vehicle subscription. Rise in awareness among consumers about lower cost of shared vehicles, as compared to owned vehicles, is fueling the demand for shared mobility services across the globe.
Surge in demand for shared mobility services is prompting service providers to increase their vehicle fleet, which in turn is estimated to fuel the demand for fleet management systems in the near future.
Moreover, several shared mobility service providers are replacing their old fleet with new energy vehicles. Numerous providers are incorporating connected and automated vehicles owing to an increase in the demand for electric, connected, and automated vehicles from consumers. This is likely to further boost the smart fleet management market size in the near future.
In terms of solution, the global smart fleet management market segmentation comprises vehicle tracking, fleet optimization, advanced driver assistance systems (ADAS), and remote diagnostics. In 2021, the advanced driver assistance system (ADAS) segment accounted for a sizeable 41.14% share of the overall market. The segment has estimated to maintain its leading position and expand at a CAGR of more than 11.4% during the forecast period.
The advanced driver assistance system (ADAS) is designed to support drivers while they are on the roads. Several cutting-edge driver assistance systems are available for specific functions such as lane departure warnings, collision avoidance, etc.
Smart fleet management collects data from the ADAS system to monitor in-vehicle performance and control the traffic environment outside the vehicle, which includes other vehicles, pedestrians, objects, traffic signals, lane markings, and speed limit signs.
The car camera also scans the surrounding area and keeps an eye out for potential hazards. ADAS is crucial to fleet management, as it offers the maximum level of operational effectiveness while assuring the safety of the driver and the asset. These factors are likely to boost the smart fleet management market demand in the upcoming years.
In terms of connectivity, the short-range segment held 58.17% market share. The segment is estimate to maintain its position and expand at a CAGR of more than 10.24% during the forecast period. Examples of short-range connection devices include cameras, ultrasonic sensors, and short-range RADAR. Rapid increase in adoption of the Internet of Things (IoT) is drastically altering the global transportation ecology.
OEMs may trace their installed base globally with help from companies such as Globecomm Systems Inc. They can improve the quality and effectiveness of their service by repairing mistakes more rapidly, cutting down on production halts, and optimizing machine performance close to where they are located. A connected infrastructure includes parking lots, tollgates, intelligent traffic lights, and tollbooths. All these factors are likely to boost the demand for short range fleet management systems during the forecast period.
Analysis of the global market trends reveal that Asia Pacific accounts for a dominant share of the global smart fleet management industry in 2021. This is due to the increase in population; requirement for huge fleet management, rapid urbanization, a strong rail infrastructure; rise in major international trade; and encouraging government initiatives in countries such as China, India, and Indonesia.
Moreover, concerns about driver and vehicle safety and the adoption of stringent government regulations for vehicle maintenance and tracking are some of the key factors aiding market progress in the region.
Europe also holds a significant share of the global industry, followed by North America. Market expansion in the region is anticipated to be aided by population growth and increased telematics and GNSS implementation in fleet management services. Top manufacturers are also releasing brand-new autonomous, connected vehicles for a better driving experience.
The global smart fleet management market has consolidated with a few number of system integrators controlling the market share and major companies possessing the potential to increase the pace of growth by the way of adoption of newer technologies. Notable business strategies adopted by key market players include acquisitions, mergers, and expansion of product portfolios. Some of the key players operating across the globe include BMW, CalAmp, CHAINWAYTSP CO., Ltd., Cisco, Continental AG, DENSO CORPORATION, Globecomm Systems Inc., HARMAN International, IBM Corporation, Otto Marine Limited., Robert Bosch GmbH, Siemens AG, and TomTom International BV.
Key players in the market research report have been profiled based on financial overview, product portfolio, business strategies, business segments, company overview, and recent developments.
|
Attribute |
Detail |
|
Market Size Value in 2021 |
US$ 362.8 Bn |
|
Market Forecast Value in 2031 |
US$ 962.6 Bn |
|
Growth Rate (CAGR) |
10.2% |
|
Forecast Period |
2022–2031 |
|
Historical Data Available for |
2017–2021 |
|
Quantitative Units |
Thousand Units for Volume and US$ Bn for Value |
|
Market Analysis |
It includes cross segment analysis at global as well as regional level. Furthermore, qualitative analysis includes drivers, restraints, opportunities, key trends, Porter’s Five Forces analysis, value chain analysis, and key trend analysis. |
|
Competition Landscape |
|
|
Format |
Electronic (PDF) + Excel |
|
Market Segmentation |
|
|
Regions Covered |
|
|
Countries Covered |
|
|
Companies Profile |
|
|
Customization Scope |
Available upon request |
|
Pricing |
Available upon request |
The market is valued at US$ 362.8 Bn in 2021
The market has expected to advance at a CAGR of 10.2% by 2031
It is expected to be valued at US$ 962.6 Bn in 2031
Integration of real-time fleet monitoring systems in vehicles and rise in use of cloud-based technology for smart fleet management solutions.
The advanced driver assistance system (ADAS) segment accounts for 41.14% share in 2021
Asia Pacific is a highly lucrative region of the global market.
BMW, CalAmp, CHAINWAYTSP CO., Ltd., Cisco, Continental AG, DENSO CORPORATION, Globecomm Systems Inc., HARMAN International, IBM Corporation, Otto Marine Limited., Robert Bosch GmbH, Siemens AG, and TomTom International BV.
1. Preface
1.1. About TMR
1.2. Market Coverage / Taxonomy
1.3. Assumptions and Research Methodology
2. Executive Summary
2.1. Global Market Outlook
2.1.1. Market Size, Thousand Units, US$ Bn, 2017-2031
2.2. Demand & Supply Side Trends
2.3. TMR Analysis and Recommendations
2.4. Competitive Dashboard Analysis
3. Market Overview
3.1. Macro-Economic Factors
3.2. Market Dynamics
3.2.1. Drivers
3.2.2. Restraints
3.2.3. Opportunity
3.3. Market Factor Analysis
3.3.1. Porter’s Five Force Analysis
3.3.2. SWOT Analysis
3.4. Regulatory Scenario
3.5. Key Trend Analysis
3.6. Value Chain Analysis
3.7. Cost Structure Analysis
3.8. Profit Margin Analysis
4. COVID-19 Impact Analysis – Smart Fleet Management Market
5. Global Smart Fleet Management Market, By Solution
5.1. Market Snapshot
5.1.1. Introduction, Definition, and Key Findings
5.1.2. Market Growth & Y-o-Y Projections
5.1.3. Base Point Share Analysis
5.2. Global Smart Fleet Management Market Size Analysis & Forecast, 2017-2031, By Solution
5.2.1. Hardware
5.2.1.1. Vehicle Tracking
5.2.1.2. Fleet Optimization
5.2.1.3. Advanced Driver Assistance Systems (ADAS)
5.2.1.4. Remote Diagnostics
6. Global Smart Fleet Management Market, By Connectivity
6.1. Market Snapshot
6.1.1. Introduction, Definition, and Key Findings
6.1.2. Market Growth & Y-o-Y Projections
6.1.3. Base Point Share Analysis
6.2. Global Smart Fleet Management Market Size Analysis & Forecast, 2017-2031, By Connectivity
6.2.1. Short Range
6.2.2. Long Range
6.2.3. Cloud
7. Global Smart Fleet Management Market, By Transportation
7.1. Market Snapshot
7.1.1. Introduction, Definition, and Key Findings
7.1.2. Market Growth & Y-o-Y Projections
7.1.3. Base Point Share Analysis
7.2. Global Smart Fleet Management Market Size Analysis & Forecast, 2017-2031, By Transportation
7.2.1. Roadways (Automotive)
7.2.2. Marine
7.2.3. Airways
7.2.4. Railways
8. Global Smart Fleet Management Market, by Region
8.1. Market Snapshot
8.1.1. Introduction, Definition, and Key Findings
8.1.2. Market Growth & Y-o-Y Projections
8.1.3. Base Point Share Analysis
8.2. Global Smart Fleet Management Market Size Analysis & Forecast, 2017-2031, By Region
8.2.1. North America
8.2.2. Europe
8.2.3. Asia Pacific
8.2.4. Middle East & Africa
8.2.5. South America
9. North America Smart Fleet Management Market
9.1. Market Snapshot
9.2. Smart Fleet Management Market Size Analysis & Forecast, 2017-2031, By Solution
9.2.1. Hardware
9.2.1.1. Vehicle Tracking
9.2.1.2. Fleet Optimization
9.2.1.3. Advanced Driver Assistance Systems (ADAS)
9.2.1.4. Remote Diagnostics
9.3. Smart Fleet Management Market Size Analysis & Forecast, 2017-2031, By Connectivity
9.3.1. Short Range
9.3.2. Long Range
9.3.3. Cloud
9.4. Smart Fleet Management Market Size Analysis & Forecast, 2017-2031, By Transportation
9.4.1. Roadways (Automotive)
9.4.2. Marine
9.4.3. Airways
9.4.4. Railways
9.5. Key Country Analysis – North America Smart Fleet Management Market Size Analysis & Forecast, 2017-2031
9.5.1. U.S.
9.5.2. Canada
9.5.3. Mexico
10. Europe Smart Fleet Management Market
10.1. Market Snapshot
10.2. Smart Fleet Management Market Size Analysis & Forecast, 2017-2031, By Solution
10.2.1. Hardware
10.2.1.1. Vehicle Tracking
10.2.1.2. Fleet Optimization
10.2.1.3. Advanced Driver Assistance Systems (ADAS)
10.2.1.4. Remote Diagnostics
10.3. Smart Fleet Management Market Size Analysis & Forecast, 2017-2031, By Connectivity
10.3.1. Short Range
10.3.2. Long Range
10.3.3. Cloud
10.4. Smart Fleet Management Market Size Analysis & Forecast, 2017-2031, By Transportation
10.4.1. Roadways (Automotive)
10.4.2. Marine
10.4.3. Airways
10.4.4. Railways
10.5. Key Country Analysis – Europe Smart Fleet Management Market Size Analysis & Forecast, 2017-2031
10.5.1. Germany
10.5.2. U. K.
10.5.3. France
10.5.4. Italy
10.5.5. Spain
10.5.6. Nordic Countries
10.5.7. Russia & CIS
10.5.8. Rest of Europe
11. Asia Pacific Smart Fleet Management Market
11.1. Market Snapshot
11.2. Smart Fleet Management Market Size Analysis & Forecast, 2017-2031, By Solution
11.2.1. Hardware
11.2.1.1. Vehicle Tracking
11.2.1.2. Fleet Optimization
11.2.1.3. Advanced Driver Assistance Systems (ADAS)
11.2.1.4. Remote Diagnostics
11.3. Smart Fleet Management Market Size Analysis & Forecast, 2017-2031, By Connectivity
11.3.1. Short Range
11.3.2. Long Range
11.3.3. Cloud
11.4. Smart Fleet Management Market Size Analysis & Forecast, 2017-2031, By Transportation
11.4.1. Roadways (Automotive)
11.4.2. Marine
11.4.3. Airways
11.4.4. Railways
11.5. Key Country Analysis – Asia Pacific Smart Fleet Management Market Size Analysis & Forecast, 2017-2031
11.5.1. China
11.5.2. India
11.5.3. Japan
11.5.4. ASEAN Countries
11.5.5. South Korea
11.5.6. ANZ
11.5.7. Rest of Asia Pacific
12. Middle East & Africa Smart Fleet Management Market
12.1. Market Snapshot
12.2. Smart Fleet Management Market Size Analysis & Forecast, 2017-2031, By Solution
12.2.1. Hardware
12.2.1.1. Vehicle Tracking
12.2.1.2. Fleet Optimization
12.2.1.3. Advanced Driver Assistance Systems (ADAS)
12.2.1.4. Remote Diagnostics
12.3. Smart Fleet Management Market Size Analysis & Forecast, 2017-2031, By Connectivity
12.3.1. Short Range
12.3.2. Long Range
12.3.3. Cloud
12.4. Smart Fleet Management Market Size Analysis & Forecast, 2017-2031, By Transportation
12.4.1. Roadways (Automotive)
12.4.2. Marine
12.4.3. Airways
12.4.4. Railways
12.5. Key Country Analysis – Middle East & Africa Smart Fleet Management Market Size Analysis & Forecast, 2017-2031
12.5.1. GCC
12.5.2. South Africa
12.5.3. Turkey
12.5.4. Rest of Middle East & Africa
13. South America Smart Fleet Management Market
13.1. Market Snapshot
13.2. Smart Fleet Management Market Size Analysis & Forecast, 2017-2031, By Solution
13.2.1. Hardware
13.2.1.1. Vehicle Tracking
13.2.1.2. Fleet Optimization
13.2.1.3. Advanced Driver Assistance Systems (ADAS)
13.2.1.4. Remote Diagnostics
13.3. Smart Fleet Management Market Size Analysis & Forecast, 2017-2031, By Connectivity
13.3.1. Short Range
13.3.2. Long Range
13.3.3. Cloud
13.4. Smart Fleet Management Market Size Analysis & Forecast, 2017-2031, By Transportation
13.4.1. Roadways (Automotive)
13.4.2. Marine
13.4.3. Airways
13.4.4. Railways
13.5. Key Country Analysis – South America Smart Fleet Management Market Size Analysis & Forecast, 2017-2031
13.5.1. Brazil
13.5.2. Argentina
13.5.3. Rest of South America
14. Competitive Landscape
14.1. Company Share Analysis/ Brand Share Analysis, 2021
14.2. Pricing comparison among key players
14.3. Company Analysis for each player (Company Overview, Company Footprints, Production Locations, Product Portfolio, Competitors & Customers, Subsidiaries & Parent Organization, Recent Developments, Financial Analysis, Profitability, Revenue Share)
15. Company Profile/ Key Players
15.1. BMW
15.1.1. Company Overview
15.1.2. Company Footprints
15.1.3. Production Locations
15.1.4. Product Portfolio
15.1.5. Competitors & Customers
15.1.6. Subsidiaries & Parent Organization
15.1.7. Recent Developments
15.1.8. Financial Analysis
15.1.9. Profitability
15.1.10. Revenue Share
15.2. CalAmp
15.2.1. Company Footprints
15.2.2. Production Locations
15.2.3. Product Portfolio
15.2.4. Competitors & Customers
15.2.5. Subsidiaries & Parent Organization
15.2.6. Recent Developments
15.2.7. Financial Analysis
15.2.8. Profitability
15.2.9. Revenue Share
15.3. CHAINWAYTSP CO., Ltd.
15.3.1. Company Footprints
15.3.2. Production Locations
15.3.3. Product Portfolio
15.3.4. Competitors & Customers
15.3.5. Subsidiaries & Parent Organization
15.3.6. Recent Developments
15.3.7. Financial Analysis
15.3.8. Profitability
15.3.9. Revenue Share
15.4. Cisco
15.4.1. Company Footprints
15.4.2. Production Locations
15.4.3. Product Portfolio
15.4.4. Competitors & Customers
15.4.5. Subsidiaries & Parent Organization
15.4.6. Recent Developments
15.4.7. Financial Analysis
15.4.8. Profitability
15.4.9. Revenue Share
15.5. Continental AG
15.5.1. Company Footprints
15.5.2. Production Locations
15.5.3. Product Portfolio
15.5.4. Competitors & Customers
15.5.5. Subsidiaries & Parent Organization
15.5.6. Recent Developments
15.5.7. Financial Analysis
15.5.8. Profitability
15.5.9. Revenue Share
15.6. DENSO CORPORATION
15.6.1. Company Footprints
15.6.2. Production Locations
15.6.3. Product Portfolio
15.6.4. Competitors & Customers
15.6.5. Subsidiaries & Parent Organization
15.6.6. Recent Developments
15.6.7. Financial Analysis
15.6.8. Profitability
15.6.9. Revenue Share
15.7. Globecomm Systems Inc.
15.7.1. Company Footprints
15.7.2. Production Locations
15.7.3. Product Portfolio
15.7.4. Competitors & Customers
15.7.5. Subsidiaries & Parent Organization
15.7.6. Recent Developments
15.7.7. Financial Analysis
15.7.8. Profitability
15.7.9. Revenue Share
15.8. HARMAN International
15.8.1. Company Footprints
15.8.2. Production Locations
15.8.3. Product Portfolio
15.8.4. Competitors & Customers
15.8.5. Subsidiaries & Parent Organization
15.8.6. Recent Developments
15.8.7. Financial Analysis
15.8.8. Profitability
15.8.9. Revenue Share
15.9. IBM Corporation
15.9.1. Company Footprints
15.9.2. Production Locations
15.9.3. Product Portfolio
15.9.4. Competitors & Customers
15.9.5. Subsidiaries & Parent Organization
15.9.6. Recent Developments
15.9.7. Financial Analysis
15.9.8. Profitability
15.9.9. Revenue Share
15.10. JUTHA MARITIME
15.10.1. Company Footprints
15.10.2. Production Locations
15.10.3. Product Portfolio
15.10.4. Competitors & Customers
15.10.5. Subsidiaries & Parent Organization
15.10.6. Recent Developments
15.10.7. Financial Analysis
15.10.8. Profitability
15.10.9. Revenue Share
15.11. ORBCOMM
15.11.1. Company Footprints
15.11.2. Production Locations
15.11.3. Product Portfolio
15.11.4. Competitors & Customers
15.11.5. Subsidiaries & Parent Organization
15.11.6. Recent Developments
15.11.7. Financial Analysis
15.11.8. Profitability
15.11.9. Revenue Share
15.12. Otto Marine Limited.
15.12.1. Company Footprints
15.12.2. Production Locations
15.12.3. Product Portfolio
15.12.4. Competitors & Customers
15.12.5. Subsidiaries & Parent Organization
15.12.6. Recent Developments
15.12.7. Financial Analysis
15.12.8. Profitability
15.12.9. Revenue Share
15.13. Precious Shipping Public Company Limited
15.13.1. Company Footprints
15.13.2. Production Locations
15.13.3. Product Portfolio
15.13.4. Competitors & Customers
15.13.5. Subsidiaries & Parent Organization
15.13.6. Recent Developments
15.13.7. Financial Analysis
15.13.8. Profitability
15.13.9. Revenue Share
15.14. Robert Bosch GmbH
15.14.1. Company Footprints
15.14.2. Production Locations
15.14.3. Product Portfolio
15.14.4. Competitors & Customers
15.14.5. Subsidiaries & Parent Organization
15.14.6. Recent Developments
15.14.7. Financial Analysis
15.14.8. Profitability
15.14.9. Revenue Share
15.15. Siemens AG
15.15.1. Company Footprints
15.15.2. Production Locations
15.15.3. Product Portfolio
15.15.4. Competitors & Customers
15.15.5. Subsidiaries & Parent Organization
15.15.6. Recent Developments
15.15.7. Financial Analysis
15.15.8. Profitability
15.15.9. Revenue Share
15.16. Sierra Wireless
15.16.1. Company Footprints
15.16.2. Production Locations
15.16.3. Product Portfolio
15.16.4. Competitors & Customers
15.16.5. Subsidiaries & Parent Organization
15.16.6. Recent Developments
15.16.7. Financial Analysis
15.16.8. Profitability
15.16.9. Revenue Share
15.17. TomTom International BV.
15.17.1. Company Footprints
15.17.2. Production Locations
15.17.3. Product Portfolio
15.17.4. Competitors & Customers
15.17.5. Subsidiaries & Parent Organization
15.17.6. Recent Developments
15.17.7. Financial Analysis
15.17.8. Profitability
15.17.9. Revenue Share
15.18. Zonar Systems
15.18.1. Company Footprints
15.18.2. Production Locations
15.18.3. Product Portfolio
15.18.4. Competitors & Customers
15.18.5. Subsidiaries & Parent Organization
15.18.6. Recent Developments
15.18.7. Financial Analysis
15.18.8. Profitability
15.18.9. Revenue Share
15.19. Other Key Players
List of Tables
Table 1: Global Smart Fleet Management Market Volume (Thousand Units) Forecast, by Solution, 2017-2031
Table 2: Global Smart Fleet Management Market Value (US$ Bn) Forecast, by Solution, 2017‒2031
Table 3: Global Smart Fleet Management Market Volume (Thousand Units) Forecast, by Connectivity, 2017-2031
Table 4: Global Smart Fleet Management Market Value (US$ Bn) Forecast, by Connectivity, 2017‒2031
Table 5: Global Smart Fleet Management Market Volume (Thousand Units) Forecast, by Transportation, 2017-2031
Table 6: Global Smart Fleet Management Market Value (US$ Bn) Forecast, by Transportation, 2017‒2031
Table 7: Global Smart Fleet Management Market Volume (Thousand Units) Forecast, by Region, 2017-2031
Table 8: Global Smart Fleet Management Market Value (US$ Bn) Forecast, by Region, 2017‒2031
Table 9: North America Smart Fleet Management Market Volume (Thousand Units) Forecast, by Solution, 2017-2031
Table 10: North America Smart Fleet Management Market Value (US$ Bn) Forecast, by Solution, 2017‒2031
Table 11: North America Smart Fleet Management Market Volume (Thousand Units) Forecast, by Connectivity, 2017-2031
Table 12: North America Smart Fleet Management Market Value (US$ Bn) Forecast, by Connectivity, 2017‒2031
Table 13: North America Smart Fleet Management Market Volume (Thousand Units) Forecast, by Transportation, 2017-2031
Table 14: North America Smart Fleet Management Market Value (US$ Bn) Forecast, by Transportation, 2017‒2031
Table 15: North America Smart Fleet Management Market Volume (Thousand Units) Forecast, by Country, 2017-2031
Table 16: North America Smart Fleet Management Market Value (US$ Bn) Forecast, by Country, 2017‒2031
Table 17: Europe Smart Fleet Management Market Volume (Thousand Units) Forecast, by Solution, 2017-2031
Table 18: Europe Smart Fleet Management Market Value (US$ Bn) Forecast, by Solution, 2017‒2031
Table 19: Europe Smart Fleet Management Market Volume (Thousand Units) Forecast, by Connectivity, 2017-2031
Table 20: Europe Smart Fleet Management Market Value (US$ Bn) Forecast, by Connectivity, 2017‒2031
Table 21: Europe Smart Fleet Management Market Volume (Thousand Units) Forecast, by Transportation, 2017-2031
Table 22: Europe Smart Fleet Management Market Value (US$ Bn) Forecast, by Transportation, 2017‒2031
Table 23: Europe Smart Fleet Management Market Volume (Thousand Units) Forecast, by Country, 2017-2031
Table 24: Europe Smart Fleet Management Market Value (US$ Bn) Forecast, by Country, 2017‒2031
Table 25: Asia Pacific Smart Fleet Management Market Volume (Thousand Units) Forecast, by Solution, 2017-2031
Table 26: Asia Pacific Smart Fleet Management Market Value (US$ Bn) Forecast, by Solution, 2017‒2031
Table 27: Asia Pacific Smart Fleet Management Market Volume (Thousand Units) Forecast, by Connectivity, 2017-2031
Table 28: Asia Pacific Smart Fleet Management Market Value (US$ Bn) Forecast, by Connectivity, 2017‒2031
Table 29: Asia Pacific Smart Fleet Management Market Volume (Thousand Units) Forecast, by Transportation, 2017-2031
Table 30: Asia Pacific Smart Fleet Management Market Value (US$ Bn) Forecast, by Transportation, 2017‒2031
Table 31: Asia Pacific Smart Fleet Management Market Volume (Thousand Units) Forecast, by Country, 2017-2031
Table 32: Asia Pacific Smart Fleet Management Market Value (US$ Bn) Forecast, by Country, 2017‒2031
Table 33: Middle East & Africa Smart Fleet Management Market Volume (Thousand Units) Forecast, by Solution, 2017-2031
Table 34: Middle East & Africa Smart Fleet Management Market Value (US$ Bn) Forecast, by Solution, 2017‒2031
Table 35: Middle East & Africa Smart Fleet Management Market Volume (Thousand Units) Forecast, by Connectivity, 2017-2031
Table 36: Middle East & Africa Smart Fleet Management Market Value (US$ Bn) Forecast, by Connectivity, 2017‒2031
Table 37: Middle East & Africa Smart Fleet Management Market Volume (Thousand Units) Forecast, by Transportation, 2017-2031
Table 38: Middle East & Africa Smart Fleet Management Market Value (US$ Bn) Forecast, by Transportation, 2017‒2031
Table 39: Middle East & Africa Smart Fleet Management Market Volume (Thousand Units) Forecast, by Country, 2017-2031
Table 40: Middle East & Africa Smart Fleet Management Market Value (US$ Bn) Forecast, by Country, 2017‒2031
Table 41: South America Smart Fleet Management Market Volume (Thousand Units) Forecast, by Solution, 2017-2031
Table 42: South America Smart Fleet Management Market Value (US$ Bn) Forecast, by Solution, 2017‒2031
Table 43: South America Smart Fleet Management Market Volume (Thousand Units) Forecast, by Connectivity, 2017-2031
Table 44: South America Smart Fleet Management Market Value (US$ Bn) Forecast, by Connectivity, 2017‒2031
Table 45: South America Smart Fleet Management Market Volume (Thousand Units) Forecast, by Transportation, 2017-2031
Table 46: South America Smart Fleet Management Market Value (US$ Bn) Forecast, by Transportation, 2017‒2031
Table 47: South America Smart Fleet Management Market Volume (Thousand Units) Forecast, by Country, 2017-2031
Table 48: South America Smart Fleet Management Market Value (US$ Bn) Forecast, by Country, 2017‒2031
List of Figures
Figure 1: Global Smart Fleet Management Market Volume (Thousand Units) Forecast, by Solution, 2017-2031
Figure 2: Global Smart Fleet Management Market Value (US$ Bn) Forecast, by Solution, 2017-2031
Figure 3: Global Smart Fleet Management Market, Incremental Opportunity, by Solution, Value (US$ Bn), 2022-2031
Figure 4: Global Smart Fleet Management Market Volume (Thousand Units) Forecast, by Connectivity, 2017-2031
Figure 5: Global Smart Fleet Management Market Value (US$ Bn) Forecast, by Connectivity, 2017-2031
Figure 6: Global Smart Fleet Management Market, Incremental Opportunity, by Connectivity, Value (US$ Bn), 2022-2031
Figure 7: Global Smart Fleet Management Market Volume (Thousand Units) Forecast, by Transportation, 2017-2031
Figure 8: Global Smart Fleet Management Market Value (US$ Bn) Forecast, by Transportation, 2017-2031
Figure 9: Global Smart Fleet Management Market, Incremental Opportunity, by Transportation, Value (US$ Bn), 2022-2031
Figure 10: Global Smart Fleet Management Market Volume (Thousand Units) Forecast, by Region, 2017-2031
Figure 11: Global Smart Fleet Management Market Value (US$ Bn) Forecast, by Region, 2017-2031
Figure 12: Global Smart Fleet Management Market, Incremental Opportunity, by Region, Value (US$ Bn), 2022-2031
Figure 13: North America Smart Fleet Management Market Volume (Thousand Units) Forecast, by Solution, 2017-2031
Figure 14: North America Smart Fleet Management Market Value (US$ Bn) Forecast, by Solution, 2017-2031
Figure 15: North America Smart Fleet Management Market, Incremental Opportunity, by Solution, Value (US$ Bn), 2022-2031
Figure 16: North America Smart Fleet Management Market Volume (Thousand Units) Forecast, by Connectivity, 2017-2031
Figure 17: North America Smart Fleet Management Market Value (US$ Bn) Forecast, by Connectivity, 2017-2031
Figure 18: North America Smart Fleet Management Market, Incremental Opportunity, by Connectivity, Value (US$ Bn), 2022-2031
Figure 19: North America Smart Fleet Management Market Volume (Thousand Units) Forecast, by Transportation, 2017-2031
Figure 20: North America Smart Fleet Management Market Value (US$ Bn) Forecast, by Transportation, 2017-2031
Figure 21: North America Smart Fleet Management Market, Incremental Opportunity, by Transportation, Value (US$ Bn), 2022-2031
Figure 22: North America Smart Fleet Management Market Volume (Thousand Units) Forecast, by Country, 2017-2031
Figure 23: North America Smart Fleet Management Market Value (US$ Bn) Forecast, by Country, 2017-2031
Figure 24: North America Smart Fleet Management Market, Incremental Opportunity, by Country, Value (US$ Bn), 2022-2031
Figure 25: Europe Smart Fleet Management Market Volume (Thousand Units) Forecast, by Solution, 2017-2031
Figure 26: Europe Smart Fleet Management Market Value (US$ Bn) Forecast, by Solution, 2017-2031
Figure 27: Europe Smart Fleet Management Market, Incremental Opportunity, by Solution, Value (US$ Bn), 2022-2031
Figure 28: Europe Smart Fleet Management Market Volume (Thousand Units) Forecast, by Connectivity, 2017-2031
Figure 29: Europe Smart Fleet Management Market Value (US$ Bn) Forecast, by Connectivity, 2017-2031
Figure 30: Europe Smart Fleet Management Market, Incremental Opportunity, by Connectivity, Value (US$ Bn), 2022-2031
Figure 31: Europe Smart Fleet Management Market Volume (Thousand Units) Forecast, by Transportation, 2017-2031
Figure 32: Europe Smart Fleet Management Market Value (US$ Bn) Forecast, by Transportation, 2017-2031
Figure 33: Europe Smart Fleet Management Market, Incremental Opportunity, by Transportation, Value (US$ Bn), 2022-2031
Figure 34: Europe Smart Fleet Management Market Volume (Thousand Units) Forecast, by Country, 2017-2031
Figure 35: Europe Smart Fleet Management Market Value (US$ Bn) Forecast, by Country, 2017-2031
Figure 36: Europe Smart Fleet Management Market, Incremental Opportunity, by Country, Value (US$ Bn), 2022-2031
Figure 37: Asia Pacific Smart Fleet Management Market Volume (Thousand Units) Forecast, by Solution, 2017-2031
Figure 38: Asia Pacific Smart Fleet Management Market Value (US$ Bn) Forecast, by Solution, 2017-2031
Figure 39: Asia Pacific Smart Fleet Management Market, Incremental Opportunity, by Solution, Value (US$ Bn), 2022-2031
Figure 40: Asia Pacific Smart Fleet Management Market Volume (Thousand Units) Forecast, by Connectivity, 2017-2031
Figure 41: Asia Pacific Smart Fleet Management Market Value (US$ Bn) Forecast, by Connectivity, 2017-2031
Figure 42: Asia Pacific Smart Fleet Management Market, Incremental Opportunity, by Connectivity, Value (US$ Bn), 2022-2031
Figure 43: Asia Pacific Smart Fleet Management Market Volume (Thousand Units) Forecast, by Transportation, 2017-2031
Figure 44: Asia Pacific Smart Fleet Management Market Value (US$ Bn) Forecast, by Transportation, 2017-2031
Figure 45: Asia Pacific Smart Fleet Management Market, Incremental Opportunity, by Transportation, Value (US$ Bn), 2022-2031
Figure 46: Asia Pacific Smart Fleet Management Market Volume (Thousand Units) Forecast, by Country, 2017-2031
Figure 47: Asia Pacific Smart Fleet Management Market Value (US$ Bn) Forecast, by Country, 2017-2031
Figure 48: Asia Pacific Smart Fleet Management Market, Incremental Opportunity, by Country, Value (US$ Bn), 2022-2031
Figure 49: Middle East & Africa Smart Fleet Management Market Volume (Thousand Units) Forecast, by Solution, 2017-2031
Figure 50: Middle East & Africa Smart Fleet Management Market Value (US$ Bn) Forecast, by Solution, 2017-2031
Figure 51: Middle East & Africa Smart Fleet Management Market, Incremental Opportunity, by Solution, Value (US$ Bn), 2022-2031
Figure 52: Middle East & Africa Smart Fleet Management Market Volume (Thousand Units) Forecast, by Connectivity, 2017-2031
Figure 53: Middle East & Africa Smart Fleet Management Market Value (US$ Bn) Forecast, by Connectivity, 2017-2031
Figure 54: Middle East & Africa Smart Fleet Management Market, Incremental Opportunity, by Connectivity, Value (US$ Bn), 2022-2031
Figure 55: Middle East & Africa Smart Fleet Management Market Volume (Thousand Units) Forecast, by Transportation, 2017-2031
Figure 56: Middle East & Africa Smart Fleet Management Market Value (US$ Bn) Forecast, by Transportation, 2017-2031
Figure 57: Middle East & Africa Smart Fleet Management Market, Incremental Opportunity, by Transportation, Value (US$ Bn), 2022-2031
Figure 58: Middle East & Africa Smart Fleet Management Market Volume (Thousand Units) Forecast, by Country, 2017-2031
Figure 59: Middle East & Africa Smart Fleet Management Market Value (US$ Bn) Forecast, by Country, 2017-2031
Figure 60: Middle East & Africa Smart Fleet Management Market, Incremental Opportunity, by Country, Value (US$ Bn), 2022-2031
Figure 61: South America Smart Fleet Management Market Volume (Thousand Units) Forecast, by Solution, 2017-2031
Figure 62: South America Smart Fleet Management Market Value (US$ Bn) Forecast, by Solution, 2017-2031
Figure 63: South America Smart Fleet Management Market, Incremental Opportunity, by Solution, Value (US$ Bn), 2022-2031
Figure 64: South America Smart Fleet Management Market Volume (Thousand Units) Forecast, by Connectivity, 2017-2031
Figure 65: South America Smart Fleet Management Market Value (US$ Bn) Forecast, by Connectivity, 2017-2031
Figure 66: South America Smart Fleet Management Market, Incremental Opportunity, by Connectivity, Value (US$ Bn), 2022-2031
Figure 67: South America Smart Fleet Management Market Volume (Thousand Units) Forecast, by Transportation, 2017-2031
Figure 68: South America Smart Fleet Management Market Value (US$ Bn) Forecast, by Transportation, 2017-2031
Figure 69: South America Smart Fleet Management Market, Incremental Opportunity, by Transportation, Value (US$ Bn), 2022-2031
Figure 70: South America Smart Fleet Management Market Volume (Thousand Units) Forecast, by Country, 2017-2031
Figure 71: South America Smart Fleet Management Market Value (US$ Bn) Forecast, by Country, 2017-2031
Figure 72: South America Smart Fleet Management Market, Incremental Opportunity, by Country, Value (US$ Bn), 2022-2031
Copyright © Transparency Market Research, Inc. All Rights reserved
Trust Online

Smart Fleet Management Market