
Reports
Reports
Analysts’ Viewpoint on Smart Carbon Market Scenario
Various countries across the globe are taking initiatives to reuse CO2 for different applications in order to cut down on CO2 emissions. Rise in focus on synthetic fuel by governments is one of the key factors likely to drive the growth of the global smart carbon market during the forecast period. Leading players in the market are investing in research and development (R&D) activities to introduce innovative products, such as bespoke carbon black solutions, with smart pricing strategies to strengthen their market competitiveness. Companies in the smart carbon market are focusing on applications such as urea manufacturing and synthetic fuel and chemical production in order to generate more revenue benefits. Market players should concentrate on forming partnerships to develop large-scale carbon capture and sequestration facilities.
Smart carbon is a carbon-neutral method that makes use of renewable energy, including carbon capture and storage (CCS), clean electricity, and circular carbon, in the high temperature-controlled industrial environment. Smart carbon can be considered an effective technology for reducing CO2 emissions. Carbon capture is broadly recognized as a range of processes for removing CO2 at the point source (e.g., industrial flue gas) or from the atmosphere through direct air capture. The captured CO2 can be either permanently stored or used to produce high-value products, such as fuels or specialty chemicals, in a process known as carbon utilization. Ongoing trends of the smart carbon market indicate that ML tools are being employed to assist in the development of carbon capture processes on several fronts. ML algorithms are used at the process level to model entire carbon capture plants, with the aim of identifying optimum operational conditions to obtain the minimum specific steam duty and maximum CO2-capture rate.
Smart sensor handheld carbon monoxide meter is a portable detector of carbon monoxide (CO) gas. It can continuously monitor the CO gas concentration in the surrounding environment. The alarm sounds or lights up once the gas concentration reaches a certain level.
Gasoline, diesel, petroleum products, and natural gas are the most important energy fuel sources available globally. Exploration and production of these fuels is harmful to the environment. However, natural gas is considered an alternative fuel for sustainable development, as it reduces carbon emissions, slows down global warming, and lowers GHG emissions. Countries with major natural gas reserves are looking at the advantages of using smart carbon, as it helps to further reduce carbon emissions.
Governments of various countries have introduced strict action plans to stabilize climate change and diminish overall carbon emissions in near and long term periods. They are monitoring and curbing greenhouse gas (GHG) emissions from power generation facilities. In February 2020, the International Energy Agency (IEA) published that the global energy-related CO2 emissions increased to 33.3 Giga Tons (Gt) in 2019 from 32.2 Gt in 2015, a rise of more than 3.4% in five years. The U.S. Government has established rules and regulations to minimize the risks associated with the usage of gasoline or diesel as a fuel and promote the usage of natural gas. China and the U.S., countries with major contribution to the global GHG emissions, collaborated and establish the U.S.-China Energy Cooperation Program in 2010.
The global climate agreement includes action plans on clean energy, energy efficiency, and climate change. According to the Energy Information Administration and Institute of Energy Economics Japan, global energy consumption will increase by 50% by 2035, leading to a rise in demand for smart carbon.
Oil & gas is emerging as an ideal industry for carbon capture and storage technologies due to the increase in number of enhanced oil recovery (EOR) projects across the globe. According to the International Energy Association’s (IEA’s) database, around 5,00,000 barrels of oil are produced daily using CO2-EOR. During EOR techniques, CO2 is injected into the existing oil field, which increases the overall pressure of the oil reservoir and forces the oil toward production wells. Rise in consumption of CO2 in oil enhanced oil recovery process is projected to spur the adoption of smart carbon in the oil & gas industry. Thus, growth in awareness among the people in developing and underdeveloped regions about the importance of carbon capture and storage technologies for tackling global warming and greenhouse gas emission is likely to fuel the global carbon capture and storage market in the near future. Rise in measures to cut the maximum carbon dioxide levels generated from fossil fuel production and utilization is also augmenting the carbon capture and storage market. For instance, in June 2020, the Alberta Carbon Trunk Line (ACTL) system CCUS project came online in Canada to seize harmful carbon dioxide from industrial facilities and utilize the gas for permanent storage and enhanced oil recovery.
In terms of technology, the global smart carbon market has been classified into Chemical Looping Combustion (CLC), solvents & sorbents, Bio-Energy CCS (BECCS), and Direct Air Capture (DAC). The Bio-Energy CCS (BECCS) segment dominated the market with the largest revenue share in 2021. Bioenergy with carbon capture and storage (BECCS) is the process of capturing and permanently storing carbon dioxide (CO2) from biomass (organic matter) energy generation. Benefits inherent within this technology are currently receiving increased attention from policymakers.
In terms of value, North America accounted for more than 32.5% share of the global smart carbon market in 2021 due to significant investments in research & development activities and presence of different high-capacity carbon capture and sequestration plants in the region. Additionally, funding initiatives from the regional governments are driving the market in the region. In June 2021, the U.S. Department of Energy (DoE) announced a US$ 12 Mn federal support to boost six R&D projects promoting direct air capture (DAC) technology to develop new tools for efficiently capturing CO2 from the atmosphere.
Various large-scale projects in early development and feasibility study stages across countries such as Australia and China are projected to augment the smart carbon market in Asia Pacific. Presence of high volume storage locations, primarily across subsea oil & gas reservoirs with EOR operations, coupled with favorable government initiatives is likely to boost the market in Asia Pacific in the near future. For instance, in August 2021, the governments of Australia and the U.K. declared their strategies to boost low emission technologies such as CCS, green hydrogen, CCUS, and small modular reactors.
Availability of old bulk oil & gas reservoirs and the vast untapped potential to augment hydrocarbon production from enhanced oil recovery methods are likely to provide an impetus to the smart carbon market in Middle East & Africa. Furthermore, announcement of new projects, low injection well drilling costs, and high storage capabilities in significant underground formations are other key factors propelling the market in the region.
The global smart carbon market is highly fragmented, with a small number of large-scale vendors controlling majority of the share. Most companies are investing significantly in comprehensive research and development activities, primarily to create environmentally-friendly products. Expansion of product portfolios and mergers and acquisitions are key strategies adopted by prominent players. Aker Solutions, Linde plc, Mitsubishi Heavy Industries Ltd., Royal Dutch Shell PLC, Siemens AG, Honeywell International, and Exxon Mobil Corporation are the key entities operating in the market.
Each of these players has been profiled in the smart carbon market report based on parameters such as company overview, financial overview, business strategies, product portfolio, business segments, and recent developments.
|
Attribute |
Detail |
|
Market Size Value in 2021 |
US$ 3.1 Bn |
|
Market Forecast Value in 2031 |
US$ 12.0 Bn |
|
Growth Rate (CAGR) |
16.2% |
|
Forecast Period |
2022–2031 |
|
Historical Data Available for |
2020 |
|
Quantitative Units |
US$ Bn for Value and Tons for Volume |
|
Market Analysis |
It includes cross-segment analysis at the global as well as regional level. Furthermore, the qualitative analysis includes drivers, restraints, opportunities, key trends, Porter’s Five Forces analysis, value chain analysis, and key trend analysis. |
|
Competition Landscape |
|
|
Format |
Electronic (PDF) + Excel |
|
Market Segmentation |
|
|
Regions Covered |
|
|
Countries Covered |
|
|
Companies Profiled |
|
|
Customization Scope |
Available upon request |
|
Pricing |
Available upon request |
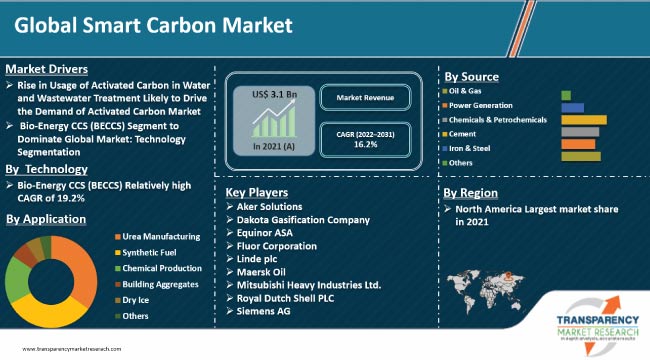
The global smart carbon market stood at US$ 3.1 Bn in 2021
The global smart carbon market is expected to advance at a CAGR of 16.2% from 2022 to 2031
Stringent policies & positive outlook to mitigate carbon footprint and rise in demand for CO2 enhanced oil recovery (EOR) projects
The Bio-Energy CCS (BECCS) technology segment accounted for major value share of 35.1% of the global smart carbon market in 2021
North America is a more attractive region for vendors in the global smart carbon market
Aker Solutions, Linde plc, Mitsubishi Heavy Industries Ltd., Royal Dutch Shell PLC, Siemens AG, Honeywell International, and Exxon Mobil Corporation
1. Executive Summary
1.1. Global Market Outlook
1.2. Demand Side Trends
1.3. Key Facts and Figures
1.4. Trends Impacting Market
1.5. TMR’s Growth Opportunity Wheel
2. Market Overview
2.1. Market Segmentation
2.2. Key Developments
2.3. Market Definitions
2.4. Key Market Trends
2.5. Market Dynamics
2.5.1. Drivers
2.5.2. Restraints
2.5.3. Opportunities
2.6. Global Smart Carbon Market Analysis and Forecast, 2022-2031
2.6.1. Global Smart Carbon Market Volume (Tons)
2.6.2. Global Smart Carbon Market Revenue (US$ Bn)
2.7. Porter’s Five Forces Analysis
2.8. Regulatory Landscape
2.9. Value Chain Analysis
2.9.1. List of Source Providers
2.9.2. List of Manufacturers
2.9.3. List of Dealers/Distributors
2.9.4. List of Potential Customers
2.10. Production Overview
2.11. Product Specification Analysis
2.12. Cost Structure Analysis
3. COVID-19 Impact Analysis
3.1. Impact on the Supply Chain of the Smart Carbon
3.2. Impact on the Demand of Smart Carbon– Pre & Post Crisis
4. Impact of Current Geopolitical Scenario on Market
5. Production Output Analysis (Tons), 2021
5.1. North America
5.2. Europe
5.3. Asia Pacific
5.4. Latin America
5.5. Middle East & Africa
6. Price Trend Analysis and Forecast (US$/Ton), 2022-2031
6.1. Price Comparison Analysis by Source
6.2. Price Comparison Analysis by Region
7. Global Smart Carbon Market Analysis and Forecast, by Source, 2022–2031
7.1. Introduction and Definitions
7.2. Global Smart Carbon Market Volume (Tons) and Value (US$ Bn) Forecast, by Source, 2022–2031
7.2.1. Oil & Gas
7.2.2. Power Generation
7.2.3. Chemicals & Petrochemicals
7.2.4. Cement
7.2.5. Iron & Steel
7.2.6. Others
7.3. Global Smart Carbon Market Attractiveness, by Source
8. Global Smart Carbon Market Analysis and Forecast, by Technology, 2022–2031
8.1. Introduction and Definitions
8.2. Global Smart Carbon Market Volume (Tons) and Value (US$ Bn) Forecast, by Technology, 2022–2031
8.2.1. Chemical Looping Combustion (CLC)
8.2.2. Solvents & Sorbents
8.2.3. Bio-Energy CCS (BECCS)
8.2.4. Direct Air Capture (DAC)
8.3. Global Smart Carbon Market Attractiveness, by Technology
9. Global Smart Carbon Market Analysis and Forecast, by Application, 2022–2031
9.1. Introduction and Definitions
9.2. Global Smart Carbon Market Volume (Tons) and Value (US$ Bn) Forecast, by Application, 2022–2031
9.2.1. Urea Manufacturing
9.2.2. Synthetic Fuel
9.2.3. Chemical Production
9.2.4. Building Aggregates
9.2.5. Dry Ice
9.2.6. Others
9.3. Global Smart Carbon Market Attractiveness, by Application
10. Global Smart Carbon Market Analysis and Forecast, by Region, 2022–2031
10.1. Key Findings
10.2. Global Smart Carbon Market Volume (Tons) and Value (US$ Bn) Forecast, by Region, 2022–2031
10.2.1. North America
10.2.2. Europe
10.2.3. Asia Pacific
10.2.4. Latin America
10.2.5. Middle East & Africa
10.3. Global Smart Carbon Market Attractiveness, by Region
11. North America Smart Carbon Market Analysis and Forecast, 2022–2031
11.1. Key Findings
11.2. North America Smart Carbon Market Volume (Tons) and Value (US$ Bn) Forecast, by Source, 2022–2031
11.3. North America Smart Carbon Market Volume (Tons) and Value (US$ Bn) Forecast, by Technology, 2022–2031
11.4. North America Smart Carbon Market Volume (Tons) and Value (US$ Bn) Forecast, by Application, 2022–2031
11.5. North America Smart Carbon Market Volume (Tons) and Value (US$ Bn) Forecast, by Country, 2022–2031
11.5.1. U.S. Smart Carbon Market Volume (Tons) and Value (US$ Bn) Forecast, by Source, 2022–2031
11.5.2. U.S. Smart Carbon Market Volume (Tons) and Value (US$ Bn) Forecast, by Technology, 2022–2031
11.5.3. U.S. Smart Carbon Market Volume (Tons) and Value (US$ Bn) Forecast, by Application, 2022–2031
11.5.4. Canada Smart Carbon Market Volume (Tons) and Value (US$ Bn) Forecast, by Source, 2022–2031
11.5.5. Canada Smart Carbon Market Volume (Tons) and Value (US$ Bn) Forecast, by Technology, 2022–2031
11.5.6. Canada Smart Carbon Market Volume (Tons) and Value (US$ Bn) Forecast, by Application, 2022–2031
11.6. North America Smart Carbon Market Attractiveness Analysis
12. Europe Smart Carbon Market Analysis and Forecast, 2022–2031
12.1. Key Findings
12.2. Europe Smart Carbon Market Volume (Tons) and Value (US$ Bn) Forecast, by Source, 2022–2031
12.3. Europe Smart Carbon Market Volume (Tons) and Value (US$ Bn) Forecast, by Technology, 2022–2031
12.4. Europe Smart Carbon Market Volume (Tons) and Value (US$ Bn) Forecast, by Application, 2022–2031
12.5. Europe Smart Carbon Market Volume (Tons) and Value (US$ Bn) Forecast, by Country and Sub-region, 2022-2031
12.5.1. Germany Smart Carbon Market Volume (Tons) and Value (US$ Bn) Forecast, by Source, 2022–2031
12.5.2. Germany Smart Carbon Market Volume (Tons) and Value (US$ Bn) Forecast, by Technology, 2022–2031
12.5.3. Germany Smart Carbon Market Volume (Tons) and Value (US$ Bn) Forecast, by Application, 2022–2031
12.5.4. France Smart Carbon Market Volume (Tons) and Value (US$ Bn) Forecast, by Source, 2022–2031
12.5.5. France Smart Carbon Market Volume (Tons) and Value (US$ Bn) Forecast, by Technology, 2022–2031
12.5.6. France Smart Carbon Market Volume (Tons) and Value (US$ Bn) Forecast, by Application, 2022–2031
12.5.7. U.K. Smart Carbon Market Volume (Tons) and Value (US$ Bn) Forecast, by Source, 2022–2031
12.5.8. U.K. Smart Carbon Market Volume (Tons) and Value (US$ Bn) Forecast, by Technology, 2022–2031
12.5.9. U.K. Smart Carbon Market Volume (Tons) and Value (US$ Bn) Forecast, by Application, 2022–2031
12.5.10. Italy Smart Carbon Market Volume (Tons) and Value (US$ Bn) Forecast, by Source, 2022–2031
12.5.11. Italy. Smart Carbon Market Volume (Tons) and Value (US$ Bn) Forecast, by Technology, 2022–2031
12.5.12. Italy Smart Carbon Market Volume (Tons) and Value (US$ Bn) Forecast, by Application, 2022–2031
12.5.13. Russia & CIS Smart Carbon Market Volume (Tons) and Value (US$ Bn) Forecast, by Source, 2022–2031
12.5.14. Russia & CIS Smart Carbon Market Volume (Tons) and Value (US$ Bn) Forecast, by Technology, 2022–2031
12.5.15. Russia & CIS Smart Carbon Market Volume (Tons) and Value (US$ Bn) Forecast, by Application, 2022–2031
12.5.16. Rest of Europe Smart Carbon Market Volume (Tons) and Value (US$ Bn) Forecast, by Source, 2022–2031
12.5.17. Rest of Europe Smart Carbon Market Volume (Tons) and Value (US$ Bn) Forecast, by Technology, 2022–2031
12.5.18. Rest of Europe Smart Carbon Market Volume (Tons) and Value (US$ Bn) Forecast, by Application, 2022–2031
12.6. Europe Smart Carbon Market Attractiveness Analysis
13. Asia Pacific Smart Carbon Market Analysis and Forecast, 2022–2031
13.1. Key Findings
13.2. Asia Pacific Smart Carbon Market Volume (Tons) and Value (US$ Bn) Forecast, by Source
13.3. Asia Pacific Smart Carbon Market Volume (Tons) and Value (US$ Bn) Forecast, by Technology, 2022–2031
13.4. Asia Pacific Smart Carbon Market Volume (Tons) and Value (US$ Bn) Forecast, by Application, 2022–2031
13.5. Asia Pacific Smart Carbon Market Volume (Tons) and Value (US$ Bn) Forecast, by Country and Sub-region, 2022-2031
13.5.1. China Smart Carbon Market Volume (Tons) and Value (US$ Bn) Forecast, by Source, 2022–2031
13.5.2. China Smart Carbon Market Volume (Tons) and Value (US$ Bn) Forecast, by Technology, 2022–2031
13.5.3. China Smart Carbon Market Volume (Tons) and Value (US$ Bn) Forecast, by Application, 2022–2031
13.5.4. Japan Smart Carbon Market Volume (Tons) and Value (US$ Bn) Forecast, by Source, 2022–2031
13.5.5. Japan Smart Carbon Market Volume (Tons) and Value (US$ Bn) Forecast, by Technology, 2022–2031
13.5.6. Japan Smart Carbon Market Volume (Tons) and Value (US$ Bn) Forecast, by Application, 2022–2031
13.5.7. India Smart Carbon Market Volume (Tons) and Value (US$ Bn) Forecast, by Source, 2022–2031
13.5.8. India Smart Carbon Market Volume (Tons) and Value (US$ Bn) Forecast, by Technology, 2022–2031
13.5.9. India Smart Carbon Market Volume (Tons) and Value (US$ Bn) Forecast, by Application, 2022–2031
13.5.10. ASEAN Smart Carbon Market Volume (Tons) and Value (US$ Bn) Forecast, by Source, 2022–2031
13.5.11. ASEAN Smart Carbon Market Volume (Tons) and Value (US$ Bn) Forecast, by Technology, 2022–2031
13.5.12. ASEAN Smart Carbon Market Volume (Tons) and Value (US$ Bn) Forecast, by Application, 2022–2031
13.5.13. Rest of Asia Pacific Smart Carbon Market Volume (Tons) and Value (US$ Bn) Forecast, by Source, 2022–2031
13.5.14. Rest of Asia Pacific Smart Carbon Market Volume (Tons) and Value (US$ Bn) Forecast, by Technology, 2022–2031
13.5.15. Rest of Asia Pacific Smart Carbon Market Volume (Tons) and Value (US$ Bn) Forecast, by Application, 2022–2031
13.6. Asia Pacific Smart Carbon Market Attractiveness Analysis
14. Latin America Smart Carbon Market Analysis and Forecast, 2022–2031
14.1. Key Findings
14.2. Latin America Smart Carbon Market Volume (Tons) and Value (US$ Bn) Forecast, by Source, 2022–2031
14.3. Latin America Smart Carbon Market Volume (Tons) and Value (US$ Bn) Forecast, by Technology, 2022–2031
14.4. Latin America Smart Carbon Market Volume (Tons) and Value (US$ Bn) Forecast, by Application, 2022–2031
14.5. Latin America Smart Carbon Market Volume (Tons) and Value (US$ Bn) Forecast, by Country and Sub-region, 2022-2031
14.5.1. Brazil Smart Carbon Market Volume (Tons) and Value (US$ Bn) Forecast, by Source, 2022–2031
14.5.2. Brazil Smart Carbon Market Volume (Tons) and Value (US$ Bn) Forecast, by Technology, 2022–2031
14.5.3. Brazil Smart Carbon Market Volume (Tons) and Value (US$ Bn) Forecast, by Application, 2022–2031
14.5.4. Mexico Smart Carbon Market Volume (Tons) and Value (US$ Bn) Forecast, by Source, 2022–2031
14.5.5. Mexico Smart Carbon Market Volume (Tons) and Value (US$ Bn) Forecast, by Technology, 2022–2031
14.5.6. Mexico Smart Carbon Market Volume (Tons) and Value (US$ Bn) Forecast, by Application, 2022–2031
14.5.7. Rest of Latin America Smart Carbon Market Volume (Tons) and Value (US$ Bn) Forecast, by Source, 2022–2031
14.5.8. Rest of Latin America Smart Carbon Market Volume (Tons) and Value (US$ Bn) Forecast, by Technology, 2022–2031
14.5.9. Rest of Latin America Smart Carbon Market Volume (Tons) and Value (US$ Bn) Forecast, by Application, 2022–2031
14.6. Latin America Smart Carbon Market Attractiveness Analysis
15. Middle East & Africa Smart Carbon Market Analysis and Forecast, 2022–2031
15.1. Key Findings
15.2. Middle East & Africa Smart Carbon Market Volume (Tons) and Value (US$ Bn) Forecast, by Source, 2022–2031
15.3. Middle East & Africa Smart Carbon Market Volume (Tons) and Value (US$ Bn) Forecast, by Technology, 2022–2031
15.4. Middle East & Africa Smart Carbon Market Volume (Tons) and Value (US$ Bn) Forecast, by Application, 2022–2031
15.5. Middle East & Africa Smart Carbon Market Volume (Tons) and Value (US$ Bn) Forecast, by Country and Sub-region, 2022-2031
15.5.1. GCC Smart Carbon Market Volume (Tons) and Value (US$ Bn) Forecast, by Source, 2022–2031
15.5.2. GCC Smart Carbon Market Volume (Tons) and Value (US$ Bn) Forecast, by Technology, 2022–2031
15.5.3. GCC Smart Carbon Market Volume (Tons) and Value (US$ Bn) Forecast, by Application, 2022–2031
15.5.4. South Africa Smart Carbon Market Volume (Tons) and Value (US$ Bn) Forecast, by Source, 2022–2031
15.5.5. South Africa Smart Carbon Market Volume (Tons) and Value (US$ Bn) Forecast, by Technology, 2022–2031
15.5.6. South Africa Smart Carbon Market Volume (Tons) and Value (US$ Bn) Forecast, by Application, 2022–2031
15.5.7. Rest of Middle East & Africa Smart Carbon Market Volume (Tons) and Value (US$ Bn) Forecast, by Source, 2022–2031
15.5.8. Rest of Middle East & Africa Smart Carbon Market Volume (Tons) and Value (US$ Bn) Forecast, by Technology, 2022–2031
15.5.9. Rest of Middle East & Africa Smart Carbon Market Volume (Tons) and Value (US$ Bn) Forecast, by Application, 2022–2031
15.6. Middle East & Africa Smart Carbon Market Attractiveness Analysis
16. Competition Landscape
16.1. Market Players - Competition Matrix (by Tier and Size of Companies)
16.2. Market Share Analysis, 2021
16.3. Market Footprint Analysis
16.3.1. By Source
16.3.2. By Technology
16.3.3. By Application
16.4. Company Profiles
16.4.1. Aker Solutions
16.4.1.1. Company Revenue
16.4.1.2. Business Overview
16.4.1.3. Source Segments
16.4.1.4. Geographic Footprint
16.4.1.5. Production Capacity/Plant Details, etc. (*As Applicable)
16.4.1.6. Strategic Partnership, Capacity Expansion, New Source Innovation etc.
16.4.2. Dakota Gasification Company
16.4.2.1. Company Revenue
16.4.2.2. Business Overview
16.4.2.3. Source Segments
16.4.2.4. Geographic Footprint
16.4.2.5. Production Capacity/Plant Details, etc. (*As Applicable)
16.4.2.6. Strategic Partnership, Capacity Expansion, New Source Innovation etc.
16.4.3. Equinor ASA
16.4.3.1. Company Revenue
16.4.3.2. Business Overview
16.4.3.3. Source Segments
16.4.3.4. Geographic Footprint
16.4.3.5. Production Capacity/Plant Details, etc. (*As Applicable)
16.4.3.6. Strategic Partnership, Capacity Expansion, New Source Innovation etc.
16.4.4. Fluor Corporation
16.4.4.1. Company Revenue
16.4.4.2. Business Overview
16.4.4.3. Source Segments
16.4.4.4. Geographic Footprint
16.4.4.5. Production Capacity/Plant Details, etc. (*As Applicable)
16.4.4.6. Strategic Partnership, Capacity Expansion, New Source Innovation etc.
16.4.5. Linde plc
16.4.5.1. Company Revenue
16.4.5.2. Business Overview
16.4.5.3. Source Segments
16.4.5.4. Geographic Footprint
16.4.5.5. Production Capacity/Plant Details, etc. (*As Applicable)
16.4.5.6. Strategic Partnership, Capacity Expansion, New Source Innovation etc.
16.4.6. Maersk Oil
16.4.6.1. Company Revenue
16.4.6.2. Business Overview
16.4.6.3. Source Segments
16.4.6.4. Geographic Footprint
16.4.6.5. Production Capacity/Plant Details, etc. (*As Applicable)
16.4.6.6. Strategic Partnership, Capacity Expansion, New Source Innovation etc.
16.4.7. Mitsubishi Heavy Industries Ltd.
16.4.7.1. Company Revenue
16.4.7.2. Business Overview
16.4.7.3. Source Segments
16.4.7.4. Geographic Footprint
16.4.7.5. Production Capacity/Plant Details, etc. (*As Applicable)
16.4.7.6. Strategic Partnership, Capacity Expansion, New Source Innovation etc.
16.4.8. Royal Dutch Shell PLC
16.4.8.1. Company Revenue
16.4.8.2. Business Overview
16.4.8.3. Source Segments
16.4.8.4. Geographic Footprint
16.4.8.5. Production Capacity/Plant Details, etc. (*As Applicable)
16.4.8.6. Strategic Partnership, Capacity Expansion, New Source Innovation etc.
16.4.9. Siemens AG
16.4.9.1. Company Revenue
16.4.9.2. Business Overview
16.4.9.3. Source Segments
16.4.9.4. Geographic Footprint
16.4.9.5. Production Capacity/Plant Details, etc. (*As Applicable)
16.4.9.6. Strategic Partnership, Capacity Expansion, New Source Innovation etc.
16.4.10. Sulzer Ltd.
16.4.10.1. Company Revenue
16.4.10.2. Business Overview
16.4.10.3. Source Segments
16.4.10.4. Geographic Footprint
16.4.10.5. Production Capacity/Plant Details, etc. (*As Applicable)
16.4.10.6. Strategic Partnership, Capacity Expansion, New Source Innovation etc.
16.4.11. Honeywell International
16.4.11.1. Company Revenue
16.4.11.2. Business Overview
16.4.11.3. Source Segments
16.4.11.4. Geographic Footprint
16.4.11.5. Production Capacity/Plant Details, etc. (*As Applicable)
16.4.11.6. Strategic Partnership, Capacity Expansion, New Source Innovation etc.
16.4.12. Exxon Mobil Corporation
16.4.12.1. Company Revenue
16.4.12.2. Business Overview
16.4.12.3. Source Segments
16.4.12.4. Geographic Footprint
16.4.12.5. Production Capacity/Plant Details, etc. (*As Applicable)
16.4.12.6. Strategic Partnership, Capacity Expansion, New Source Innovation etc.
17. Primary Research: Key Insights
18. Appendix
List of Tables
Table 1: Global Smart Carbon Market Volume (Tons) Forecast, by Source, 2022–2031
Table 2: Global Smart Carbon Market Value (US$ Bn) Forecast, by Source, 2022–2031
Table 3: Global Smart Carbon Market Volume (Tons) Forecast, by Technology, 2022–2031
Table 4: Global Smart Carbon Market Value (US$ Bn) Forecast, by Technology, 2022–2031
Table 5: Global Smart Carbon Market Volume (Tons) Forecast, by Application, 2022–2031
Table 6: Global Smart Carbon Market Value (US$ Bn) Forecast, by Application, 2022–2031
Table 7: Global Smart Carbon Market Volume (Tons) Forecast, by Region, 2022–2031
Table 8: Global Smart Carbon Market Value (US$ Bn) Forecast, by Region, 2022–2031
Table 9: North America Smart Carbon Market Volume (Tons) Forecast, by Source, 2022–2031
Table 10: North America Smart Carbon Market Value (US$ Bn) Forecast, by Source, 2022–2031
Table 11: North America Smart Carbon Market Volume (Tons) Forecast, by Technology, 2022–2031
Table 12: North America Smart Carbon Market Value (US$ Bn) Forecast, by Technology, 2022–2031
Table 13: North America Smart Carbon Market Volume (Tons) Forecast, by Application, 2022–2031
Table 14: North America Smart Carbon Market Value (US$ Bn) Forecast, by Application, 2022–2031
Table 15: North America Smart Carbon Market Volume (Tons) Forecast, by Country, 2022–2031
Table 16: North America Smart Carbon Market Value (US$ Bn) Forecast, by Country, 2022–2031
Table 17: U.S. Smart Carbon Market Volume (Tons) Forecast, by Source, 2022–2031
Table 18: U.S. Smart Carbon Market Value (US$ Bn) Forecast, by Source, 2022–2031
Table 19: U.S. Smart Carbon Market Volume (Tons) Forecast, by Technology, 2022–2031
Table 20: U.S. Smart Carbon Market Value (US$ Bn) Forecast, by Technology, 2022–2031
Table 21: U.S. Smart Carbon Market Volume (Tons) Forecast, by Application, 2022–2031
Table 22: U.S. Smart Carbon Market Value (US$ Bn) Forecast, by Application, 2022–2031
Table 23: Canada Smart Carbon Market Volume (Tons) Forecast, by Source, 2022–2031
Table 24: Canada Smart Carbon Market Value (US$ Bn) Forecast, by Source, 2022–2031
Table 25: Canada Smart Carbon Market Volume (Tons) Forecast, by Technology, 2022–2031
Table 26: Canada Smart Carbon Market Value (US$ Bn) Forecast, by Technology, 2022–2031
Table 27: Canada Smart Carbon Market Volume (Tons) Forecast, by Application, 2022–2031
Table 28: Canada Smart Carbon Market Value (US$ Bn) Forecast, by Application, 2022–2031
Table 29: Europe Smart Carbon Market Volume (Tons) Forecast, by Source, 2022–2031
Table 30: Europe Smart Carbon Market Value (US$ Bn) Forecast, by Source, 2022–2031
Table 31: Europe Smart Carbon Market Volume (Tons) Forecast, by Technology, 2022–2031
Table 32: Europe Smart Carbon Market Value (US$ Bn) Forecast, by Technology, 2022–2031
Table 33: Europe Smart Carbon Market Volume (Tons) Forecast, by Application, 2022–2031
Table 34: Europe Smart Carbon Market Value (US$ Bn) Forecast, by Application, 2022–2031
Table 35: Europe Smart Carbon Market Volume (Tons) Forecast, by Country and Sub-region, 2022–2031
Table 36: Europe Smart Carbon Market Value (US$ Bn) Forecast, by Country and Sub-region, 2022–2031
Table 37: Germany Smart Carbon Market Volume (Tons) Forecast, by Source, 2022–2031
Table 38: Germany Smart Carbon Market Value (US$ Bn) Forecast, by Source, 2022–2031
Table 39: Germany Smart Carbon Market Volume (Tons) Forecast, by Technology, 2022–2031
Table 40: Germany Smart Carbon Market Value (US$ Bn) Forecast, by Technology, 2022–2031
Table 41: Germany Smart Carbon Market Volume (Tons) Forecast, by Application, 2022–2031
Table 42: Germany Smart Carbon Market Value (US$ Bn) Forecast, by Application, 2022–2031
Table 43: France Smart Carbon Market Volume (Tons) Forecast, by Source, 2022–2031
Table 44: France Smart Carbon Market Value (US$ Bn) Forecast, by Source, 2022–2031
Table 45: France Smart Carbon Market Volume (Tons) Forecast, by Technology, 2022–2031
Table 46: France Smart Carbon Market Value (US$ Bn) Forecast, by Technology, 2022–2031
Table 47: France Smart Carbon Market Volume (Tons) Forecast, by Application, 2022–2031
Table 48: France Smart Carbon Market Value (US$ Bn) Forecast, by Application, 2022–2031
Table 49: U.K. Smart Carbon Market Volume (Tons) Forecast, by Source, 2022–2031
Table 50: U.K. Smart Carbon Market Value (US$ Bn) Forecast, by Source, 2022–2031
Table 51: U.K. Smart Carbon Market Volume (Tons) Forecast, by Technology, 2022–2031
Table 52: U.K. Smart Carbon Market Value (US$ Bn) Forecast, by Technology, 2022–2031
Table 53: U.K. Smart Carbon Market Volume (Tons) Forecast, by Application, 2022–2031
Table 54: U.K. Smart Carbon Market Value (US$ Bn) Forecast, by Application, 2022–2031
Table 55: Italy Smart Carbon Market Volume (Tons) Forecast, by Source, 2022–2031
Table 56: Italy Smart Carbon Market Value (US$ Bn) Forecast, by Source, 2022–2031
Table 57: Italy Smart Carbon Market Volume (Tons) Forecast, by Technology, 2022–2031
Table 58: Italy Smart Carbon Market Value (US$ Bn) Forecast, by Technology, 2022–2031
Table 59: Italy Smart Carbon Market Volume (Tons) Forecast, by Application, 2022–2031
Table 60: Italy Smart Carbon Market Value (US$ Bn) Forecast, by Application, 2022–2031
Table 61: Spain Smart Carbon Market Volume (Tons) Forecast, by Source, 2022–2031
Table 62: Spain Smart Carbon Market Value (US$ Bn) Forecast, by Source, 2022–2031
Table 63: Spain Smart Carbon Market Volume (Tons) Forecast, by Technology, 2022–2031
Table 64: Spain Smart Carbon Market Value (US$ Bn) Forecast, by Technology, 2022–2031
Table 65: Spain Smart Carbon Market Volume (Tons) Forecast, by Application, 2022–2031
Table 66: Spain Smart Carbon Market Value (US$ Bn) Forecast, by Application, 2022–2031
Table 67: Russia & CIS Smart Carbon Market Volume (Tons) Forecast, by Source, 2022–2031
Table 68: Russia & CIS Smart Carbon Market Value (US$ Bn) Forecast, by Source, 2022–2031
Table 69: Russia & CIS Smart Carbon Market Volume (Tons) Forecast, by Technology, 2022–2031
Table 70: Russia & CIS Smart Carbon Market Value (US$ Bn) Forecast, by Technology, 2022–2031
Table 71: Russia & CIS Smart Carbon Market Volume (Tons) Forecast, by Application, 2022–2031
Table 72: Russia & CIS Smart Carbon Market Value (US$ Bn) Forecast, by Application, 2022–2031
Table 73: Rest of Europe Smart Carbon Market Volume (Tons) Forecast, by Source, 2022–2031
Table 74: Rest of Europe Smart Carbon Market Value (US$ Bn) Forecast, by Source, 2022–2031
Table 75: Rest of Europe Smart Carbon Market Volume (Tons) Forecast, by Technology, 2022–2031
Table 76: Rest of Europe Smart Carbon Market Value (US$ Bn) Forecast, by Technology, 2022–2031
Table 77: Rest of Europe Smart Carbon Market Volume (Tons) Forecast, by Application, 2022–2031
Table 78: Rest of Europe Smart Carbon Market Value (US$ Bn) Forecast, by Application, 2022–2031
Table 79: Asia Pacific Smart Carbon Market Volume (Tons) Forecast, by Source, 2022–2031
Table 80: Asia Pacific Smart Carbon Market Value (US$ Bn) Forecast, by Source, 2022–2031
Table 81: Asia Pacific Smart Carbon Market Volume (Tons) Forecast, by Technology, 2022–2031
Table 82: Asia Pacific Smart Carbon Market Value (US$ Bn) Forecast, by Technology, 2022–2031
Table 83: Asia Pacific Smart Carbon Market Volume (Tons) Forecast, by Application, 2022–2031
Table 84: Asia Pacific Smart Carbon Market Value (US$ Bn) Forecast, by Application, 2022–2031
Table 85: Asia Pacific Smart Carbon Market Volume (Tons) Forecast, by Country and Sub-region, 2022–2031
Table 86: Asia Pacific Smart Carbon Market Value (US$ Bn) Forecast, by Country and Sub-region, 2022–2031
Table 87: China Smart Carbon Market Volume (Tons) Forecast, by Source, 2022–2031
Table 88: China Smart Carbon Market Value (US$ Bn) Forecast, by Source 2022–2031
Table 89: China Smart Carbon Market Volume (Tons) Forecast, by Technology, 2022–2031
Table 90: China Smart Carbon Market Value (US$ Bn) Forecast, by Technology, 2022–2031
Table 91: China Smart Carbon Market Volume (Tons) Forecast, by Application, 2022–2031
Table 92: China Smart Carbon Market Value (US$ Bn) Forecast, by Application, 2022–2031
Table 93: Japan Smart Carbon Market Volume (Tons) Forecast, by Source, 2022–2031
Table 94: Japan Smart Carbon Market Value (US$ Bn) Forecast, by Source, 2022–2031
Table 95: Japan Smart Carbon Market Volume (Tons) Forecast, by Technology, 2022–2031
Table 96: Japan Smart Carbon Market Value (US$ Bn) Forecast, by Technology, 2022–2031
Table 97: Japan Smart Carbon Market Volume (Tons) Forecast, by Application, 2022–2031
Table 98: Japan Smart Carbon Market Value (US$ Bn) Forecast, by Application, 2022–2031
Table 99: India Smart Carbon Market Volume (Tons) Forecast, by Source, 2022–2031
Table 100: India Smart Carbon Market Value (US$ Bn) Forecast, by Source, 2022–2031
Table 101: India Smart Carbon Market Volume (Tons) Forecast, by Technology, 2022–2031
Table 102: India Smart Carbon Market Value (US$ Bn) Forecast, by Technology, 2022–2031
Table 103: India Smart Carbon Market Volume (Tons) Forecast, by Application, 2022–2031
Table 104: India Smart Carbon Market Value (US$ Bn) Forecast, by Application, 2022–2031
Table 105: India Smart Carbon Market Volume (Tons) Forecast, by Application, 2022–2031
Table 106: India Smart Carbon Market Value (US$ Bn) Forecast, by Application 2022–2031
Table 107: ASEAN Smart Carbon Market Volume (Tons) Forecast, by Source, 2022–2031
Table 108: ASEAN Smart Carbon Market Value (US$ Bn) Forecast, by Source, 2022–2031
Table 109: ASEAN Smart Carbon Market Volume (Tons) Forecast, by Technology, 2022–2031
Table 110: ASEAN Smart Carbon Market Value (US$ Bn) Forecast, by Technology, 2022–2031
Table 111: ASEAN Smart Carbon Market Volume (Tons) Forecast, by Application, 2022–2031
Table 112: ASEAN Smart Carbon Market Value (US$ Bn) Forecast, by Application, 2022–2031
Table 113: Rest of Asia Pacific Smart Carbon Market Volume (Tons) Forecast, by Source, 2022–2031
Table 114: Rest of Asia Pacific Smart Carbon Market Value (US$ Bn) Forecast, by Source, 2022–2031
Table 115: Rest of Asia Pacific Smart Carbon Market Volume (Tons) Forecast, by Technology, 2022–2031
Table 116: Rest of Asia Pacific Smart Carbon Market Value (US$ Bn) Forecast, by Technology, 2022–2031
Table 117: Rest of Asia Pacific Smart Carbon Market Volume (Tons) Forecast, by Application, 2022–2031
Table 118: Rest of Asia Pacific Smart Carbon Market Value (US$ Bn) Forecast, by Application, 2022–2031
Table 119: Latin America Smart Carbon Market Volume (Tons) Forecast, by Source, 2022–2031
Table 120: Latin America Smart Carbon Market Value (US$ Bn) Forecast, by Source, 2022–2031
Table 121: Latin America Smart Carbon Market Volume (Tons) Forecast, by Technology, 2022–2031
Table 122: Latin America Smart Carbon Market Value (US$ Bn) Forecast, by Technology, 2022–2031
Table 123: Latin America Smart Carbon Market Volume (Tons) Forecast, by Application, 2022–2031
Table 124: Latin America Smart Carbon Market Value (US$ Bn) Forecast, by Application, 2022–2031
Table 125: Latin America Smart Carbon Market Volume (Tons) Forecast, by Country and Sub-region, 2022–2031
Table 126: Latin America Smart Carbon Market Value (US$ Bn) Forecast, by Country and Sub-region, 2022–2031
Table 127: Brazil Smart Carbon Market Volume (Tons) Forecast, by Source, 2022–2031
Table 128: Brazil Smart Carbon Market Value (US$ Bn) Forecast, by Source, 2022–2031
Table 129: Brazil Smart Carbon Market Volume (Tons) Forecast, by Technology, 2022–2031
Table 130: Brazil Smart Carbon Market Value (US$ Bn) Forecast, by Technology, 2022–2031
Table 131: Brazil Smart Carbon Market Volume (Tons) Forecast, by Application, 2022–2031
Table 132: Brazil Smart Carbon Market Value (US$ Bn) Forecast, by Application, 2022–2031
Table 133: Mexico Smart Carbon Market Volume (Tons) Forecast, by Source, 2022–2031
Table 134: Mexico Smart Carbon Market Value (US$ Bn) Forecast, by Source, 2022–2031
Table 135: Mexico Smart Carbon Market Volume (Tons) Forecast, by Technology, 2022–2031
Table 136: Mexico Smart Carbon Market Value (US$ Bn) Forecast, by Technology, 2022–2031
Table 137: Mexico Smart Carbon Market Volume (Tons) Forecast, by Application, 2022–2031
Table 138: Mexico Smart Carbon Market Value (US$ Bn) Forecast, by Application, 2022–2031
Table 139: Rest of Latin America Smart Carbon Market Volume (Tons) Forecast, by Source, 2022–2031
Table 140: Rest of Latin America Smart Carbon Market Value (US$ Bn) Forecast, by Source, 2022–2031
Table 141: Rest of Latin America Smart Carbon Market Volume (Tons) Forecast, by Technology, 2022–2031
Table 142: Rest of Latin America Smart Carbon Market Value (US$ Bn) Forecast, by Technology, 2022–2031
Table 143: Rest of Latin America Smart Carbon Market Volume (Tons) Forecast, by Application, 2022–2031
Table 144: Rest of Latin America Smart Carbon Market Value (US$ Bn) Forecast, by Application, 2022–2031
Table 145: Middle East & Africa Smart Carbon Market Volume (Tons) Forecast, by Source, 2022–2031
Table 146: Middle East & Africa Smart Carbon Market Value (US$ Bn) Forecast, by Source, 2022–2031
Table 147: Middle East & Africa Smart Carbon Market Volume (Tons) Forecast, by Technology, 2022–2031
Table 148: Middle East & Africa Smart Carbon Market Value (US$ Bn) Forecast, by Technology, 2022–2031
Table 149: Middle East & Africa Smart Carbon Market Volume (Tons) Forecast, by Application, 2022–2031
Table 150: Middle East & Africa Smart Carbon Market Value (US$ Bn) Forecast, by Application, 2022–2031
Table 151: Middle East & Africa Smart Carbon Market Volume (Tons) Forecast, by Country and Sub-region, 2022–2031
Table 152: Middle East & Africa Smart Carbon Market Value (US$ Bn) Forecast, by Country and Sub-region, 2022–2031
Table 153: GCC Smart Carbon Market Volume (Tons) Forecast, by Source, 2022–2031
Table 154: GCC Smart Carbon Market Value (US$ Bn) Forecast, by Source, 2022–2031
Table 155: GCC Smart Carbon Market Volume (Tons) Forecast, by Technology, 2022–2031
Table 156: GCC Smart Carbon Market Value (US$ Bn) Forecast, by Technology, 2022–2031
Table 157: GCC Smart Carbon Market Volume (Tons) Forecast, by Application, 2022–2031
Table 158: GCC Smart Carbon Market Value (US$ Bn) Forecast, by Application, 2022–2031
Table 159: South Africa Smart Carbon Market Volume (Tons) Forecast, by Source, 2022–2031
Table 160: South Africa Smart Carbon Market Value (US$ Bn) Forecast, by Source, 2022–2031
Table 161: South Africa Smart Carbon Market Volume (Tons) Forecast, by Technology, 2022–2031
Table 162: South Africa Smart Carbon Market Value (US$ Bn) Forecast, by Technology, 2022–2031
Table 163: South Africa Smart Carbon Market Volume (Tons) Forecast, by Application, 2022–2031
Table 164: South Africa Smart Carbon Market Value (US$ Bn) Forecast, by Application, 2022–2031
Table 165: Rest of Middle East & Africa Smart Carbon Market Volume (Tons) Forecast, by Source, 2022–2031
Table 166: Rest of Middle East & Africa Smart Carbon Market Value (US$ Bn) Forecast, by Source, 2022–2031
Table 167: Rest of Middle East & Africa Smart Carbon Market Volume (Tons) Forecast, by Technology, 2022–2031
Table 168: Rest of Middle East & Africa Smart Carbon Market Value (US$ Bn) Forecast, by Technology, 2022–2031
Table 169: Rest of Middle East & Africa Smart Carbon Market Volume (Tons) Forecast, by Application, 2022–2031
Table 170: Rest of Middle East & Africa Smart Carbon Market Value (US$ Bn) Forecast, by Application, 2022–2031
List of Figures
Figure 1: Global Smart Carbon Market Volume Share Analysis, by Source, 2021, 2025, and 2031
Figure 2: Global Smart Carbon Market Attractiveness, by Source
Figure 3: Global Smart Carbon Market Volume Share Analysis, by Technology, 2021, 2025, and 2031
Figure 4: Global Smart Carbon Market Attractiveness, by Technology
Figure 5: Global Smart Carbon Market Volume Share Analysis, by Application, 2021, 2025, and 2031
Figure 6: Global Smart Carbon Market Attractiveness, by Application
Figure 7: Global Smart Carbon Market Volume Share Analysis, by Region, 2021, 2025, and 2031
Figure 8: Global Smart Carbon Market Attractiveness, by Region
Figure 9: North America Smart Carbon Market Volume Share Analysis, by Source, 2021, 2025, and 2031
Figure 10: North America Smart Carbon Market Attractiveness, by Source
Figure 11: North America Smart Carbon Market Attractiveness, by Source
Figure 12: North America Smart Carbon Market Volume Share Analysis, by Technology, 2021, 2025, and 2031
Figure 13: North America Smart Carbon Market Attractiveness, by Technology
Figure 14: North America Smart Carbon Market Volume Share Analysis, by Application, 2021, 2025, and 2031
Figure 15: North America Smart Carbon Market Attractiveness, by Application
Figure 16: North America Smart Carbon Market Attractiveness, by Country and Sub-region
Figure 17: Europe Smart Carbon Market Volume Share Analysis, by Source, 2021, 2025, and 2031
Figure 18: Europe Smart Carbon Market Attractiveness, by Source
Figure 19: Europe Smart Carbon Market Volume Share Analysis, by Technology, 2021, 2025, and 2031
Figure 20: Europe Smart Carbon Market Attractiveness, by Technology
Figure 21: Europe Smart Carbon Market Volume Share Analysis, by Application, 2021, 2025, and 2031
Figure 22: Europe Smart Carbon Market Attractiveness, by Application
Figure 23: Europe Smart Carbon Market Volume Share Analysis, by Country and Sub-region, 2021, 2025, and 2031
Figure 24: Europe Smart Carbon Market Attractiveness, by Country and Sub-region
Figure 25: Asia Pacific Smart Carbon Market Volume Share Analysis, by Source, 2021, 2025, and 2031
Figure 26: Asia Pacific Smart Carbon Market Attractiveness, by Source
Figure 27: Asia Pacific Smart Carbon Market Volume Share Analysis, by Technology, 2021, 2025, and 2031
Figure 28: Asia Pacific Smart Carbon Market Attractiveness, by Technology
Figure 29: Asia Pacific Smart Carbon Market Volume Share Analysis, by Application, 2021, 2025, and 2031
Figure 30: Asia Pacific Smart Carbon Market Attractiveness, by Application
Figure 31: Asia Pacific Smart Carbon Market Volume Share Analysis, by Country and Sub-region, 2021, 2025, and 2031
Figure 32: Asia Pacific Smart Carbon Market Attractiveness, by Country and Sub-region
Figure 33: Latin America Smart Carbon Market Volume Share Analysis, by Source, 2021, 2025, and 2031
Figure 34: Latin America Smart Carbon Market Attractiveness, by Source
Figure 35: Latin America Smart Carbon Market Volume Share Analysis, by Technology, 2021, 2025, and 2031
Figure 36: Latin America Smart Carbon Market Attractiveness, by Technology
Figure 37: Latin America Smart Carbon Market Volume Share Analysis, by Application, 2021, 2025, and 2031
Figure 38: Latin America Smart Carbon Market Attractiveness, by Application
Figure 39: Latin America Smart Carbon Market Volume Share Analysis, by Country and Sub-region, 2021, 2025, and 2031
Figure 40: Latin America Smart Carbon Market Attractiveness, by Country and Sub-region
Figure 41: Middle East & Africa Smart Carbon Market Volume Share Analysis, by Source, 2021, 2025, and 2031
Figure 42: Middle East & Africa Smart Carbon Market Attractiveness, by Source
Figure 43: Middle East & Africa Smart Carbon Market Volume Share Analysis, by Technology, 2021, 2025, and 2031
Figure 44: Middle East & Africa Smart Carbon Market Attractiveness, by Technology
Figure 45: Middle East & Africa Smart Carbon Market Volume Share Analysis, by Application, 2021, 2025, and 2031
Figure 46: Middle East & Africa Smart Carbon Market Attractiveness, by Application
Figure 47: Middle East & Africa Smart Carbon Market Volume Share Analysis, by Country and Sub-region, 2021, 2025, and 2031
Figure 48: Middle East & Africa Smart Carbon Market Attractiveness, by Country and Sub-region
Copyright © Transparency Market Research, Inc. All Rights reserved
Trust Online

Smart Carbon Market