
Reports
Reports
Remote working in healthcare settings and work from home initiatives have bolstered the growth of the smart antenna market during the coronavirus crisis. The growing adoption of 4G and 5G technologies is driving the global market. This is evident since cellular networks and Wi-Fi systems are witnessing increased traffic in home environments and residential spaces.
Due to the ongoing COVID-19 outbreak, defense forces in various countries are under pressure to safeguard borders since the socio-economic condition of several countries is vulnerable. Companies in the smart antenna market are capitalizing on this opportunity to increase the availability of products with defense forces since they play an essential role in safeguarding the nation.
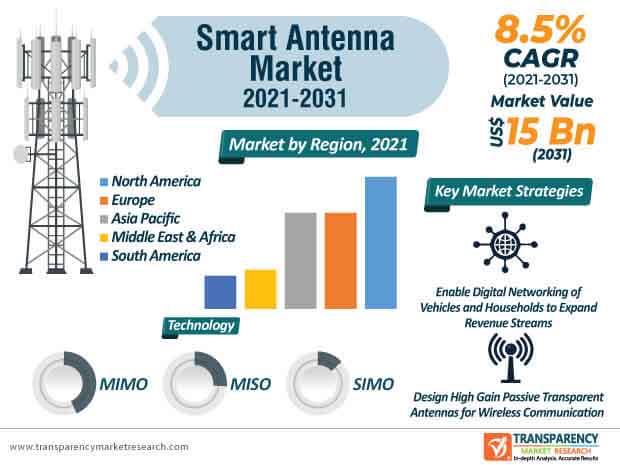
The Luxembourg Institute of Science and Technology (LIST) is inviting an internship in processing of smart antenna for autonomous IoT (Internet of Things) sensor units. This signals robust growth of the smart antenna market, which is estimated to expand at a favorable CAGR of 8.5% during the assessment period. However, transparent antennas are subject to low gain, owing to the use of resistive materials and thinner conductive materials. Such challenges are being countered by means of employing antennas in array structure or by optimizing the thin film deposition process to improve its conductivity.
Stakeholders are seeking to alleviate urban challenges in smart city initiatives to broaden their revenue streams.
Analysts at the Transparency Market Research (TMR) opine that the entire world will be connected to the Internet through satellites. Merck Group - a leading science and technology company is anticipating a digital future with smart antennas used in cars, airplanes, and households with easy access to the online world from any location.
Digital networking of vehicles, factories, and households will be translating into incremental opportunities for stakeholders in the global smart antenna market. The proliferation of self-driving cars such as Tesla, intelligent algorithms, and powerful computers are keeping companies in the smart antenna market busy with research and development. Thus, connectivity among different entities has become a crucial requirement for establishing digital transformation. Stakeholders are increasing efforts to enable powerful and reliable network connections for sending and receiving large quantities of data.
The smart antenna market is projected to reach US$ 15 Bn by 2031. Movandi - a fast growing 5G mmWave RF (radio frequency) solutions company is increasing the availability of 5G antenna solutions with the beam forming technology to improve the performance of multi-gigabit networks. Companies in the smart antenna market are providing 5G millimeter wave solutions for small cell and base station applications.
5G millimeter wave solutions are facilitating content delivery across mobile platforms, augmented reality services, and mission-critical vehicle-to-vehicle (V2V) applications.
The new range of smart antennas is capable of automatically switching its main beam to track a moving target. Companies in the smart antenna market are bolstering their production capabilities to develop solutions integrated with sensing element and signal processing element, which are suitable for mobile communication in railways and long straight spaces.
The development of mobile tech and the advent of mobile communication have led to the construction of flexible and variable short-range wireless communication channels. However, environmental adaptability has become a task for companies in the smart antenna market for designing of mobile communication systems in which antennas play a key role. Hence, companies are increasing the availability of moderate cost antennas combined with artificial intelligence (AI) instead of low-cost antennas to achieve environmentally cognitive intelligence.
Wi-Fi systems are expected to grow at an exponential rate in terms of revenue and CAGR during the forecast period. This explains why companies are increasingly focusing on smart antennas for 5G and 6G wireless systems. As such, there is a need for scientific approach to advance in the wireless technology. Continuous R&D using a scientific approach is helping to make antennas more powerful, maneuverable, and crucial for the advanced wireless technology. Companies are making use of electromagnetic signal processing techniques to control the antenna beam and track the moving station required for fast, dynamic, and effective beam forming.
The future of smart antenna market lies in electromagnetic computing. Companies are developing sophisticated antenna systems in the U.S. and Europe, which are suitable for electrically large aircraft, automobiles, and IoT systems. Thus, lucrative growth opportunities in countries of Asia Pacific such as India, Australia, and Japan are grabbing the attention of innovators. Companies are expected to team with researchers and interns to run projects that are realizing the importance of nanotechnology-based sensors and generators with IoT capabilities that complement low power wireless communication modules.
Liquid crystal smart antennas are a breakthrough innovation for mmWave 5G applications. The liquid crystal technology is being used to develop phased array smart antennas that address the challenges faced by commercial mmWave 5G end-use cases. Challenges such as signal penetration, limited range of mmWave, and high infrastructure investment are hampering the growth of the smart antenna market. Hence, companies are increasing their focus on advanced technologies including beam-steering for effective coverage with the help of mmWave 5G.
Signal penetration is potentially challenging with mmWave 5G, since mmWave is easily blocked by buildings and poor weather. The limited range of mmWave is another roadblock for market expansion, since these frequencies only have a range of around 300 meters, which is significantly less than 4G. This has led to the demand for more equipment to deliver consistent and reliable coverage using liquid crystal smart antennas.
Analysts’ Viewpoint
Even though mmWave 5G faces issues in long-distance communications, users needing high speed communication over short distances are opting for liquid crystal smart antennas amid the ongoing COVID-19 pandemic. Companies are expected to collaborate with researchers and interns to gain proficiency in the designing and fabrication of high gain passive transparent antennas for wireless communication, which complement autonomous sensor units. The software-defined antenna solution providers are gaining recognition for using the holographic beam forming technology to enable continuous reuse of the same band of spectrum. As such, smart antennas have become increasingly important for small and low Earth orbit satellites in order to expand the global Internet coverage.
Smart Antenna Market is projected to reach US$ 15 Bn by 2031
Smart Antenna Market is expected to grow at a CAGR of 8.5% during 2021-2031
Smart Antenna Market is studied from 2021-2031
Key vendors in the Smart Antenna Market are Alcatel-Lucent International Holdings Inc. (Nokia), ArrayComm, Broadcom Corporation, California Amplifier Inc., Cobham Antenna Systems, Intel Corporation, Motorola Solutions Inc., Samsung Electronics Co., Ltd., and Sierra Wireless, Inc.
North America region Takes Lead in the Smart Antenna Market
1. Global Smart Antenna Market - Executive Summary
1.1. Global Smart Antenna Market Country Analysis
1.2. Competition Blueprint
1.3. Technology Time Line Mapping
1.4. TMR Analysis and Recommendations
2. Market Overview
2.1. Market Introduction
2.2. Market Definition
2.3. Market Taxonomy
3. Market Dynamics
3.1. Macroeconomic Factors
3.2. Drivers
3.2.1. Economic Drivers
3.2.2. Supply Side Drivers
3.2.3. Demand Side Drivers
3.3. Market Restraints
3.4. Market Trends
3.5. Trend Analysis- Impact on Time Line (2021-2031)
3.6. Key Market Indicators
4. COVID-19 Impact Analysis
4.1. Impact on the Supply Chain
4.1.1. Orders
4.1.2. Production
4.1.3. Deliveries
4.2. Impact Analysis:
4.2.1. Impact on Q1, 2020 vs 2020
4.2.2. Impact Analysis, By Company
4.2.3. Impact Analysis, By Geography/Country
4.3. Planning for Recovery and Regrowth
5. Associated Industry and Key Indicator Assessment
5.1. Parent Industry Overview
5.2. Supply Chain Analysis
5.2.1. Profitability and Gross Margin Analysis By Competition
5.2.2. List of Active Participants- By Region
5.2.2.1. Raw Material Suppliers
5.2.2.2. Key Manufacturers
5.2.2.3. Integrators
5.2.2.4. Key Distributor/Retailers
5.3. Integration Type Roadmap
5.4. Porter’s Five Forces Analysis
6. Global Smart Antenna Market Analysis and Forecast
6.1. Market Size Analysis (2017-2020) and Forecast (2021-2031)
6.1.1. Market Value (US$ Mn) and Volume (Thousand Units) and Y-o-Y Growth
6.2. Global Smart Antenna Market Scenario Forecast (Optimistic, Likely and Conservative Market Conditions)
6.2.1. Forecast Factors and Relevance of Impact
6.2.2. Regional Smart Antenna Market Business Performance Summary
7. Global Smart Antenna Market Analysis By Type
7.1. Introduction
7.1.1. Y-o-Y Growth Comparison By Type
7.2. Smart Antenna Market Size (US$ Mn) Analysis & Forecast, By Type, 2017 - 2031
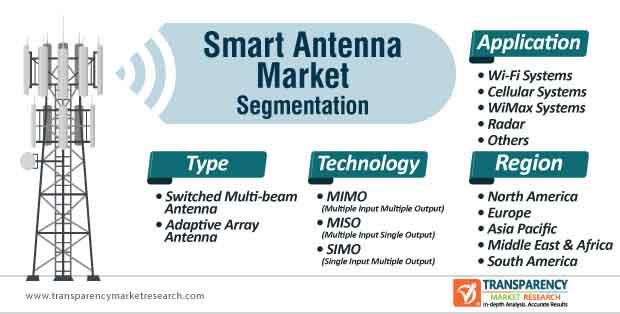
7.2.1. Switched Multi-beam Antenna
7.2.2. Adaptive Array Antenna
7.3. Market Attractiveness Analysis By Type
8. Global Smart Antenna Market Analysis By Technology
8.1. Introduction
8.1.1. Y-o-Y Growth Comparison By Technology
8.2. Smart Antenna Market Size (US$ Mn) Analysis & Forecast, By Technology, 2017 - 2031
8.2.1. MIMO (Multiple Input Multiple Output)
8.2.2. MISO (Multiple Input Single Output)
8.2.3. SIMO (Single Input Multiple Output)
8.3. Market Attractiveness Analysis By Technology
9. Global Smart Antenna Market Analysis By Application
9.1. Introduction
9.1.1. Y-o-Y Growth Comparison By Application
9.2. Smart Antenna Market Size (US$ Mn) Analysis & Forecast, By Application, 2017 - 2031
9.2.1. Wi-Fi Systems
9.2.2. Cellular Systems
9.2.3. WiMax Systems
9.2.4. Radar
9.2.5. Others
9.3. Market Attractiveness Analysis By Application
10. Global Smart Antenna Market Analysis and Forecast, By Region
10.1. Introduction
10.1.1. Basis Point Share (BPS) Analysis By Region
10.2. Smart Antenna Market Size (US$ Mn) and Analysis & Forecast, By Region, 2017 - 2031
10.2.1. North America
10.2.2. Europe
10.2.3. Asia Pacific
10.2.4. Middle East & Africa
10.2.5. South America
10.3. Market Attractiveness Analysis By Region
11. North America Smart Antenna Market Analysis and Forecast
11.1. Introduction
11.2. Drivers and Restraints: Impact Analysis
11.3. Smart Antenna Market Size (US$ Mn) Analysis & Forecast, By Type, 2017 - 2031
11.3.1. Switched Multi-beam Antenna
11.3.2. Adaptive Array Antenna
11.4. Smart Antenna Market Size (US$ Mn) Analysis & Forecast, By Technology, 2017 - 2031
11.4.1. MIMO (Multiple Input Multiple Output)
11.4.2. MISO (Multiple Input Single Output)
11.4.3. SIMO (Single Input Multiple Output)
11.5. Smart Antenna Market Size (US$ Mn) Analysis & Forecast, By Application, 2017 - 2031
11.5.1. Wi-Fi Systems
11.5.2. Cellular Systems
11.5.3. WiMax Systems
11.5.4. Radar
11.5.5. Others
11.6. Smart Antenna Market Size (US$ Mn) Analysis & Forecast, By Country, 2017 - 2031
11.6.1. U.S.
11.6.2. Canada
11.6.3. Mexico
11.7. Market Attractiveness Analysis
11.7.1. Integration Type
11.7.2. Technology
11.7.3. Application
11.7.4. Country
12. Europe Smart Antenna Market Analysis and Forecast
12.1. Introduction
12.2. Drivers and Restraints: Impact Analysis
12.3. Smart Antenna Market Size (US$ Mn) Analysis & Forecast, By Type, 2017 - 2031
12.3.1. Switched Multi-beam Antenna
12.3.2. Adaptive Array Antenna
12.4. Smart Antenna Market Size (US$ Mn) Analysis & Forecast, By Technology, 2017 - 2031
12.4.1. MIMO (Multiple Input Multiple Output)
12.4.2. MISO (Multiple Input Single Output)
12.4.3. SIMO (Single Input Multiple Output)
12.5. Smart Antenna Market Size (US$ Mn) Analysis & Forecast, By Application, 2017 - 2031
12.5.1. Wi-Fi Systems
12.5.2. Cellular Systems
12.5.3. WiMax Systems
12.5.4. Radar
12.5.5. Others
12.6. Smart Antenna Market Size (US$ Mn) Analysis & Forecast, By Country & Sub-region, 2017 - 2031
12.6.1. U.K.
12.6.2. Germany
12.6.3. France
12.6.4. Italy
12.6.5. Russia
12.6.6. Rest of Europe
12.7. Market Attractiveness Analysis
12.7.1. Type
12.7.2. Technology
12.7.3. Application
12.7.4. Country
13. Asia Pacific Smart Antenna Market Analysis and Forecast
13.1. Introduction
13.2. Drivers and Restraints: Impact Analysis
13.3. Smart Antenna Market Size (US$ Mn) Analysis & Forecast, By Type, 2017 - 2031
13.3.1. Switched Multi-beam Antenna
13.3.2. Adaptive Array Antenna
13.4. Smart Antenna Market Size (US$ Mn) Analysis & Forecast, By Technology, 2017 - 2031
13.4.1. MIMO (Multiple Input Multiple Output)
13.4.2. MISO (Multiple Input Single Output)
13.4.3. SIMO (Single Input Multiple Output)
13.5. Smart Antenna Market Size (US$ Mn) Analysis & Forecast, By Application, 2017 - 2031
13.5.1. Wi-Fi Systems
13.5.2. Cellular Systems
13.5.3. WiMax Systems
13.5.4. Radar
13.5.5. Others
13.6. Smart Antenna Market Size (US$ Mn) Analysis & Forecast, By Country & Sub-region, 2017 - 2031
13.6.1. China
13.6.2. India
13.6.3. Japan
13.6.4. South Korea
13.6.5. ASEAN
13.6.6. Rest of Asia Pacific
13.7. Market Attractiveness Analysis
13.7.1. Type
13.7.2. Raw Material
13.7.3. Application
13.7.4. Country
14. Middle East & Africa (MEA) Smart Antenna Market Analysis and Forecast
14.1. Introduction
14.2. Drivers and Restraints: Impact Analysis
14.3. Smart Antenna Market Size (US$ Mn) Analysis & Forecast, By Type, 2017 - 2031
14.3.1. Switched Multi-beam Antenna
14.3.2. Adaptive Array Antenna
14.4. Smart Antenna Market Size (US$ Mn) Analysis & Forecast, By Technology, 2017 - 2031
14.4.1. MIMO (Multiple Input Multiple Output)
14.4.2. MISO (Multiple Input Single Output)
14.4.3. SIMO (Single Input Multiple Output)
14.5. Smart Antenna Market Size (US$ Mn) Analysis & Forecast, By Application, 2017 - 2031
14.5.1. Wi-Fi Systems
14.5.2. Cellular Systems
14.5.3. WiMax Systems
14.5.4. Radar
14.5.5. Others
14.6. Smart Antenna Market Size (US$ Mn) Analysis & Forecast, By Country & Sub-region, 2017, 2017 - 2031
14.6.1. GCC Countries
14.6.2. South Africa
14.6.3. North Africa
14.6.4. Rest of MEA
14.7. Market Attractiveness Analysis
14.7.1. Type
14.7.2. Raw Material
14.7.3. Application
14.7.4. Country
15. South America Smart Antenna Market Analysis and Forecast
15.1. Introduction
15.2. Drivers and Restraints: Impact Analysis
15.3. Smart Antenna Market Size (US$ Mn) Analysis & Forecast, By Type, 2017 - 2031
15.3.1. Switched Multi-beam Antenna
15.3.2. Adaptive Array Antenna
15.4. Smart Antenna Market Size (US$ Mn) Analysis & Forecast, By Technology, 2017 - 2031
15.4.1. MIMO (Multiple Input Multiple Output)
15.4.2. MISO (Multiple Input Single Output)
15.4.3. SIMO (Single Input Multiple Output)
15.5. Smart Antenna Market Size (US$ Mn) Analysis & Forecast, By Application, 2017 - 2031
15.5.1. Wi-Fi Systems
15.5.2. Cellular Systems
15.5.3. WiMax Systems
15.5.4. Radar
15.5.5. Others
15.6. Smart Antenna Market Size (US$ Mn) Analysis & Forecast, By Country & Sub-region, 2017, 2017 - 2031
15.6.1. Brazil
15.6.2. Argentina
15.6.3. Rest of South America
15.7. Market Attractiveness Analysis
15.7.1. Type
15.7.2. Technology
15.7.3. Application
15.7.4. Country
16. Competition Assessment
16.1. Global Smart Antenna Market Competition - a Dashboard View
16.2. Global Smart Antenna Market Structure Analysis
16.3. Global Smart Antenna Market Company Share Analysis, by Value and Volume (2020)
16.4. Key Participants Market Presence (Intensity Mapping) by Region
17. Competition Deep-dive (Manufacturers/Suppliers)
17.1. Agilent Technologies
17.1.1. Overview
17.1.2. Product Portfolio
17.1.3. Sales Footprint
17.1.4. Channel Footprint
17.1.4.1. Distributors List
17.1.5. Strategy Overview
17.1.5.1. Marketing Strategy
17.1.5.2. Culture Strategy
17.1.5.3. Channel Strategy
17.1.6. SWOT Analysis
17.1.7. Financial Analysis
17.1.8. Revenue Share
17.1.8.1. By Region
17.1.9. Key Clients
17.1.10. Analyst Comments
17.2. Broadcom
17.2.1. Overview
17.2.2. Product Portfolio
17.2.3. Sales Footprint
17.2.4. Channel Footprint
17.2.4.1. Distributors List
17.2.5. Strategy Overview
17.2.5.1. Marketing Strategy
17.2.5.2. Culture Strategy
17.2.5.3. Channel Strategy
17.2.6. SWOT Analysis
17.2.7. Financial Analysis
17.2.8. Revenue Share
17.2.8.1. By Region
17.2.9. Key Clients
17.2.10. Analyst Comments
17.3. Ciena Corporation
17.3.1. Overview
17.3.2. Product Portfolio
17.3.3. Sales Footprint
17.3.4. Channel Footprint
17.3.4.1. Distributors List
17.3.5. Strategy Overview
17.3.5.1. Marketing Strategy
17.3.5.2. Culture Strategy
17.3.5.3. Channel Strategy
17.3.6. SWOT Analysis
17.3.7. Financial Analysis
17.3.8. Revenue Share
17.3.8.1. By Region
17.3.9. Key Clients
17.3.10. Analyst Comments
17.4. Enablence
17.4.1. Overview
17.4.2. Product Portfolio
17.4.3. Sales Footprint
17.4.4. Channel Footprint
17.4.4.1. Distributors List
17.4.5. Strategy Overview
17.4.5.1. Marketing Strategy
17.4.5.2. Culture Strategy
17.4.5.3. Channel Strategy
17.4.6. SWOT Analysis
17.4.7. Financial Analysis
17.4.8. Revenue Share
17.4.8.1. By Region
17.4.9. Key Clients
17.4.10. Analyst Comments
17.5. Finisar Corporation
17.5.1. Overview
17.5.2. Product Portfolio
17.5.3. Sales Footprint
17.5.4. Channel Footprint
17.5.4.1. Distributors List
17.5.5. Strategy Overview
17.5.5.1. Marketing Strategy
17.5.5.2. Culture Strategy
17.5.5.3. Channel Strategy
17.5.6. SWOT Analysis
17.5.7. Financial Analysis
17.5.8. Revenue Share
17.5.8.1. By Region
17.5.9. Key Clients
17.5.10. Analyst Comments
17.6. Hewlett Packard
17.6.1. Overview
17.6.2. Product Portfolio
17.6.3. Sales Footprint
17.6.4. Channel Footprint
17.6.4.1. Distributors List
17.6.5. Strategy Overview
17.6.5.1. Marketing Strategy
17.6.5.2. Culture Strategy
17.6.5.3. Channel Strategy
17.6.6. SWOT Analysis
17.6.7. Financial Analysis
17.6.8. Revenue Share
17.6.8.1. By Region
17.6.9. Key Clients
17.6.10. Analyst Comments
17.7. Huawei Technologies Co., Ltd.
17.7.1. Overview
17.7.2. Product Portfolio
17.7.3. Sales Footprint
17.7.4. Channel Footprint
17.7.4.1. Distributors List
17.7.5. Strategy Overview
17.7.5.1. Marketing Strategy
17.7.5.2. Culture Strategy
17.7.5.3. Channel Strategy
17.7.6. SWOT Analysis
17.7.7. Financial Analysis
17.7.8. Revenue Share
17.7.8.1. By Region
17.7.9. Key Clients
17.7.10. Analyst Comments
17.8. Infinera Corporation
17.8.1. Overview
17.8.2. Product Portfolio
17.8.3. Sales Footprint
17.8.4. Channel Footprint
17.8.4.1. Distributors List
17.8.5. Strategy Overview
17.8.5.1. Marketing Strategy
17.8.5.2. Culture Strategy
17.8.5.3. Channel Strategy
17.8.6. SWOT Analysis
17.8.7. Financial Analysis
17.8.8. Revenue Share
17.8.8.1. By Region
17.8.9. Key Clients
17.8.10. Analyst Comments
17.9. Intel Corporation
17.9.1. Overview
17.9.2. Product Portfolio
17.9.3. Sales Footprint
17.9.4. Channel Footprint
17.9.4.1. Distributors List
17.9.5. Strategy Overview
17.9.5.1. Marketing Strategy
17.9.5.2. Culture Strategy
17.9.5.3. Channel Strategy
17.9.6. SWOT Analysis
17.9.7. Financial Analysis
17.9.8. Revenue Share
17.9.8.1. By Region
17.9.9. Key Clients
17.9.10. Analyst Comments
18. Recommendation- Critical Success Factors
19. Research Methodology
20. Assumptions & Acronyms Used
List of Tables
Table 01: Global Smart Antenna Market Revenue (US$ Mn), by Integration Type, 2017–2031
Table 02: Global Smart Antenna Market Volume (Thousand Units), by Integration Type, 2017–2031
Table 03: Global Smart Antenna Market Revenue (US$ Mn), by Raw Material, 2017–2031
Table 04: Global Smart Antenna Market Revenue (US$ Mn), by Component, 2017–2031
Table 05: Global Smart Antenna Market Revenue (US$ Mn), by Application, 2017–2031
Table 06: Global Smart Antenna Market Revenue (US$ Mn), by Application, Optical Communication, 2017–2031
Table 07: Global Smart Antenna Market Revenue (US$ Mn), by Application, Sensing, 2017–2031
Table 08: Global Smart Antenna Market Revenue (US$ Mn), by Application, Optical Signal Processing, 2017–2031
Table 09: Global Smart Antenna Market Revenue (US$ Mn), by Application, Biophotonics, 2017–2031
Table 10: Global Smart Antenna Market Revenue (US$ Mn), by Region, 2017–2031
Table 11: Global Smart Antenna Market Volume (Thousand Units), by Region, 2017–2031
Table 12: North America Smart Antenna Market Revenue (US$ Mn), by Integration Type, 2017–2031
Table 13: North America Smart Antenna Market Volume (Thousand Units), by Integration Type, 2017–2031
Table 14: North America Smart Antenna Market Revenue (US$ Mn), by Raw Material, 2017–2031
Table 15: North America Smart Antenna Market Revenue (US$ Mn), by Component, 2017–2031
Table 16: North America Smart Antenna Market Revenue (US$ Mn), by Application, 2017–2031
Table 17: North America Smart Antenna Market Revenue (US$ Mn), by Application, Optical Communication, 2017–2031
Table 18: North America Smart Antenna Market Revenue (US$ Mn), by Application, Sensing, 2017–2031
Table 19: North America Smart Antenna Market Revenue (US$ Mn), by Application, Optical Signal Processing, 2017–2031
Table 20: North America Smart Antenna Market Revenue (US$ Mn), by Application, Biophotonics, 2017–2031
Table 21: North America Smart Antenna Market Revenue (US$ Mn), by Country, 2017–2031
Table 22: North America Smart Antenna Market Volume (Thousand Units), by Country, 2017–2031
Table 23: Europe Smart Antenna Market Revenue (US$ Mn), by Integration Type, 2017–2031
Table 24: Europe Smart Antenna Market Volume (Thousand Units), by Integration Type, 2017–2031
Table 25: Europe Smart Antenna Market Revenue (US$ Mn), by Raw Material, 2017–2031
Table 26: Europe Smart Antenna Market Revenue (US$ Mn), by Component, 2017–2031
Table 27: Europe Smart Antenna Market Revenue (US$ Mn), by Application, 2017–2031
Table 28: Europe Smart Antenna Market Revenue (US$ Mn), by Application, Optical Communication, 2017–2031
Table 29: Europe Smart Antenna Market Revenue (US$ Mn), by Application, Sensing, 2017–2031
Table 30: Europe Smart Antenna Market Revenue (US$ Mn), by Application, Optical Signal Processing, 2017–2031
Table 31: Europe Smart Antenna Market Revenue (US$ Mn), by Application, Biophotonics, 2017–2031
Table 32: Europe Smart Antenna Market Revenue (US$ Mn), by Country, 2017–2031
Table 33: Europe Smart Antenna Market Volume (Thousand Units), by Country, 2017–2031
Table 34: Asia Pacific Smart Antenna Market Revenue (US$ Mn), by Integration Type, 2017–2031
Table 35: Asia Pacific Smart Antenna Market Volume (Thousand Units), by Integration Type, 2017–2031
Table 36: Asia Pacific Smart Antenna Market Revenue (US$ Mn), by Raw Material, 2017–2031
Table 37: Asia Pacific Smart Antenna Market Revenue (US$ Mn), by Component, 2017–2031
Table 38: Asia Pacific Smart Antenna Market Revenue (US$ Mn), by Application, 2017–2031
Table 39: Asia Pacific Smart Antenna Market Revenue (US$ Mn), by Application, Optical Communication, 2017–2031
Table 40: Asia Pacific Smart Antenna Market Revenue (US$ Mn), by Application, Sensing, 2017–2031
Table 41: Asia Pacific Smart Antenna Market Revenue (US$ Mn), by Application, Optical Signal Processing, 2017–2031
Table 42: Asia Pacific Smart Antenna Market Revenue (US$ Mn), by Application, Biophotonics, 2017–2031
Table 43: Asia Pacific Smart Antenna Market Revenue (US$ Mn), by Country, 2017–2031
Table 44: Asia Pacific Smart Antenna Market Volume (Thousand Units), by Country, 2017–2031
Table 45: Middle East & Africa Smart Antenna Market Revenue (US$ Mn), by Integration Type, 2017–2031
Table 46: Middle East & Africa Smart Antenna Market Volume (Thousand Units), by Integration Type, 2017–2031
Table 47: Middle East & Africa Smart Antenna Market Revenue (US$ Mn), by Raw Material, 2017–2031
Table 48: Middle East & Africa Smart Antenna Market Revenue (US$ Mn), by Component, 2017–2031
Table 49: Middle East & Africa Smart Antenna Market Revenue (US$ Mn), by Application, 2017–2031
Table 50: Middle East & Africa Smart Antenna Market Revenue (US$ Mn), by Application, Optical Communication, 2017–2031
Table 51: Middle East & Africa Smart Antenna Market Revenue (US$ Mn), by Application, Sensing, 2017–2031
Table 52: Middle East & Africa Smart Antenna Market Revenue (US$ Mn), by Application, Optical Signal Processing, 2017–2031
Table 53: Middle East & Africa Smart Antenna Market Revenue (US$ Mn), by Application, Biophotonics, 2017–2031
Table 54: Middle East & Africa Smart Antenna Market Revenue (US$ Mn), by Country, 2017–2031
Table 55: Middle East & Africa Smart Antenna Market Volume (Thousand Units), by Country, 2017–2031
Table 56: South America Smart Antenna Market Revenue (US$ Mn), by Integration Type, 2017–2031
Table 57: South America Smart Antenna Market Volume (Thousand Units), by Integration Type, 2017–2031
Table 58: South America Smart Antenna Market Revenue (US$ Mn), by Raw Material, 2017–2031
Table 59: South America Smart Antenna Market Revenue (US$ Mn), by Component, 2017–2031
Table 60: South America Smart Antenna Market Revenue (US$ Mn), by Application, 2017–2031
Table 61: South America Smart Antenna Market Revenue (US$ Mn), by Application, Optical Communication, 2017–2031
Table 62: South America Smart Antenna Market Revenue (US$ Mn), by Application, Sensing, 2017–2031
Table 63: South America Smart Antenna Market Revenue (US$ Mn), by Application, Optical Signal Processing, 2017–2031
Table 64: South America Smart Antenna Market Revenue (US$ Mn), by Application, Biophotonics, 2017–2031
Table 65: South America Smart Antenna Market Revenue (US$ Mn), by Country, 2017–2031
Table 66: South America Smart Antenna Market Volume (Thousand Units), by Country, 2017–2031
List of Figures
Figure 01: Global Smart Antenna Market Value (USD Mn) Forecast, 2021–2031
Figure 02: Global Smart Antenna Market Revenue (US$ Mn) Forecast, 2017–2031
Figure 03: Global Smart Antenna Market Y-o-Y Growth Projection, 2017–2031
Figure 04: Global Smart Antenna Market Volume (Thousand Units) Forecast, 2017–2031
Figure 05: Global Smart Antenna Market Y-o-Y Growth Projection, 2017–2031
Figure 06: Global Smart Antenna Market, by Monolithic Integration
Figure 07: Global Smart Antenna Market, by Hybrid Integration
Figure 08: Global Smart Antenna Market, by Module Integration
Figure 09: Global Smart Antenna Market Comparison Matrix, by Integration Type
Figure 10: Global Smart Antenna Market Attractiveness Analysis, by Integration Type
Figure 11: Global Smart Antenna Market, by Indium Phosphide
Figure 12: Global Smart Antenna Market, by Gallium Arsenide
Figure 13: Global Smart Antenna Market, by Lithium Niobate
Figure 14: Global Smart Antenna Market, by Silicon
Figure 15: Global Smart Antenna Market, by Silicon-on-Insulator
Figure 16: Global Smart Antenna Market, by Others
Figure 17: Global Smart Antenna Market Comparison Matrix, by Raw Material
Figure 18: Global Smart Antenna Market Attractiveness Analysis, by Raw Material
Figure 19: Global Smart Antenna Market, by Lasers
Figure 20: Global Smart Antenna Market, by Modulators
Figure 21: Global Smart Antenna Market, by Detectors
Figure 22: Global Smart Antenna Market, by Attenuators
Figure 23: Global Smart Antenna Market, by Multiplexers/De-multiplexers
Figure 24: Global Smart Antenna Market, by Optical Amplifiers
Figure 25: Global Smart Antenna Market Comparison Matrix, by Component
Figure 26: Global Smart Antenna Market Attractiveness Analysis, by Component
Figure 27: Global Smart Antenna Market, by Optical Communication
Figure 28: Global Smart Antenna Market, by Sensing
Figure 29: Global Smart Antenna Market, by Optical Signal Processing
Figure 30: Global Smart Antenna Market, by Biophotonics
Figure 31: Global Smart Antenna Market Comparison Matrix, by Application
Figure 32: Global Smart Antenna Market Attractiveness Analysis, by Application
Figure 33: Global Smart Antenna Market Value Share Analysis, by Region (2020A)
Figure 34: Global Smart Antenna Market Value Share Analysis, by Region (2031F)
Figure 35: Global Smart Antenna Market Volume Share Analysis, by Region (2020A)
Figure 36: Global Smart Antenna Market Volume Share Analysis, by Region (2031F)
Figure 37: Global Smart Antenna Market Attractiveness Analysis, by Region
Figure 38: North America Smart Antenna Market Revenue (US$ Mn) Forecast, 2017–2031
Figure 39: North America Smart Antenna Market Y-o-Y Growth Projection, 2017–2031
Figure 40: North America Smart Antenna Market Volume (Thousand Units) Forecast, 2017–2031
Figure 41: North America Smart Antenna Market Y-o-Y Growth Projection, 2017–2031
Figure 42: North America Smart Antenna Market Value Share Analysis, by Integration Type (2020A)
Figure 43: North America Smart Antenna Market Value Share Analysis, by Integration Type (2031F)
Figure 44: North America Smart Antenna Market Volume Share Analysis, by Integration Type (2020A)
Figure 45: North America Smart Antenna Market Volume Share Analysis, by Integration Type (2031F)
Figure 46: North America Smart Antenna Market Value Share Analysis, by Raw Material (2020A)
Figure 47: North America Smart Antenna Market Value Share Analysis, by Raw Material (2031F)
Figure 48: North America Smart Antenna Market Value Share Analysis, by Component (2020A)
Figure 49: North America Smart Antenna Market Value Share Analysis, by Component (2031F)
Figure 50: North America Smart Antenna Market Value Share Analysis, by Application (2020A)
Figure 51: North America Smart Antenna Market Value Share Analysis, by Application (2031F)
Figure 52: North America Smart Antenna Market Value Share Analysis, by Country (2020A)
Figure 53: North America Smart Antenna Market Value Share Analysis, by Country (2031F)
Figure 54: North America Smart Antenna Market Volume Share Analysis, by Country (2020A)
Figure 55: North America Smart Antenna Market Volume Share Analysis, by Country (2031F)
Figure 56: North America Smart Antenna Market Attractiveness Analysis, by Integration Type
Figure 57: North America Smart Antenna Market Attractiveness Analysis, by Raw Material
Figure 58: North America Smart Antenna Market Attractiveness Analysis, by Component
Figure 59: North America Smart Antenna Market Attractiveness Analysis, by Application
Figure 60: North America Smart Antenna Market Attractiveness Analysis, by Country
Figure 61: Europe Smart Antenna Market Revenue (US$ Mn) Forecast, 2017–2031
Figure 62: Europe Smart Antenna Market Y-o-Y Growth Projection, 2017–2031
Figure 63: Europe Smart Antenna Market Volume (Thousand Units) Forecast, 2017–2031
Figure 64: Europe Smart Antenna Market Y-o-Y Growth Projection, 2017–2031
Figure 65: Europe Smart Antenna Market Value Share Analysis, by Integration Type (2020A)
Figure 66: Europe Smart Antenna Market Value Share Analysis, by Integration Type (2031F)
Figure 67: Europe Smart Antenna Market Volume Share Analysis, by Integration Type (2020A)
Figure 68: Europe Smart Antenna Market Volume Share Analysis, by Integration Type (2031F)
Figure 69: Europe Smart Antenna Market Value Share Analysis, by Raw Material (2020A)
Figure 70: Europe Smart Antenna Market Value Share Analysis, by Raw Material (2031F)
Figure 71: Europe Smart Antenna Market Value Share Analysis, by Component (2020A)
Figure 72: Europe Smart Antenna Market Value Share Analysis, by Component (2031F)
Figure 73: Europe Smart Antenna Market Value Share Analysis, by Application (2020A)
Figure 74: Europe Smart Antenna Market Value Share Analysis, by Application (2031F)
Figure 75: Europe Smart Antenna Market Value Share Analysis, by Country (2020A)
Figure 76: Europe Smart Antenna Market Value Share Analysis, by Country (2031F)
Figure 77: Europe Smart Antenna Market Volume Share Analysis, by Country (2020A)
Figure 78: Europe Smart Antenna Market Volume Share Analysis, by Country (2031F)
Figure 79: Europe Smart Antenna Market Attractiveness Analysis, by Integration Type
Figure 80: Europe Smart Antenna Market Attractiveness Analysis, by Raw Material
Figure 81: Europe Smart Antenna Market Attractiveness Analysis, by Component
Figure 82: Europe Smart Antenna Market Attractiveness Analysis, by Application
Figure 83: Europe Smart Antenna Market Attractiveness Analysis, by Country
Figure 84: Asia Pacific Smart Antenna Market Revenue (US$ Mn) Forecast, 2017–2031
Figure 85: Asia Pacific Smart Antenna Market Y-o-Y Growth Projection, 2017–2031
Figure 86: Asia Pacific Smart Antenna Market Volume (Thousand Units) Forecast, 2017–2031
Figure 87: Asia Pacific Smart Antenna Market Y-o-Y Growth Projection, 2017–2031
Figure 88: Asia Pacific Smart Antenna Market Value Share Analysis, by Integration Type (2020A)
Figure 89: Asia Pacific Smart Antenna Market Value Share Analysis, by Integration Type (2031F)
Figure 90: Asia Pacific Smart Antenna Market Volume Share Analysis, by Integration Type (2020A)
Figure 91: Asia Pacific Smart Antenna Market Volume Share Analysis, by Integration Type (2031F)
Figure 92: Asia Pacific Smart Antenna Market Value Share Analysis, by Raw Material (2020A)
Figure 93: Asia Pacific Smart Antenna Market Value Share Analysis, by Raw Material (2031F)
Figure 94: Asia Pacific Smart Antenna Market Value Share Analysis, by Component (2020A)
Figure 95: Asia Pacific Smart Antenna Market Value Share Analysis, by Component (2031F)
Figure 96: Asia Pacific Smart Antenna Market Value Share Analysis, by Application (2020A)
Figure 97: Asia Pacific Smart Antenna Market Value Share Analysis, by Application (2031F)
Figure 98: Asia Pacific Smart Antenna Market Value Share Analysis, by Country (2020A)
Figure 99: Asia Pacific Smart Antenna Market Value Share Analysis, by Country (2031F)
Figure 100: Asia Pacific Smart Antenna Market Volume Share Analysis, by Country (2020A)
Figure 101: Asia Pacific Smart Antenna Market Volume Share Analysis, by Country (2031F)
Figure 102: Asia Pacific Smart Antenna Market Attractiveness Analysis, by Integration Type
Figure 103: Asia Pacific Smart Antenna Market Attractiveness Analysis, by Raw Material
Figure 104: Asia Pacific Smart Antenna Market Attractiveness Analysis, by Component
Figure 105: Asia Pacific Smart Antenna Market Attractiveness Analysis, by Application
Figure 106: Asia Pacific Smart Antenna Market Attractiveness Analysis, by Country
Figure 107: Middle East & Africa Smart Antenna Market Revenue (US$ Mn) Forecast, 2017–2031
Figure 108: Middle East & Africa Smart Antenna Market Y-o-Y Growth Projection, 2017–2031
Figure 109: Middle East & Africa Smart Antenna Market Volume (Thousand Units) Forecast, 2017–2031
Figure 110: Middle East & Africa Smart Antenna Market Y-o-Y Growth Projection, 2017–2031
Figure 111: Middle East & Africa Smart Antenna Market Value Share Analysis, by Integration Type (2020A)
Figure 112: Middle East & Africa Smart Antenna Market Value Share Analysis, by Integration Type (2031F)
Figure 113: Middle East & Africa Smart Antenna Market Volume Share Analysis, by Integration Type (2020A)
Figure 114: Middle East & Africa Smart Antenna Market Volume Share Analysis, by Integration Type (2031F)
Figure 115: Middle East & Africa Smart Antenna Market Value Share Analysis, by Raw Material (2020A)
Figure 116: Middle East & Africa Smart Antenna Market Value Share Analysis, by Raw Material (2031F)
Figure 117: Middle East & Africa Smart Antenna Market Value Share Analysis, by Component (2020A)
Figure 118: Middle East & Africa Smart Antenna Market Value Share Analysis, by Component (2031F)
Figure 119: Middle East & Africa Smart Antenna Market Value Share Analysis, by Application (2020A)
Figure 120: Middle East & Africa Smart Antenna Market Value Share Analysis, by Application (2031F)
Figure 121: Middle East & Africa Smart Antenna Market Value Share Analysis, by Country (2020A)
Figure 122: Middle East & Africa Smart Antenna Market Value Share Analysis, by Country (2031F)
Figure 123: Middle East & Africa Smart Antenna Market Volume Share Analysis, by Country (2020A)
Figure 124: Middle East & Africa Smart Antenna Market Volume Share Analysis, by Country (2031F)
Figure 125: Middle East & Africa Smart Antenna Market Attractiveness Analysis, by Integration Type
Figure 126: Middle East & Africa Smart Antenna Market Attractiveness Analysis, by Raw Material
Figure 127: Middle East & Africa Smart Antenna Market Attractiveness Analysis, by Component
Figure 128: Middle East & Africa Smart Antenna Market Attractiveness Analysis, by Application
Figure 129: Middle East & Africa Smart Antenna Market Attractiveness Analysis, by Country
Figure 130: South America Smart Antenna Market Revenue (US$ Mn) Forecast, 2017–2031
Figure 131: South America Smart Antenna Market Y-o-Y Growth Projection, 2017–2031
Figure 132: South America Smart Antenna Market Volume (Thousand Units) Forecast, 2017–2031
Figure 133: South America Smart Antenna Market Y-o-Y Growth Projection, 2017–2031
Figure 134: South America Smart Antenna Market Value Share Analysis, by Integration Type (2020A)
Figure 135: South America Smart Antenna Market Value Share Analysis, by Integration Type (2031F)
Figure 136: South America Smart Antenna Market Volume Share Analysis, by Integration Type (2020A)
Figure 137: South America Smart Antenna Market Volume Share Analysis, by Integration Type (2031F)
Figure 138: South America Smart Antenna Market Value Share Analysis, by Raw Material (2020A)
Figure 139: South America Smart Antenna Market Value Share Analysis, by Raw Material (2031F)
Figure 140: South America Smart Antenna Market Value Share Analysis, by Component (2020A)
Figure 141: South America Smart Antenna Market Value Share Analysis, by Component (2031F)
Figure 142: South America Smart Antenna Market Value Share Analysis, by Application (2020A)
Figure 143: South America Smart Antenna Market Value Share Analysis, by Application (2031F)
Figure 144: South America Smart Antenna Market Value Share Analysis, by Country (2020A)
Figure 145: South America Smart Antenna Market Value Share Analysis, by Country (2031F)
Figure 146: South America Smart Antenna Market Volume Share Analysis, by Country (2020A)
Figure 147: South America Smart Antenna Market Volume Share Analysis, by Country (2031F)
Figure 148: South America Smart Antenna Market Attractiveness Analysis, by Integration Type
Figure 149: South America Smart Antenna Market Attractiveness Analysis, by Raw Material
Figure 150: South America Smart Antenna Market Attractiveness Analysis, by Component
Figure 151: South America Smart Antenna Market Attractiveness Analysis, by Application
Figure 152: South America Smart Antenna Market Attractiveness Analysis, by Country
Copyright © Transparency Market Research, Inc. All Rights reserved
Trust Online

Smart Antenna Market