
Reports
Reports
Analysts’ Viewpoint on Market Scenario
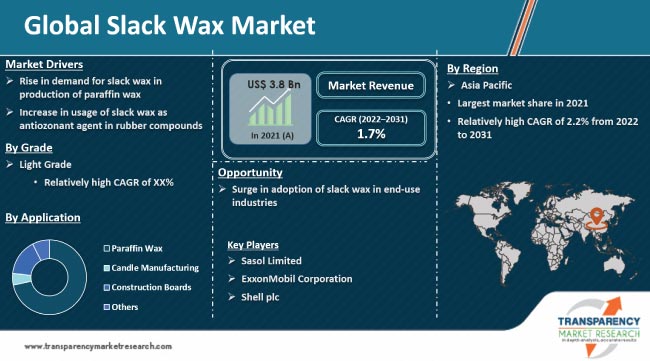
Surge in demand for slack wax for the production of paraffin wax due to the high paraffin content and high flash point in paraffin wax is driving the global slack wax industry. Paraffin wax is used in a wide range of applications including paper coating in flexible packaging, candle manufacturing, rubber, and cosmetics. Rise in adoption of flexible packaging and personal care products is expected to augment the business during the forecast period.
Implementation of stringent government regulations on the production of group I base oil, in order to curb sulfur emissions, is likely to hamper the slack wax market development. Increase in the emission of carbon dioxide, carbon monoxide, sulfur, and other particulate matter has compelled oil & gas companies to invest in technologies that aid in the sustainable production of group II and group III base oils that contain very low sulfur but do not produce slack wax. Rise in focus on natural wax and synthetic paraffin wax is also limiting market growth.
Slack wax, a petroleum product, is used as a key raw material in the production of paraffin wax. It is derived from lubricating oils, which possess high oil content. Slack wax is yellow or brown in color. It is available in two grades ‒ light grade and heavy grade ‒ based on its melting point. Slack wax with a melting point between 50˚C and 52˚C is categorized into light grade, while slack wax with a melting point between 53˚C and 55˚C is categorized into heavy grade. The oil content in slack wax ranges from 5.0% to as high as 35%.
Major slack wax uses include the production of wax emulsions, construction boards, matches, glass wool, synthetic fire logs, inks, weed bars, carbon paper, composite wood panels, chemicals, fertilizers, paraffin wax, and candles.
Slack wax is a key raw material used in the production of paraffin wax by utilizing solvent de-oiling and hydro-finishing. Paraffin wax is extensively employed in the manufacture of various products such as candles, wax paper, polishes, cosmetics, and electrical insulators. Slack wax has high paraffin content and possesses a high flash point. It is light in color and has non-staining properties.
Paraffin wax offers excellent water penetration barrier and protection properties. This makes it an ideal material for coating construction boards and papers. Its ability to blend with various wax-based products makes it an essential ingredient in the manufacture of polishes, cosmetics, and candles.
Surge in usage of paraffin wax in flexible packaging, candle manufacturing, and rubber and cosmetics applications is anticipated to fuel the global slack wax business expansion during the forecast period. Additionally, growth in the personal care industry in developing countries such as India, China, Brazil, Argentina, South Africa, and Thailand is likely to boost the market for slack wax in the next few years.
Paraffin wax is colorless, tasteless, and odorless. It is used in skin-softening salon and spa treatments. Paraffin wax helps provide pain relief in sore joints and muscles. It offers certain benefits in cosmetic applications. Paraffin wax is applied on the hands, cuticles, and feet. It removes dead cells, opens blocked pores, softens, and hydrates skin. Therefore, increase in usage of paraffin wax in cosmetic products is projected to augment the slack wax market progress in the near future.
Slack wax is an unconverted Vacuum Gas Oil (VGO) boiling range material obtained from a hydrocracker. This highly saturated heavy material is produced by chilling and solvent filter-pressing wax distillate. Slack wax is utilized as a blending component or waterproofing agent in the manufacture of various industrial products such as candles, polishes, matches, inks, and carbon paper. It is employed as a processing aid in rubber compounds for providing economical internal lubrication, mill and mold release, and improved compound flow. Rubber compounds containing slack wax offer less surface cracking of rubber parts when exposed to the outdoor environment.
Slack wax acts as an antiozonant agent to provide high ozone resistance and reduce tackiness in order to offer extended product life. Paraffin-micro wax blend, when used in rubber compounds, migrates to the surface of the rubber product and forms a protective layer that prevents the cracking of rubber. Thus, rise in demand for slack wax as an antiozonant agent for prevention of the cracking of rubber compounds is driving the global slack wax market share.
Rise in usage of hot melt adhesives in furniture, construction, and packaging applications is expected to propel the demand for paraffin wax, thereby fueling the slack wax business. Slack wax is extensively employed in hot melt adhesive formulations to control the viscosity, flow, and set time of adhesives; and provide flexibility and elongation. It also increases bond strength and improves temperature resistance. Paraffin wax possesses low viscosity. This helps optimize the rheological behavior of the adhesive formulation. This also reduces the viscosity of the resin and polymer to provide sufficient mixing.
Surge in demand for aromatherapy and rise in consumer awareness regarding home ambiance are anticipated to boost sales of fragrance wax. This, in turn, is likely to drive the global market for slack wax during the forecast period. Slack wax plays an important role in increasing the blocking point of the final adhesive to prevent adhesive pastilles from sticking together during transportation and storage. It is employed in the manufacture of fragrance candles, as it is cost-effective and requires lesser machinery costs.
Slack wax is also used as a waterproofing agent or blending component in the manufacture of various industrial products such as canvass coatings and composite wood panels. It is utilized as a controlled release agent in the manufacture of fertilizers and chemicals.
In terms of grade, the light grade segment held major share of 52.5% of the global slack wax industry in 2021. It is estimated to dominate the market during the forecast period. Increase in consumer awareness regarding home ambiance is boosting adoption of fragrance wax and aromatherapy, thereby driving the segment.
The heavy grade segment is also likely to grow at a moderate pace in the next few years. Heavy slack wax is utilized in the manufacture of candles, adhesives, inks, and rubbers. Heavy slack wax contains higher melting and congealing points.
Based on application, the paraffin wax segment accounted for 71.6% share of the global slack wax business in 2021. Paraffin wax is widely used to manufacture candles, anti-caking agents for fertilizers, anti-corrosion agents, and wood impregnation products. The candle manufacturing segment is estimated to grow at a steady pace during the forecast period.
Asia Pacific accounted for prominent share of 36.8% of the global market for slack wax in 2021. The market in the region is projected to grow at a notable pace during the forecast period. China, India, and the ASEAN sub-region are leading consumers of micro slack wax. Expansion in cosmetics, personal care, and packaging industries is fueling the demand for slack wax in these nations. Countries such as Malaysia, South Korea, and Vietnam import majority of the slack wax from China. Several manufacturers of slack wax are concentrated in Asia Pacific. China, India, Thailand, and Indonesia are witnessing surge in the manufacturing capacity of slack wax.
North America and Europe are also key markets for slack wax. Rise in usage of slack wax in the manufacture of candles in Poland, the Netherlands, and other countries in Eastern Europe is likely to boost the Europe slack wax market statistics during the forecast period. Reviving economy, increase in technological investment in deoiling and dewaxing units, rise in demand for paraffin wax and candles, and R&D in lube oils are driving the market in these regions.
The global slack wax industry is consolidated, with a small number of large-scale vendors controlling majority of the market share. Most slack wax suppliers are fueling their R&D investments to expand their product portfolios. Sasol Limited, ExxonMobil Corporation, Shell plc, RAHA Paraffin Company, Thai Oil Public Company Limited, Iranol Oil Co., American Refining Group, Inc., IRPC Public Company Limited, Eagle Petrochem Company, HF Sinclair Corporation, PT Pertamina, and Polwax S.A. are major entities operating in the market.
Key players have been profiled in the market research report based on parameters such as financial overview, company overview, business strategies, business segments, product portfolio, and recent developments.
|
Attribute |
Detail |
|
Market Size Value in 2021 |
US$ 3.8 Bn |
|
Market Forecast Value in 2031 |
US$ 4.5 Bn |
|
Growth Rate (CAGR) |
1.7% |
|
Forecast Period |
2022–2031 |
|
Historical Data Available for |
2020 |
|
Quantitative Units |
US$ Bn for Value & Kilo Tons for Volume |
|
Market Analysis |
It includes cross segment analysis at global as well as regional level. Furthermore, qualitative analysis includes drivers, restraints, opportunities, key trends, Porter’s Five Forces analysis, value chain analysis, and key trend analysis. |
|
Competition Landscape |
|
|
Format |
Electronic (PDF) + Excel |
|
Market Segmentation |
|
|
Regions Covered |
|
|
Countries Covered |
|
|
Companies Profiled |
|
|
Customization Scope |
Available upon request |
|
Pricing |
Available upon request |
The global market for slack wax stood at US$ 3.8 Bn in 2021.
The CAGR of the market is expected to be 1.7% from 2022 to 2031.
Rise in demand for slack wax in production of paraffin wax and increase in usage of slack wax as antiozonant agent in rubber compounds.
The light grade segment accounted for 52.5% share of the industry in 2021.
Asia Pacific is a more attractive region for vendors in the business.
Sasol Limited, ExxonMobil Corporation, Shell plc, RAHA Paraffin Company, Thai Oil Public Company Limited, Iranol Oil Co., American Refining Group, Inc., IRPC Public Company Limited, Eagle Petrochem Company, HF Sinclair Corporation, PT Pertamina, and Polwax S.A.
1. Executive Summary
1.1. Global Market Outlook
1.2. Demand Side Trends
1.3. Key Facts and Figures
1.4. Trends Impacting Market
1.5. TMR’s Growth Opportunity Wheel
2. Market Overview
2.1. Market Segmentation
2.2. Market Trends
2.3. Market Dynamics
2.3.1. Drivers
2.3.2. Restraints
2.3.3. Opportunities
2.4. Porter’s Five Forces Analysis
2.5. Regulatory Analysis
2.6. Value Chain Analysis
2.6.1. List of Slack Wax Manufacturers
2.6.2. List of Dealers/Distributors
2.6.3. List of Potential Customers
2.7. Cost Structure Analysis
3. COVID-19 Impact Analysis
3.1. Impact on the Supply Chain of Slack Wax Sector
3.2. Impact on the Slack Wax Market – Pre & Post Crisis
4. Production Output Analysis, by Region, 2021
5. Price Trend Analysis and Forecast, 2020-2031
5.1. Price Trend Analysis and Forecast, by Grade
5.2. Price Trend Analysis and Forecast, by Region
6. Global Slack Wax Market Analysis and Forecast, by Grade, 2020–2031
6.1. Introduction and Definitions
6.2. Global Slack Wax Market Volume (Kilo Tons) and Value (US$ Bn) Forecast, by Grade, 2020–2031
6.2.1. Light Grade
6.2.2. Heavy Grade
6.3. Global Slack Wax Market Attractiveness, by Product
7. Global Slack Wax Market Analysis and Forecast, by Application, 2020–2031
7.1. Introduction and Definitions
7.2. Global Slack Wax Market Volume (Kilo Tons) and Value (US$ Bn) Forecast, by Application, 2020–2031
7.2.1. Paraffin Wax
7.2.2. Candle Manufacturing
7.2.3. Construction Boards
7.2.4. Others
7.3. Global Slack Wax Market Attractiveness, by Application
8. Global Slack Wax Market Analysis and Forecast, by Region, 2020–2031
8.1. Key Findings
8.2. Global Slack Wax Market Volume (Kilo Tons) and Value (US$ Bn) Forecast, by Region, 2020–2031
8.2.1. North America
8.2.2. Europe
8.2.3. Asia Pacific
8.2.4. Middle East & Africa
8.2.5. Latin America
8.3. Global Slack Wax Market Attractiveness, by Region
9. North America Slack Wax Market Analysis and Forecast, 2020–2031
9.1. Key Findings
9.2. North America Slack Wax Market Volume (Kilo Tons) and Value (US$ Bn) Forecast, by Grade, 2020–2031
9.3. North America Slack Wax Market Volume (Kilo Tons) and Value (US$ Bn) Forecast, by Application, 2020–2031
9.4. North America Slack Wax Market Volume (Kilo Tons) and Value (US$ Bn) Forecast, by Country, 2020–2031
9.4.1. U.S. Slack Wax Market Volume (Kilo Tons) and Value (US$ Bn) Forecast, by Grade, 2020–2031
9.4.2. U.S. Slack Wax Market Volume (Kilo Tons) and Value (US$ Bn) Forecast, by Application, 2020–2031
9.4.3. Canada Slack Wax Market Volume (Kilo Tons) and Value (US$ Bn) Forecast, by Grade, 2020–2031
9.4.4. Canada Slack Wax Market Volume (Kilo Tons) and Value (US$ Bn) Forecast, by Application, 2020–2031
9.5. North America Slack Wax Market Attractiveness Analysis
10. Europe Slack Wax Market Analysis and Forecast, 2020–2031
10.1. Key Findings
10.2. Europe Slack Wax Market Volume (Kilo Tons) and Value (US$ Bn) Forecast, by Grade, 2020–2031
10.3. Europe Slack Wax Market Volume (Kilo Tons) and Value (US$ Bn) Forecast, by Application, 2020–2031
10.4. Europe Slack Wax Market Volume (Kilo Tons) and Value (US$ Bn) Forecast, by Country and Sub-region, 2020-2031
10.4.1. Germany Slack Wax Market Volume (Kilo Tons) and Value (US$ Bn) Forecast, by Grade, 2020–2031
10.4.2. Germany Slack Wax Market Volume (Kilo Tons) and Value (US$ Bn) Forecast, by Application, 2020–2031
10.4.3. France Slack Wax Market Volume (Kilo Tons) and Value (US$ Bn) Forecast, by Grade, 2020–2031
10.4.4. France Slack Wax Market Volume (Kilo Tons) and Value (US$ Bn) Forecast, by Application, 2020–2031
10.4.5. U.K. Slack Wax Market Volume (Kilo Tons) and Value (US$ Bn) Forecast, by Grade, 2020–2031
10.4.6. U.K. Slack Wax Market Volume (Kilo Tons) and Value (US$ Bn) Forecast, by Application, 2020–2031
10.4.7. Italy Slack Wax Market Volume (Kilo Tons) and Value (US$ Bn) Forecast, by Grade, 2020–2031
10.4.8. Italy Slack Wax Market Volume (Kilo Tons) and Value (US$ Bn) Forecast, by Application, 2020–2031
10.4.9. Spain Slack Wax Market Volume (Kilo Tons) and Value (US$ Bn) Forecast, by Grade, 2020–2031
10.4.10. Spain Slack Wax Market Volume (Kilo Tons) and Value (US$ Bn) Forecast, by Application, 2020–2031
10.4.11. Russia & CIS Slack Wax Market Volume (Kilo Tons) and Value (US$ Bn) Forecast, by Grade, 2020–2031
10.4.12. Russia & CIS Slack Wax Market Volume (Kilo Tons) and Value (US$ Bn) Forecast, by Application, 2020–2031
10.4.13. Rest of Europe Slack Wax Market Volume (Kilo Tons) and Value (US$ Bn) Forecast, by Grade, 2020–2031
10.4.14. Rest of Europe Slack Wax Market Volume (Kilo Tons) and Value (US$ Bn) Forecast, by Application, 2020–2031
10.5. Europe Slack Wax Market Attractiveness Analysis
11. Asia Pacific Slack Wax Market Analysis and Forecast, 2020–2031
11.1. Key Findings
11.2. Asia Pacific Slack Wax Market Volume (Kilo Tons) and Value (US$ Bn) Forecast, by Grade, 2020–2031
11.3. Asia Pacific Slack Wax Market Volume (Kilo Tons) and Value (US$ Bn) Forecast, by Application, 2020–2031
11.4. Asia Pacific Slack Wax Market Volume (Kilo Tons) and Value (US$ Bn) Forecast, by Country and Sub-region, 2020-2031
11.4.1. China Slack Wax Market Volume (Kilo Tons) and Value (US$ Bn) Forecast, by Grade, 2020–2031
11.4.2. China Slack Wax Market Volume (Kilo Tons) and Value (US$ Bn) Forecast, by Application, 2020–2031
11.4.3. Japan Slack Wax Market Volume (Kilo Tons) and Value (US$ Bn) Forecast, by Grade, 2020–2031
11.4.4. Japan Slack Wax Market Volume (Kilo Tons) and Value (US$ Bn) Forecast, by Application, 2020–2031
11.4.5. India Slack Wax Market Volume (Kilo Tons) and Value (US$ Bn) Forecast, by Grade, 2020–2031
11.4.6. India Slack Wax Market Volume (Kilo Tons) and Value (US$ Bn) Forecast, by Application, 2020–2031
11.4.7. South Korea Slack Wax Market Volume (Kilo Tons) and Value (US$ Bn) Forecast, by Grade, 2020–2031
11.4.8. South Korea Slack Wax Market Volume (Kilo Tons) and Value (US$ Bn) Forecast, by Application, 2020–2031
11.4.9. Australia Slack Wax Market Volume (Kilo Tons) and Value (US$ Bn) Forecast, by Grade, 2020–2031
11.4.10. Australia Slack Wax Market Volume (Kilo Tons) and Value (US$ Bn) Forecast, by Application, 2020–2031
11.4.11. ASEAN Slack Wax Market Volume (Kilo Tons) and Value (US$ Bn) Forecast, by Grade, 2020–2031
11.4.12. ASEAN Slack Wax Market Volume (Kilo Tons) and Value (US$ Bn) Forecast, by Application, 2020–2031
11.4.13. Rest of Asia Pacific Slack Wax Market Volume (Kilo Tons) and Value (US$ Bn) Forecast, by Grade, 2020–2031
11.4.14. Rest of Asia Pacific Slack Wax Market Volume (Kilo Tons) and Value (US$ Bn) Forecast, by Application, 2020–2031
11.5. Asia Pacific Slack Wax Market Attractiveness Analysis
12. Latin America Slack Wax Market Analysis and Forecast, 2020–2031
12.1. Key Findings
12.2. Latin America Slack Wax Market Volume (Kilo Tons) and Value (US$ Bn) Forecast, by Grade, 2020–2031
12.3. Latin America Slack Wax Market Volume (Kilo Tons) and Value (US$ Bn) Forecast, by Application, 2020–2031
12.4. Latin America Slack Wax Market Volume (Kilo Tons) and Value (US$ Bn) Forecast, by Country and Sub-region, 2020-2031
12.4.1. Brazil Slack Wax Market Volume (Kilo Tons) and Value (US$ Bn) Forecast, by Grade, 2020–2031
12.4.2. Brazil Slack Wax Market Volume (Kilo Tons) and Value (US$ Bn) Forecast, by Application, 2020–2031
12.4.3. Mexico Slack Wax Market Volume (Kilo Tons) and Value (US$ Bn) Forecast, by Grade, 2020–2031
12.4.4. Mexico Slack Wax Market Volume (Kilo Tons) and Value (US$ Bn) Forecast, by Application, 2020–2031
12.4.5. Rest of Latin America Slack Wax Market Volume (Kilo Tons) and Value (US$ Bn) Forecast, by Grade, 2020–2031
12.4.6. Rest of Latin America Slack Wax Market Volume (Kilo Tons) and Value (US$ Bn) Forecast, by Application, 2020–2031
12.5. Latin America Slack Wax Market Attractiveness Analysis
13. Middle East & Africa Slack Wax Market Analysis and Forecast, 2020–2031
13.1. Key Findings
13.2. Middle East & Africa Slack Wax Market Volume (Kilo Tons) and Value (US$ Bn) Forecast, by Grade, 2020–2031
13.3. Middle East & Africa Slack Wax Market Volume (Kilo Tons) and Value (US$ Bn) Forecast, by Application, 2020–2031
13.4. Middle East & Africa Slack Wax Market Volume (Kilo Tons) and Value (US$ Bn) Forecast, by Country and Sub-region, 2020-2031
13.4.1. GCC Slack Wax Market Volume (Kilo Tons) and Value (US$ Bn) Forecast, by Grade, 2020–2031
13.4.2. GCC Slack Wax Market Volume (Kilo Tons) and Value (US$ Bn) Forecast, by Application, 2020–2031
13.4.3. South Africa Slack Wax Market Volume (Kilo Tons) and Value (US$ Bn) Forecast, by Grade, 2020–2031
13.4.4. South Africa Slack Wax Market Volume (Kilo Tons) and Value (US$ Bn) Forecast, by Application, 2020–2031
13.4.5. Rest of Middle East & Africa Slack Wax Market Volume (Kilo Tons) and Value (US$ Bn) Forecast, by Grade, 2020–2031
13.4.6. Rest of Middle East & Africa Slack Wax Market Volume (Kilo Tons) and Value (US$ Bn) Forecast, by Application, 2020–2031
13.5. Middle East & Africa Slack Wax Market Attractiveness Analysis
14. Competition Landscape
14.1. Global Slack Wax Company Market Share Analysis, 2021
14.2. Company Profiles (Details – Overview, Financials, Recent Developments, and Strategy)
14.2.1. Sasol Limited
14.2.1.1. Company Description
14.2.1.2. Business Overview
14.2.1.3. Financial Overview
14.2.1.4. Strategic Overview
14.2.2. Exxon Mobil Corporation
14.2.2.1. Company Description
14.2.2.2. Business Overview
14.2.2.3. Financial Overview
14.2.2.4. Strategic Overview
14.2.3. Royal Dutch Shell plc
14.2.3.1. Company Description
14.2.3.2. Business Overview
14.2.3.3. Financial Overview
14.2.3.4. Strategic Overview
14.2.4. RAHA Paraffin Company
14.2.4.1. Company Description
14.2.4.2. Business Overview
14.2.4.3. Financial Overview
14.2.4.4. Strategic Overview
14.2.5. Thai Oil Public Company Limited
14.2.5.1. Company Description
14.2.5.2. Business Overview
14.2.5.3. Financial Overview
14.2.5.4. Strategic Overview
14.2.6. IRANOL Oil Co.
14.2.6.1. Company Description
14.2.6.2. Business Overview
14.2.6.3. Financial Overview
14.2.6.4. Strategic Overview
14.2.7. American Refining Group, Inc.
14.2.7.1. Company Description
14.2.7.2. Business Overview
14.2.7.3. Financial Overview
14.2.7.4. Strategic Overview
14.2.8. IRPC Public Company Limited
14.2.8.1. Company Description
14.2.8.2. Business Overview
14.2.8.3. Financial Overview
14.2.8.4. Strategic Overview
14.2.9. Eagle Petrochem Company
14.2.9.1. Company Description
14.2.9.2. Business Overview
14.2.9.3. Financial Overview
14.2.9.4. Strategic Overview
14.2.10. HollyFrontier Corporation
14.2.10.1. Company Description
14.2.10.2. Business Overview
14.2.10.3. Financial Overview
14.2.10.4. Strategic Overview
14.2.11. PT PERTAMINA
14.2.11.1. Company Description
14.2.11.2. Business Overview
14.2.11.3. Financial Overview
14.2.11.4. Strategic Overview
14.2.12. Polwax S.A
14.2.12.1. Company Description
14.2.12.2. Business Overview
14.2.12.3. Financial Overview
14.2.12.4. Strategic Overview
15. Primary Research: Key Insights
16. Appendix
List of Tables
Table 1: Global Slack Wax Market Volume (Kilo Tons) Forecast, by Grade, 2020–2031
Table 2: Global Slack Wax Market Value (US$ Bn) Forecast, by Grade, 2020–2031
Table 3: Global Slack Wax Market Volume (Kilo Tons) Forecast, by Application, 2020–2031
Table 4: Global Slack Wax Market Value (US$ Bn) Forecast, by Application, 2020–2031
Table 5: Global Slack Wax Market Volume (Kilo Tons) Forecast, by Region, 2020–2031
Table 6: Global Slack Wax Market Value (US$ Bn) Forecast, by Region, 2020–2031
Table 7: North America Slack Wax Market Volume (Kilo Tons) Forecast, by Grade, 2020–2031
Table 8: North America Slack Wax Market Value (US$ Bn) Forecast, by Grade, 2020–2031
Table 9: North America Slack Wax Market Volume (Kilo Tons) Forecast, by Application, 2020–2031
Table 10: North America Slack Wax Market Value (US$ Bn) Forecast, by Application, 2020–2031
Table 11: North America Slack Wax Market Volume (Kilo Tons) Forecast, by Country, 2020–2031
Table 12: North America Slack Wax Market Value (US$ Bn) Forecast, by Country, 2020–2031
Table 13: U.S. Slack Wax Market Volume (Kilo Tons) Forecast, by Grade, 2020–2031
Table 14: U.S. Slack Wax Market Value (US$ Bn) Forecast, by Grade, 2020–2031
Table 15: U.S. Slack Wax Market Volume (Kilo Tons) Forecast, by Application, 2020–2031
Table 16: U.S. Slack Wax Market Value (US$ Bn) Forecast, by Application, 2020–2031
Table 17: Canada Slack Wax Market Volume (Kilo Tons) Forecast, by Grade, 2020–2031
Table 18: Canada Slack Wax Market Value (US$ Bn) Forecast, by Grade, 2020–2031
Table 19: Canada Slack Wax Market Volume (Kilo Tons) Forecast, by Application, 2020–2031
Table 20: Canada Slack Wax Market Value (US$ Bn) Forecast, by Application, 2020–2031
Table 21: Europe Slack Wax Market Volume (Kilo Tons) Forecast, by Grade, 2020–2031
Table 22: Europe Slack Wax Market Value (US$ Bn) Forecast, by Grade, 2020–2031
Table 23: Europe Slack Wax Market Volume (Kilo Tons) Forecast, by Application, 2020–2031
Table 24: Europe Slack Wax Market Value (US$ Bn) Forecast, by Application, 2020–2031
Table 25: Europe Slack Wax Market Volume (Kilo Tons) Forecast, by Country and Sub-region, 2020–2031
Table 26: Europe Slack Wax Market Value (US$ Bn) Forecast, by Country and Sub-region, 2020–2031
Table 27: Germany Slack Wax Market Volume (Kilo Tons) Forecast, by Grade, 2020–2031
Table 28: Germany Slack Wax Market Value (US$ Bn) Forecast, by Grade, 2020–2031
Table 29: Germany Slack Wax Market Volume (Kilo Tons) Forecast, by Application, 2020–2031
Table 30: Germany Slack Wax Market Value (US$ Bn) Forecast, by Application, 2020–2031
Table 31: France Slack Wax Market Volume (Kilo Tons) Forecast, by Grade, 2020–2031
Table 32: France Slack Wax Market Value (US$ Bn) Forecast, by Grade, 2020–2031
Table 33: France Slack Wax Market Volume (Kilo Tons) Forecast, by Application, 2020–2031
Table 34: France Slack Wax Market Value (US$ Bn) Forecast, by Application, 2020–2031
Table 35: U.K. Slack Wax Market Volume (Kilo Tons) Forecast, by Grade, 2020–2031
Table 36: U.K. Slack Wax Market Value (US$ Bn) Forecast, by Grade, 2020–2031
Table 37: U.K. Slack Wax Market Volume (Kilo Tons) Forecast, by Application, 2020–2031
Table 38: U.K. Slack Wax Market Value (US$ Bn) Forecast, by Application, 2020–2031
Table 39: Italy Slack Wax Market Volume (Kilo Tons) Forecast, by Grade, 2020–2031
Table 40: Italy Slack Wax Market Value (US$ Bn) Forecast, by Grade, 2020–2031
Table 41: Italy Slack Wax Market Volume (Kilo Tons) Forecast, by Application, 2020–2031
Table 42: Italy Slack Wax Market Value (US$ Bn) Forecast, by Application, 2020–2031
Table 43: Spain Slack Wax Market Volume (Kilo Tons) Forecast, by Grade, 2020–2031
Table 44: Spain Slack Wax Market Value (US$ Bn) Forecast, by Grade, 2020–2031
Table 45: Spain Slack Wax Market Volume (Kilo Tons) Forecast, by Application, 2020–2031
Table 46: Spain Slack Wax Market Volume (Kilo Tons) Forecast, by Application, 2020–2031
Table 47: Russia & CIS Slack Wax Market Volume (Kilo Tons) Forecast, by Grade, 2020–2031
Table 48: Russia & CIS Slack Wax Market Value (US$ Bn) Forecast, by Grade, 2020–2031
Table 49: Russia & CIS Slack Wax Market Volume (Kilo Tons) Forecast, by Application, 2020–2031
Table 50: Russia & CIS Slack Wax Market Value (US$ Bn) Forecast, by Application, 2020–2031
Table 51: Nordic Slack Wax Market Volume (Kilo Tons) Forecast, by Grade, 2020–2031
Table 52: Nordic Slack Wax Market Value (US$ Bn) Forecast, by Grade, 2020–2031
Table 53: Nordic Slack Wax Market Volume (Kilo Tons) Forecast, by Application, 2020–2031
Table 54: Nordic Slack Wax Market Value (US$ Bn) Forecast, by Application, 2020–2031
Table 55: Belgium Slack Wax Market Volume (Kilo Tons) Forecast, by Grade, 2020–2031
Table 56: Belgium Slack Wax Market Value (US$ Bn) Forecast, by Grade, 2020–2031
Table 57: Belgium Slack Wax Market Volume (Kilo Tons) Forecast, by Application, 2020–2031
Table 58: Belgium Slack Wax Market Value (US$ Bn) Forecast, by Application, 2020–2031
Table 59: Netherland Slack Wax Market Volume (Kilo Tons) Forecast, by Grade, 2020–2031
Table 60: Netherland Slack Wax Market Value (US$ Bn) Forecast, by Grade, 2020–2031
Table 61: Netherland Slack Wax Market Volume (Kilo Tons) Forecast, by Application, 2020–2031
Table 62: Netherland Slack Wax Market Value (US$ Bn) Forecast, by Application, 2020–2031
Table 63: Luxembourg Slack Wax Market Volume (Kilo Tons) Forecast, by Grade, 2020–2031
Table 64: Luxembourg Slack Wax Market Value (US$ Bn) Forecast, by Grade, 2020–2031
Table 65: Luxembourg Slack Wax Market Volume (Kilo Tons) Forecast, by Application, 2020–2031
Table 66: Luxembourg Slack Wax Market Value (US$ Bn) Forecast, by Application, 2020–2031
Table 67: Poland Slack Wax Market Volume (Kilo Tons) Forecast, by Grade, 2020–2031
Table 68: Poland Slack Wax Market Value (US$ Bn) Forecast, by Grade, 2020–2031
Table 69: Poland Slack Wax Market Volume (Kilo Tons) Forecast, by Application, 2020–2031
Table 70: Poland Slack Wax Market Value (US$ Bn) Forecast, by Application, 2020–2031
Table 71: Rest of Europe Slack Wax Market Volume (Kilo Tons) Forecast, by Grade, 2020–2031
Table 72: Rest of Europe Slack Wax Market Value (US$ Bn) Forecast, by Grade, 2020–2031
Table 73: Rest of Europe Slack Wax Market Volume (Kilo Tons) Forecast, by Application, 2020–2031
Table 74: Rest of Europe Slack Wax Market Value (US$ Bn) Forecast, by Application, 2020–2031
Table 75: Asia Pacific Slack Wax Market Volume (Kilo Tons) Forecast, by Grade, 2020–2031
Table 76: Asia Pacific Slack Wax Market Value (US$ Bn) Forecast, by Grade, 2020–2031
Table 77: Asia Pacific Slack Wax Market Volume (Kilo Tons) Forecast, by Application, 2020–2031
Table 78: Asia Pacific Slack Wax Market Value (US$ Bn) Forecast, by Application, 2020–2031
Table 79: Asia Pacific Slack Wax Market Volume (Kilo Tons) Forecast, by Country and Sub-region, 2020–2031
Table 80: Asia Pacific Slack Wax Market Value (US$ Bn) Forecast, by Country and Sub-region, 2020–2031
Table 81: China Slack Wax Market Volume (Kilo Tons) Forecast, by Grade, 2020–2031
Table 82: China Slack Wax Market Value (US$ Bn) Forecast, by Grade, 2020–2031
Table 83: China Slack Wax Market Volume (Kilo Tons) Forecast, by Application, 2020–2031
Table 84: China Slack Wax Market Value (US$ Bn) Forecast, by Application, 2020–2031
Table 85: Japan Slack Wax Market Volume (Kilo Tons) Forecast, by Grade, 2020–2031
Table 86: Japan Slack Wax Market Value (US$ Bn) Forecast, by Grade, 2020–2031
Table 87: Japan Slack Wax Market Volume (Kilo Tons) Forecast, by Application, 2020–2031
Table 88: Japan Slack Wax Market Value (US$ Bn) Forecast, by Application, 2020–2031
Table 89: India Slack Wax Market Volume (Kilo Tons) Forecast, by Grade, 2020–2031
Table 90: India Slack Wax Market Value (US$ Bn) Forecast, by Grade, 2020–2031
Table 91: India Slack Wax Market Volume (Kilo Tons) Forecast, by Application, 2020–2031
Table 92: India Slack Wax Market Value (US$ Bn) Forecast, by Application, 2020–2031
Table 93: South Korea Slack Wax Market Volume (Kilo Tons) Forecast, by Grade, 2020–2031
Table 94: South Korea Slack Wax Market Value (US$ Bn) Forecast, by Grade, 2020–2031
Table 95: South Korea Slack Wax Market Volume (Kilo Tons) Forecast, by Application, 2020–2031
Table 96: South Korea Slack Wax Market Value (US$ Bn) Forecast, by Application, 2020–2031
Table 97: Australia Slack Wax Market Volume (Kilo Tons) Forecast, by Grade, 2020–2031
Table 98: Australia Slack Wax Market Value (US$ Bn) Forecast, by Grade, 2020–2031
Table 99: Australia Slack Wax Market Volume (Kilo Tons) Forecast, by Application, 2020–2031
Table 100: Australia Slack Wax Market Value (US$ Bn) Forecast, by Application, 2020–2031
Table 101: ASEAN Slack Wax Market Volume (Kilo Tons) Forecast, by Grade, 2020–2031
Table 102: ASEAN Slack Wax Market Value (US$ Bn) Forecast, by Grade, 2020–2031
Table 103: ASEAN Slack Wax Market Volume (Kilo Tons) Forecast, by Application, 2020–2031
Table 104: ASEAN Slack Wax Market Value (US$ Bn) Forecast, by Application, 2020–2031
Table 105: Rest of Asia Pacific Slack Wax Market Volume (Kilo Tons) Forecast, by Grade, 2020–2031
Table 106: Rest of Asia Pacific Slack Wax Market Value (US$ Bn) Forecast, by Grade, 2020–2031
Table 107: Rest of Asia Pacific Slack Wax Market Volume (Kilo Tons) Forecast, by Application, 2020–2031
Table 108: Rest of Asia Pacific Slack Wax Market Value (US$ Bn) Forecast, by Application, 2020–2031
Table 109: Latin America Slack Wax Market Volume (Kilo Tons) Forecast, by Grade, 2020–2031
Table 110: Latin America Slack Wax Market Value (US$ Bn) Forecast, by Grade, 2020–2031
Table 111: Latin America Slack Wax Market Volume (Kilo Tons) Forecast, by Application, 2020–2031
Table 112: Latin America Slack Wax Market Value (US$ Bn) Forecast, by Application, 2020–2031
Table 113: Latin America Slack Wax Market Volume (Kilo Tons) Forecast, by Country and Sub-region, 2020–2031
Table 114: Latin America Slack Wax Market Value (US$ Bn) Forecast, by Country and Sub-region, 2020–2031
Table 115: Brazil Slack Wax Market Volume (Kilo Tons) Forecast, by Grade, 2020–2031
Table 116: Brazil Slack Wax Market Value (US$ Bn) Forecast, by Grade, 2020–2031
Table 117: Brazil Slack Wax Market Volume (Kilo Tons) Forecast, by Application, 2020–2031
Table 118: Brazil Slack Wax Market Value (US$ Bn) Forecast, by Application, 2020–2031
Table 119: Mexico Slack Wax Market Volume (Kilo Tons) Forecast, by Grade, 2020–2031
Table 120: Mexico Slack Wax Market Value (US$ Bn) Forecast, by Grade, 2020–2031
Table 121: Mexico Slack Wax Market Volume (Kilo Tons) Forecast, by Application, 2020–2031
Table 122: Mexico Slack Wax Market Value (US$ Bn) Forecast, by Application, 2020–2031
Table 123: Rest of Latin America Slack Wax Market Volume (Kilo Tons) Forecast, by Grade, 2020–2031
Table 124: Rest of Latin America Slack Wax Market Value (US$ Bn) Forecast, by Grade, 2020–2031
Table 125: Rest of Latin America Slack Wax Market Volume (Kilo Tons) Forecast, by Application, 2020–2031
Table 126: Rest of Latin America Slack Wax Market Value (US$ Bn) Forecast, by Application, 2020–2031
Table 127: Middle East & Africa Slack Wax Market Volume (Kilo Tons) Forecast, by Grade, 2020–2031
Table 128: Middle East & Africa Slack Wax Market Value (US$ Bn) Forecast, by Grade, 2020–2031
Table 129: Middle East & Africa Slack Wax Market Volume (Kilo Tons) Forecast, by Application, 2020–2031
Table 130: Middle East & Africa Slack Wax Market Value (US$ Bn) Forecast, by Application, 2020–2031
Table 131: Middle East & Africa Slack Wax Market Volume (Kilo Tons) Forecast, by Country and Sub-region, 2020–2031
Table 132: Middle East & Africa Slack Wax Market Value (US$ Bn) Forecast, by Country and Sub-region, 2020–2031
Table 133: GCC Slack Wax Market Volume (Kilo Tons) Forecast, by Grade, 2020–2031
Table 134: GCC Slack Wax Market Value (US$ Bn) Forecast, by Grade, 2020–2031
Table 135: GCC Slack Wax Market Volume (Kilo Tons) Forecast, by Application, 2020–2031
Table 136: GCC Slack Wax Market Value (US$ Bn) Forecast, by Application, 2020–2031
Table 137: South Africa Slack Wax Market Volume (Kilo Tons) Forecast, by Grade, 2020–2031
Table 138: South Africa Slack Wax Market Value (US$ Bn) Forecast, by Grade, 2020–2031
Table 139: South Africa Slack Wax Market Volume (Kilo Tons) Forecast, by Application, 2020–2031
Table 140: South Africa Slack Wax Market Value (US$ Bn) Forecast, by Application, 2020–2031
Table 141: Rest of Middle East & Africa Slack Wax Market Volume (Kilo Tons) Forecast, by Grade, 2020–2031
Table 142: Rest of Middle East & Africa Slack Wax Market Value (US$ Bn) Forecast, by Grade, 2020–2031
Table 143: Rest of Middle East & Africa Slack Wax Market Volume (Kilo Tons) Forecast, by Application, 2020–2031
Table 144: Rest of Middle East & Africa Slack Wax Market Value (US$ Bn) Forecast, by Application, 2020–2031
List of Figures
Figure 1: Global Slack Wax Market Volume Share Analysis, by Grade, 2020, 2025, and 2031
Figure 2: Global Slack Wax Market Attractiveness, by Grade
Figure 3: Global Slack Wax Market Volume Share Analysis, by Application, 2020, 2025, and 2031
Figure 4: Global Slack Wax Market Attractiveness, by Application
Figure 5: Global Slack Wax Market Volume Share Analysis, by Region, 2020, 2025, and 2031
Figure 6: Global Slack Wax Market Attractiveness, by Region
Figure 7: North America Slack Wax Market Volume Share Analysis, by Grade, 2020, 2025, and 2031
Figure 8: North America Slack Wax Market Attractiveness, by Grade
Figure 9: North America Slack Wax Market Volume Share Analysis, by Application, 2020, 2025, and 2031
Figure 10: North America Slack Wax Market Attractiveness, by Application
Figure 11: North America Slack Wax Market Attractiveness, by Country
Figure 12: Europe Slack Wax Market Volume Share Analysis, by Grade, 2020, 2025, and 2031
Figure 13: Europe Slack Wax Market Attractiveness, by Grade
Figure 14: Europe Slack Wax Market Volume Share Analysis, by Application, 2020, 2025, and 2031
Figure 15: Europe Slack Wax Market Attractiveness, by Application
Figure 16: Europe Slack Wax Market Volume Share Analysis, by Country and Sub-region, 2020, 2025, and 2031
Figure 17: Europe Slack Wax Market Attractiveness, by Country and Sub-region
Figure 18: Asia Pacific Slack Wax Market Volume Share Analysis, by Grade, 2020, 2025, and 2031
Figure 19: Asia Pacific Slack Wax Market Attractiveness, by Grade
Figure 20: Asia Pacific Slack Wax Market Volume Share Analysis, by Application, 2020, 2025, and 2031
Figure 21: Asia Pacific Slack Wax Market Attractiveness, by Application
Figure 22: Asia Pacific Slack Wax Market Volume Share Analysis, by Country and Sub-region, 2020, 2025, and 2031
Figure 23: Asia Pacific Slack Wax Market Attractiveness, by Country and Sub-region
Figure 24: Latin America Slack Wax Market Volume Share Analysis, by Grade, 2020, 2025, and 2031
Figure 25: Latin America Slack Wax Market Attractiveness, by Grade
Figure 26: Latin America Slack Wax Market Volume Share Analysis, by Application, 2020, 2025, and 2031
Figure 27: Latin America Slack Wax Market Attractiveness, by Application
Figure 28: Latin America Slack Wax Market Volume Share Analysis, by Country and Sub-region, 2020, 2025, and 2031
Figure 29: Latin America Slack Wax Market Attractiveness, by Country and Sub-region
Figure 30: Middle East & Africa Slack Wax Market Volume Share Analysis, by Grade, 2020, 2025, and 2031
Figure 31: Middle East & Africa Slack Wax Market Attractiveness, by Grade
Figure 32: Middle East & Africa Slack Wax Market Volume Share Analysis, by Application, 2020, 2025, and 2031
Figure 33: Middle East & Africa Slack Wax Market Attractiveness, by Application
Figure 34: Middle East & Africa Slack Wax Market Volume Share Analysis, by Country and Sub-region, 2020, 2025, and 2031
Figure 35: Middle East & Africa Slack Wax Market Attractiveness, by Country and Sub-region
Copyright © Transparency Market Research, Inc. All Rights reserved
Trust Online

Slack Wax Market