
Reports
Reports
Analysts’ Viewpoint on SIP Trunking Services Market Scenario
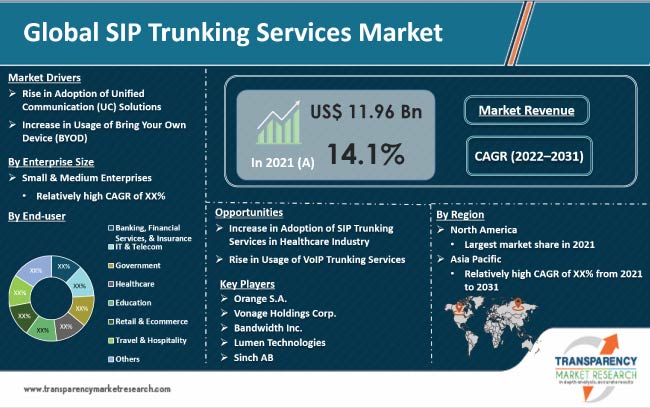
Increase in adoption of VoIP services and decrease in telephony costs are driving the SIP trunking services market. SIP trunking services help reduce the total cost of ownership by bringing capital expenditure to a minimal level. They also eliminate the necessity to invest in PSTN gateway capacity across enterprises. Rise in need for long-distance and international calls is expected to drive the SIP trunking services market during the forecast period. VoIP trunking services are gaining traction across the globe, as VoIP rates are lesser than that of Time-division Multiplexing (TDM). Businesses are emphasizing on the adoption of cloud/virtual PBX systems to reduce operational costs. SIP trunk providers are launching fully localized cloud communication solutions to increase their regional presence.
Session Initiation Protocol trunking services use Voice over Internet Protocol (VoIP) or Public Switched Telephone Network (PSTN) to connect a Private Branch Exchange (PBX) to the Internet. This allows businesses to connect with both fixed and mobile telephone subscribers. SIP trunking services enable the transmission of data and voice services over VoIP and PSTN lines. VoIP providers offer businesses a modern, affordable, and more versatile alternative to traditional landline connections. VoIP telephone systems facilitate high-quality and reliable business calls. Organizations use business SIP trunking to boost worker mobility and productivity, customer communication, security, and business expansion.
Organizations are increasingly employing mobile technologies and reducing their dependence on desktop-to-desktop communication. This is driving the adoption of robust communication platforms such as Unified Communications-as-a-Service (UCaaS), which offers a wide range of cloud collaboration and communication services and applications. The three main capacity areas covered by UCaaS are audio and video conferencing, VoIP, and instant messaging/chat.
A solid foundation for UC suites is formed when an organization deploys SIP trunking in its various locations. Addition of certain UC elements does not interrupt workflows or reduce productivity, as employees are already familiar with VoIP and all the other functions offered. UC helps streamline and improve the workforce, and promotes higher levels of performance and productivity. Studies have demonstrated that staff using a UC solution can save up to 191 hours of organization-wide productivity per day.
Organizations are actively promoting BYOD in workplaces to reduce their hardware and service costs. Rise in popularity of the cloud and widespread usage of IoT have added to the BYOD trend in the workplace. Increase in usage of smartphones and personal laptops calls for robust communication platforms to facilitate greater mobility and flexibility in the organization. Configuring users' personal devices with a smartphone registered with the organization's SIP trunk account provides a dedicated voice connection for business purposes. Users can rely on a cellular data connection or Wi-Fi (often free) to make and receive calls. The usage is automatically billed to the organization's account. Users can make better use of their existing UC platform, as enterprise SIP trunking is the key to connecting unified communications to the global telephone network.
North America dominated the global SIP trunking services market in 2021, led by the extensive usage of SIP trunking services to cater to new SIP standards in the region. Increase in adoption of cloud-based solutions and SIP trunking services in large enterprises is anticipated to fuel the market in the region during the forecast period.
Europe follows North America in terms of revenue share. Enterprises in Europe are promoting digital transformation to achieve top-line growth. This is expected to propel the demand for SIP trunking services in the region. The SIP trunking services market in Asia Pacific is expected to grow significantly during the forecast period, due to the expansion of the small and medium enterprises sector.
The SIP trunking services market in Middle East & Africa is primarily driven by emphasis of owners and workers on attaining high-quality process outcomes, low overheads or expenses, and reduced work timeliness. Business SIP trunking service providers are striving to enhance their product coverage across Middle East & Africa to boost their revenue streams.
The global SIP trunking services market is consolidated, with a few large-scale vendors controlling majority of the share. Investments in R&D activities are expected to increase SIP trunking providers’ market share. Expansion of product portfolios and mergers & acquisitions are key strategies adopted by prominent players operating in the market. 8x8, Inc., Avoxi, Bandwidth, Inc., Colt Technology Services, DID Logic, DIDWW Ireland Limited, Flowroute (a part of Intrado), Inteliquent, Lumen Technologies, MessageBird B.V., Net2Phone, Inc., Orange S.A., Plivo Inc., RingCentral, Inc., Sinch AB, SIPSRUS, Tata Communication, Telkom SA, Telstra Corporation Limited, Twilio, Inc., VoIP Innovations, and Vonage Holdings Corp. are some of the best SIP trunking service providers across the globe.
Each of these players has been profiled in the SIP trunking services market report based on parameters such as company overview, financial overview, business strategies, product portfolio, business segments, and recent developments.
|
Attribute |
Detail |
|
Market Size (Value) in 2021 |
US$ 11.96 Bn |
|
Market Forecast Value in 2031 |
US$ 43.74 Bn |
|
Growth Rate (CAGR) |
14.1% |
|
Forecast Period |
2022-2031 |
|
Historical Data Available |
2017-2020 |
|
Quantitative Units |
US$ Bn for Value |
|
Market Analysis |
Includes cross-segment analysis at global as well as regional level. Furthermore, qualitative analysis includes drivers, restraints, opportunities, key trends, Porter’s Five Forces analysis, value chain analysis, and key trend analysis. |
|
Competition Landscape |
|
|
Format |
Electronic (PDF) + Excel |
|
Market Segmentation |
|
|
Regions Covered |
|
|
Countries Covered |
|
|
Companies Profiled |
|
|
Customization Scope |
Available upon request |
|
Pricing |
Available upon request |
The global SIP trunking services market size is expected to reach US$ 43.74 Bn by 2031
The global SIP trunking services market is estimated to advance at a CAGR of 14.1% during the forecast period
Rise in adoption of unified communication solutions and increase in usage of Bring Your Own Device (BYOD)
North America is a more attractive region for vendors in the global SIP trunking services market
8x8, Inc., Avoxi, Bandwidth, Inc., Colt Technology Services, DID Logic, DIDWW Ireland Limited, Flowroute (a part of Intrado), Inteliquent, Lumen Technologies, MessageBird B.V., Net2Phone, Inc., Orange S.A., Plivo Inc., RingCentral, Inc., Sinch AB, SIPSRUS, Tata Communication, Telkom SA, Telstra Corporation Limited, Twilio, Inc., VoIP Innovations, and Vonage Holdings Corp.
1. Preface
1.1. Market Introduction
1.2. Market Segmentation
1.3. Key Research Objectives
2. Assumptions and Research Methodology
2.1. Research Methodology
2.1.1. List of Primary and Secondary Sources
2.2. Key Assumptions for Data Modelling
3. Executive Summary - Global SIP Trunking Services Market
4. Market Overview
4.1. Market Definition
4.2. Technology/ Product Roadmap
4.3. Market Factor Analysis
4.3.1. Forecast Factors
4.3.2. Ecosystem/ Value Chain Analysis
4.3.3. Market Dynamics (Growth Influencers)
4.3.3.1. Drivers
4.3.3.2. Restraints
4.3.3.3. Opportunities
4.3.3.4. Impact Analysis of Drivers and Restraints
4.4. COVID-19 Impact Analysis
4.4.1. End-user Sentiment Analysis: Comparative Analysis on Spending
4.4.1.1. Increase in Spending
4.4.1.2. Decrease in Spending
4.4.2. Short Term and Long Term Impact on the Market
4.5. Market Opportunity Assessment – by Region (North America/ Europe/ Asia Pacific/ Middle East & Africa/ South America)
4.5.1. By Enterprise Size
4.5.2. By End-user
4.6. Competitive Scenario and Trends
4.6.1. List of Emerging, Prominent and Leading Players
4.6.2. Mergers & Acquisitions, Expansions
5. Global SIP Trunking Services Market Analysis and Forecast
5.1. Market Revenue Analysis (US$ Mn), 2016-2031
5.1.1. Historic Growth Trends, 2016-2020
5.1.2. Forecast Trends, 2022-2031
5.2. Pricing Model Analysis
6. Global SIP Trunking Services Market Analysis, by Enterprise Size
6.1. Overview and Definitions
6.2. Key Segment Analysis
6.3. SIP Trunking Services Market Size (US$ Mn) Forecast, by Enterprise Size, 2018 - 2031
6.3.1. Small & Medium Enterprises
6.3.2. Large Enterprises
7. Global SIP Trunking Services Market Analysis, by End-user
7.1. Key Segment Analysis
7.2. SIP Trunking Services Market Size (US$ Mn) Forecast, by End-user, 2018 - 2031
7.2.1. Banking, Financial Services, & Insurance
7.2.2. IT & Telecom
7.2.3. Government
7.2.4. Healthcare
7.2.5. Education
7.2.6. Retail & Ecommerce
7.2.7. Travel & Hospitality
7.2.8. Others
8. Global SIP Trunking Services Market Analysis and Forecast, By Region
8.1. Key Findings
8.2. SIP Trunking Services Market Size (US$ Mn) Forecast, by Region, 2018 - 2031
8.2.1. North America
8.2.2. Europe
8.2.3. Asia Pacific
8.2.4. Middle East & Africa
8.2.5. South America
9. North America SIP Trunking Services Market Analysis
9.1. Regional Outlook
9.2. SIP Trunking Services Market Size (US$ Mn) Analysis and Forecast (2018 - 2031)
9.2.1. By Enterprise Size
9.2.2. By End-user
9.3. SIP Trunking Services Market Size (US$ Mn) Forecast, by Country, 2018 - 2031
9.3.1. U.S.
9.3.2. Canada
9.3.3. Mexico
10. Europe SIP Trunking Services Market Analysis and Forecast
10.1. Regional Outlook
10.2. SIP Trunking Services Market Size (US$ Mn) Analysis and Forecast (2018 - 2031)
10.2.1. By Enterprise Size
10.2.2. By End-user
10.3. SIP Trunking Services Market Size (US$ Mn) Forecast, by Country & Sub-region, 2018 - 2031
10.3.1. Germany
10.3.2. U.K.
10.3.3. France
10.3.4. Spain
10.3.5. Rest of Europe
11. Asia Pacific SIP Trunking Services Market Analysis and Forecast
11.1. Regional Outlook
11.2. SIP Trunking Services Market Size (US$ Mn) Analysis and Forecast (2018 - 2031)
11.2.1. By Enterprise Size
11.2.2. By End-user
11.3. SIP Trunking Services Market Size (US$ Mn) Forecast, by Country & Sub-region, 2018 - 2031
11.3.1. China
11.3.2. India
11.3.3. Japan
11.3.4. ASEAN
11.3.5. Rest of Asia Pacific
12. Middle East & Africa SIP Trunking Services Market Analysis and Forecast
12.1. Regional Outlook
12.2. SIP Trunking Services Market Size (US$ Mn) Analysis and Forecast (2018 - 2031)
12.2.1. By Enterprise Size
12.2.2. By End-user
12.3. SIP Trunking Services Market Size (US$ Mn) Forecast, by Country & Sub-region, 2018 - 2031
12.3.1. Saudi Arabia
12.3.2. The United Arab Emirates
12.3.3. South Africa
12.3.4. Rest of Middle East & Africa
13. South America SIP Trunking Services Market Analysis and Forecast
13.1. Regional Outlook
13.2. SIP Trunking Services Market Size (US$ Mn) Analysis and Forecast (2018 - 2031)
13.2.1. By Enterprise Size
13.2.2. By End-user
13.3. SIP Trunking Services Market Size (US$ Mn) Forecast, by Country & Sub-region, 2018 - 2031
13.3.1. Brazil
13.3.2. Argentina
13.3.3. Rest of South America
14. Competition Landscape
14.1. Market Competition Matrix, by Leading Players
14.2. Market Revenue Share Analysis (%), by Leading Players (2020)
14.3. SWOT Analysis, by Leading Players
15. Company Profiles
15.1. 8x8, Inc.
15.1.1. Business Overview
15.1.2. Product Portfolio
15.1.3. Geographical Footprint
15.1.4. Revenue and Strategy
15.2. Avoxi
15.2.1. Business Overview
15.2.2. Product Portfolio
15.2.3. Geographical Footprint
15.2.4. Revenue and Strategy
15.3. Bandwidth, Inc.
15.3.1. Business Overview
15.3.2. Product Portfolio
15.3.3. Geographical Footprint
15.3.4. Revenue and Strategy
15.4. Colt Technology Services
15.4.1. Business Overview
15.4.2. Product Portfolio
15.4.3. Geographical Footprint
15.4.4. Revenue and Strategy
15.5. DID Logic
15.5.1. Business Overview
15.5.2. Product Portfolio
15.5.3. Geographical Footprint
15.5.4. Revenue and Strategy
15.6. DIDWW Ireland Limited
15.6.1. Business Overview
15.6.2. Product Portfolio
15.6.3. Geographical Footprint
15.6.4. Revenue and Strategy
15.7. Flowroute (part of Intrado)
15.7.1. Business Overview
15.7.2. Product Portfolio
15.7.3. Geographical Footprint
15.7.4. Revenue and Strategy
15.8. Inteliquent
15.8.1. Business Overview
15.8.2. Product Portfolio
15.8.3. Geographical Footprint
15.8.4. Revenue and Strategy
15.9. Lumen Technologies
15.9.1. Business Overview
15.9.2. Product Portfolio
15.9.3. Geographical Footprint
15.9.4. Revenue and Strategy
15.10. MessageBird B.V.
15.10.1. Business Overview
15.10.2. Product Portfolio
15.10.3. Geographical Footprint
15.10.4. Revenue and Strategy
15.11. Net2Phone, Inc.
15.11.1. Business Overview
15.11.2. Product Portfolio
15.11.3. Geographical Footprint
15.11.4. Revenue and Strategy
15.12. Orange S.A.
15.12.1. Business Overview
15.12.2. Product Portfolio
15.12.3. Geographical Footprint
15.12.4. Revenue and Strategy
15.13. Plivo Inc.
15.13.1. Business Overview
15.13.2. Product Portfolio
15.13.3. Geographical Footprint
15.13.4. Revenue and Strategy
15.14. RingCentral, Inc.
15.14.1. Business Overview
15.14.2. Product Portfolio
15.14.3. Geographical Footprint
15.14.4. Revenue and Strategy
15.15. Sinch AB
15.15.1. Business Overview
15.15.2. Product Portfolio
15.15.3. Geographical Footprint
15.15.4. Revenue and Strategy
15.16. SIPSRUS
15.16.1. Business Overview
15.16.2. Product Portfolio
15.16.3. Geographical Footprint
15.16.4. Revenue and Strategy
15.17. Tata Communication
15.17.1. Business Overview
15.17.2. Product Portfolio
15.17.3. Geographical Footprint
15.17.4. Revenue and Strategy
15.18. Telkom SA
15.18.1. Business Overview
15.18.2. Product Portfolio
15.18.3. Geographical Footprint
15.18.4. Revenue and Strategy
15.19. Telstra Corporation Limited
15.19.1. Business Overview
15.19.2. Product Portfolio
15.19.3. Geographical Footprint
15.19.4. Revenue and Strategy
15.20. Twilio Inc.
15.20.1. Business Overview
15.20.2. Product Portfolio
15.20.3. Geographical Footprint
15.20.4. Revenue and Strategy
15.21. VoIP Innovations
15.21.1. Business Overview
15.21.2. Product Portfolio
15.21.3. Geographical Footprint
15.21.4. Revenue and Strategy
15.22. Vonage Holdings Corp.
15.22.1. Business Overview
15.22.2. Product Portfolio
15.22.3. Geographical Footprint
15.22.4. Revenue and Strategy
16. Key Takeaways
List of Tables
Table 1: Acronyms Used in the SIP Trunking Services Market
Table 2: North America SIP Trunking Services Market Revenue Analysis, by Country, 2022 - 2031 (US$ Mn)
Table 3: Europe SIP Trunking Services Market Revenue Analysis, by Country, 2022 - 2031 (US$ Mn)
Table 4: Asia Pacific SIP Trunking Services Market Revenue Analysis, by Country, 2022 - 2031 (US$ Mn)
Table 5: Middle East & Africa SIP Trunking Services Market Revenue Analysis, by Country, 2022 and 2031 (US$ Mn)
Table 6: South America SIP Trunking Services Market Revenue Analysis, by Country, 2022 - 2031 (US$ Mn)
Table 7: Forecast Factors: Relevance and Impact
Table 8: Impact Analysis of Drivers & Restraints
Table 9: Mergers & Acquisitions, Partnerships (1/2)
Table 10: Mergers & Acquisitions, Partnership (2/2)
Table 11: Global SIP Trunking Services Market Value (US$ Mn) Forecast, by Enterprise Size, 2018 – 2031
Table 12: Global SIP Trunking Services Market Value (US$ Mn) Forecast, by End-user, 2018 – 2031
Table 13: Global SIP Trunking Services Market Volume (US$ Mn) Forecast, by Region, 2018 - 2031
Table 14: North America SIP Trunking Services Market Value (US$ Mn) Forecast, by Enterprise Size, 2018 – 2031
Table 15: North America SIP Trunking Services Market Value (US$ Mn) Forecast, by End-user, 2018 – 2031
Table 16: North America SIP Trunking Services Market Value (US$ Mn) Forecast, by Country, 2018 - 2031
Table 17: U.S. SIP Trunking Services Market Revenue CAGR Breakdown (%), by Growth Term
Table 20: Europe SIP Trunking Services Market Value (US$ Mn) Forecast, by Enterprise Size, 2018 – 2031
Table 21: Europe SIP Trunking Services Market Value (US$ Mn) Forecast, by End-user, 2018 – 2031
Table 22: Europe SIP Trunking Services Market Value (US$ Mn) Forecast, by Country, 2018 - 2031
Table 23: Germany SIP Trunking Services Market Revenue CAGR Breakdown (%), by Growth Term
Table 24: U.K. SIP Trunking Services Market Revenue CAGR Breakdown (%), by Growth Term
Table 25: France SIP Trunking Services Market Revenue CAGR Breakdown (%), by Growth Term
Table 26: Spain SIP Trunking Services Market Revenue CAGR Breakdown (%), by Growth Term
Table 27: Asia Pacific SIP Trunking Services Market Value (US$ Mn) Forecast, by Enterprise Size, 2018 – 2031
Table 28: Asia Pacific SIP Trunking Services Market Value (US$ Mn) Forecast, by End-user, 2018 – 2031
Table 29: Asia Pacific SIP Trunking Services Market Value (US$ Mn) Forecast, by Country, 2018 - 2031
Table 30: China SIP Trunking Services Market Revenue CAGR Breakdown (%), by Growth Term
Table 31: India SIP Trunking Services Market Revenue CAGR Breakdown (%), by Growth Term
Table 32: Japan SIP Trunking Services Market Revenue CAGR Breakdown (%), by Growth Term
Table 33: ASEAN SIP Trunking Services Market Revenue CAGR Breakdown (%), by Growth Term
Table 34: Middle East & Africa SIP Trunking Services Market Value (US$ Mn) Forecast, by Enterprise Size, 2018 – 2031
Table 35: Middle East & Africa SIP Trunking Services Market Value (US$ Mn) Forecast, by End-user, 2018 – 2031
Table 36: Middle East & Africa SIP Trunking Services Market Value (US$ Mn) Forecast, by Country, 2018 - 2031
Table 37: Saudi Arabia SIP Trunking Services Market Revenue CAGR Breakdown (%), by Growth Term
Table 38: The United Arab Emirates SIP Trunking Services Market Revenue CAGR Breakdown (%), by Growth Term
Table 39: South Africa SIP Trunking Services Market Revenue CAGR Breakdown (%), by Growth Term
Table 40: South America SIP Trunking Services Market Value (US$ Mn) Forecast, by Enterprise Size, 2018 – 2031
Table 41: South America SIP Trunking Services Market Value (US$ Mn) Forecast, by End-user, 2018 – 2031
Table 42: South America SIP Trunking Services Market Value (US$ Mn) Forecast, by Country, 2018 - 2031
Table 43: Brazil SIP Trunking Services Market Revenue CAGR Breakdown (%), by Growth Term
Table 44: Argentina SIP Trunking Services Market Revenue CAGR Breakdown (%), by Growth Term
List of Figures
Figure 1: Global SIP Trunking Services Market Size (US$ Mn) Forecast, 2018–2031
Figure 2: Global SIP Trunking Services Market Revenue (US$ Mn) Opportunity Assessment, by Region, 2022E
Figure 3: Top Segment Analysis of SIP Trunking Services Market
Figure 4: Global SIP Trunking Services Market Revenue (US$ Mn) Opportunity Assessment, by Region, 2031F
Figure 5: Performance Of Key Global SIP Trunking Players Vs S&P 500 During COVID-19
Figure 6: Global SIP Trunking Services Market Attractiveness Assessment, by Enterprise Size
Figure 7: Global SIP Trunking Services Market Attractiveness Assessment, by End-user
Figure 8: Global SIP Trunking Services Market Attractiveness Assessment, by Region
Figure 9: Global SIP Trunking Services Market Revenue (US$ Mn) Historic Trends, 2016 - 2021
Figure 10: Global SIP Trunking Services Market Revenue Opportunity (US$ Mn) Historic Trends, 2016 - 2021
Figure 11: Global SIP Trunking Services Market Value Share Analysis, by Enterprise Size, 2022
Figure 12: Global SIP Trunking Services Market Value Share Analysis, by Enterprise Size, 2031
Figure 13: Global SIP Trunking Services Market Absolute Opportunity (US$ Mn), by Small & Medium Enterprises, 2022 – 2031
Figure 14: Global SIP Trunking Services Market Absolute Opportunity (US$ Mn), by Large Enterprises, 2022 – 2031
Figure 15: Global SIP Trunking Services Market Value Share Analysis, by End-user, 2022
Figure 16: Global SIP Trunking Services Market Value Share Analysis, by End-user, 2031
Figure 17: Global SIP Trunking Services Market Absolute Opportunity (US$ Mn), by Banking, Financial Services, & Insurance, 2022 – 2031
Figure 18: Global SIP Trunking Services Market Absolute Opportunity (US$ Mn), by IT & Telecom, 2022 – 2031
Figure 19: Global SIP Trunking Services Market Absolute Opportunity (US$ Mn), by Government, 2022 – 2031
Figure 20: Global SIP Trunking Services Market Absolute Opportunity (US$ Mn), by Healthcare, 2022 – 2031
Figure 21: Global SIP Trunking Services Market Absolute Opportunity (US$ Mn), by Education, 2022 – 2031
Figure 22: Global SIP Trunking Services Market Absolute Opportunity (US$ Mn), by Retail & Ecommerce, 2022 – 2031
Figure 23: Global SIP Trunking Services Market Absolute Opportunity (US$ Mn), by Travel & Hospitality, 2022 – 2031
Figure 24: Global SIP Trunking Services Market Absolute Opportunity (US$ Mn), by Others, 2022 – 2031
Figure 25: Global SIP Trunking Services Market Opportunity (US$ Mn), by Region
Figure 26: Global SIP Trunking Services Market Opportunity Share (%), by Region, 2022–2031
Figure 27: Global SIP Trunking Services Market Size (US$ Mn), by Region, 2022 & 2031
Figure 28: Global SIP Trunking Services Market Value Share Analysis, by Region, 2022
Figure 29: Global SIP Trunking Services Market Value Share Analysis, by Region, 2031
Figure 30: North America SIP Trunking Services Market Absolute Opportunity (US$ Mn), 2022 – 2031
Figure 31: Europe SIP Trunking Services Market Absolute Opportunity (US$ Mn), 2022 – 2031
Figure 32: Asia Pacific SIP Trunking Services Market Absolute Opportunity (US$ Mn), 2022 – 2031
Figure 33: Middle East & Africa SIP Trunking Services Market Absolute Opportunity (US$ Mn), 2022 – 2031
Figure 34: South America SIP Trunking Services Market Absolute Opportunity (US$ Mn), 2022 – 2031
Figure 35: North America SIP Trunking Services Revenue Opportunity Share, by Enterprise Size
Figure 36: North America SIP Trunking Services Revenue Opportunity Share, by End-user
Figure 37: North America SIP Trunking Services Revenue Opportunity Share, by Country
Figure 38: North America SIP Trunking Services Market Value Share Analysis, by Enterprise Size, 2022
Figure 39: North America SIP Trunking Services Market Value Share Analysis, by Enterprise Size, 2031
Figure 40: North America SIP Trunking Services Market Absolute Opportunity (US$ Mn), by Small & Medium Enterprises, 2022 – 2031
Figure 41: North America SIP Trunking Services Market Absolute Opportunity (US$ Mn), by Large Enterprises, 2022 – 2031
Figure 42: North America SIP Trunking Services Market Value Share Analysis, by End-user, 2022
Figure 43: North America SIP Trunking Services Market Value Share Analysis, by End-user, 2031
Figure 44: North America SIP Trunking Services Market Absolute Opportunity (US$ Mn), by Banking, Financial Services, & Insurance, 2022 – 2031
Figure 45: North America SIP Trunking Services Market Absolute Opportunity (US$ Mn), by IT & Telecom, 2022 – 2031
Figure 46: North America SIP Trunking Services Market Absolute Opportunity (US$ Mn), by Government, 2022 – 2031
Figure 47: North America SIP Trunking Services Market Absolute Opportunity (US$ Mn), by Healthcare, 2022 – 2031
Figure 48: North America SIP Trunking Services Market Absolute Opportunity (US$ Mn), by Education, 2022 – 2031
Figure 49: North America SIP Trunking Services Market Absolute Opportunity (US$ Mn), by Retail & Ecommerce, 2022 – 2031
Figure 50: North America SIP Trunking Services Market Absolute Opportunity (US$ Mn), by Travel & Hospitality, 2022 – 2031
Figure 51: North America SIP Trunking Services Market Absolute Opportunity (US$ Mn), by Others, 2022 – 2031
Figure 52: North America SIP Trunking Services Market Value Share Analysis, by Country, 2022
Figure 53: North America SIP Trunking Services Market Value Share Analysis, by Country, 2031
Figure 54: U.S. SIP Trunking Services Market Opportunity Growth Analysis (US$ Mn) Forecast, 2022 – 2031
Figure 55: Canada SIP Trunking Services Market Opportunity Growth Analysis (US$ Mn) Forecast, 2022 – 2031
Figure 56: Mexico SIP Trunking Services Market Opportunity Growth Analysis (US$ Mn) Forecast, 2022 – 2031
Figure 57: Europe SIP Trunking Services Revenue Opportunity Share, by Enterprise Size
Figure 58: Europe SIP Trunking Services Revenue Opportunity Share, by End-user
Figure 59: Europe SIP Trunking Services Revenue Opportunity Share, by Country
Figure 60: Europe SIP Trunking Services Market Value Share Analysis, by Enterprise Size, 2022
Figure 61: Europe SIP Trunking Services Market Value Share Analysis, by Enterprise Size, 2031
Figure 62: Europe SIP Trunking Services Market Absolute Opportunity (US$ Mn), by Small & Medium Enterprises, 2022 – 2031
Figure 63: Europe SIP Trunking Services Market Absolute Opportunity (US$ Mn), by Large Enterprises, 2022 – 2031
Figure 64: Europe SIP Trunking Services Market Value Share Analysis, by End-user, 2022
Figure 65: Europe SIP Trunking Services Market Value Share Analysis, by End-user, 2031
Figure 66: Europe SIP Trunking Services Market Absolute Opportunity (US$ Mn), by Banking, Financial Services, & Insurance, 2022 – 2031
Figure 67: Europe SIP Trunking Services Market Absolute Opportunity (US$ Mn), by IT & Telecom, 2022 – 2031
Figure 68: Europe SIP Trunking Services Market Absolute Opportunity (US$ Mn), by Government, 2022 – 2031
Figure 69: Europe SIP Trunking Services Market Absolute Opportunity (US$ Mn), by Healthcare, 2022 – 2031
Figure 70: Europe SIP Trunking Services Market Absolute Opportunity (US$ Mn), by Education, 2022 – 2031
Figure 71: Europe SIP Trunking Services Market Absolute Opportunity (US$ Mn), by Retail & Ecommerce, 2022 – 2031
Figure 72 Europe SIP Trunking Services Market Absolute Opportunity (US$ Mn), by Travel & Hospitality, 2022 – 2031
Figure 73: Europe SIP Trunking Services Market Absolute Opportunity (US$ Mn), by Others, 2022 – 2031
Figure 74: Europe SIP Trunking Services Market Value Share Analysis, by Country, 2022
Figure 75: Europe SIP Trunking Services Market Value Share Analysis, by Country, 2031
Figure 76: Germany SIP Trunking Services Market Opportunity Growth Analysis (US$ Mn) Forecast, 2022 – 2031
Figure 77: U.K. SIP Trunking Services Market Opportunity Growth Analysis (US$ Mn) Forecast, 2022 – 2031
Figure 78: France SIP Trunking Services Market Opportunity Growth Analysis (US$ Mn) Forecast, 2022 – 2031
Figure 79: Spain SIP Trunking Services Market Opportunity Growth Analysis (US$ Mn) Forecast, 2022 – 2031
Figure 80: Asia Pacific SIP Trunking Services Revenue Opportunity Share, by Enterprise Size
Figure 81: Asia Pacific SIP Trunking Services Revenue Opportunity Share, by End-user
Figure 82: Asia Pacific SIP Trunking Services Revenue Opportunity Share, by Country
Figure 83: Asia Pacific SIP Trunking Services Market Value Share Analysis, by Enterprise Size, 2022
Figure 84: Asia Pacific SIP Trunking Services Market Value Share Analysis, by Enterprise Size, 2031
Figure 85: Asia Pacific SIP Trunking Services Market Absolute Opportunity (US$ Mn), by Small & Medium Enterprises, 2022 – 2031
Figure 86: Asia Pacific SIP Trunking Services Market Absolute Opportunity (US$ Mn), by Large Enterprises, 2022 – 2031
Figure 87: Asia Pacific SIP Trunking Services Market Value Share Analysis, by End-user, 2022
Figure 88: Asia Pacific SIP Trunking Services Market Value Share Analysis, by End-user, 2031
Figure 89: Asia Pacific SIP Trunking Services Market Absolute Opportunity (US$ Mn), by Banking, Financial Services, & Insurance, 2022 – 2031
Figure 90: Asia Pacific SIP Trunking Services Market Absolute Opportunity (US$ Mn), by IT & Telecom, 2022 – 2031
Figure 91: Asia Pacific SIP Trunking Services Market Absolute Opportunity (US$ Mn), by Government, 2022 – 2031
Figure 92: Asia Pacific SIP Trunking Services Market Absolute Opportunity (US$ Mn), by Healthcare, 2022 – 2031
Figure 93: Asia Pacific SIP Trunking Services Market Absolute Opportunity (US$ Mn), by Education, 2022 – 2031
Figure 94: Asia Pacific SIP Trunking Services Market Absolute Opportunity (US$ Mn), by Retail & Ecommerce, 2022 – 2031
Figure 95: Asia Pacific SIP Trunking Services Market Absolute Opportunity (US$ Mn), by Travel & Hospitality, 2022 – 2031
Figure 96: Asia Pacific SIP Trunking Services Market Absolute Opportunity (US$ Mn), by Others, 2022 – 2031
Figure 97: Asia Pacific SIP Trunking Services Market Value Share Analysis, by Country, 2022
Figure 98: Asia Pacific SIP Trunking Services Market Value Share Analysis, by Country, 2031
Figure 99: China SIP Trunking Services Market Opportunity Growth Analysis (US$ Mn) Forecast, 2022 – 2031
Figure 100: India SIP Trunking Services Market Opportunity Growth Analysis (US$ Mn) Forecast, 2022 – 2031
Figure 101: Japan SIP Trunking Services Market Opportunity Growth Analysis (US$ Mn) Forecast, 2022 – 2031
Figure 102: ASEAN SIP Trunking Services Market Opportunity Growth Analysis (US$ Mn) Forecast, 2022 – 2031
Figure 103: Middle East & Africa SIP Trunking Services Revenue Opportunity Share, by Enterprise Size
Figure 104: Middle East & Africa SIP Trunking Services Revenue Opportunity Share, by End Use
Figure 105: Middle East & Africa SIP Trunking Services Revenue Opportunity Share, by Country
Figure 106: Middle East & Africa SIP Trunking Services Market Value Share Analysis, by Enterprise Size, 2022
Figure 107: Middle East & Africa SIP Trunking Services Market Value Share Analysis, by Enterprise Size, 2031
Figure 108: Middle East & Africa SIP Trunking Services Market Absolute Opportunity (US$ Mn), by Small & Medium Enterprises, 2022 – 2031
Figure 109: Middle East & Africa SIP Trunking Services Market Absolute Opportunity (US$ Mn), by Large Enterprises, 2022 – 2031
Figure 110: Middle East & Africa SIP Trunking Services Market Value Share Analysis, by End-user, 2022
Figure 111: Middle East & Africa SIP Trunking Services Market Value Share Analysis, by End-user, 2031
Figure 112: Middle East & Africa SIP Trunking Services Market Absolute Opportunity (US$ Mn), by Banking, Financial Services, & Insurance, 2022 – 2031
Figure 113: Middle East & Africa SIP Trunking Services Market Absolute Opportunity (US$ Mn), by IT & Telecom, 2022 – 2031
Figure 114: Middle East & Africa SIP Trunking Services Market Absolute Opportunity (US$ Mn), by Government, 2022 – 2031
Figure 115: Middle East & Africa SIP Trunking Services Market Absolute Opportunity (US$ Mn), by Healthcare, 2022 – 2031
Figure 116: Middle East & Africa SIP Trunking Services Market Absolute Opportunity (US$ Mn), by Education, 2022 – 2031
Figure 117: Middle East & Africa SIP Trunking Services Market Absolute Opportunity (US$ Mn), by Retail & Ecommerce, 2022 – 2031
Figure 118: Middle East & Africa SIP Trunking Services Market Absolute Opportunity (US$ Mn), by Travel & Hospitality, 2022 – 2031
Figure 119: Middle East & Africa SIP Trunking Services Market Absolute Opportunity (US$ Mn), by Others, 2022 – 2031
Figure 120: Middle East & Africa SIP Trunking Services Market Value Share Analysis, by Country, 2022
Figure 121: Middle East & Africa SIP Trunking Services Market Value Share Analysis, by Country, 2031
Figure 122: Saudi Arabia SIP Trunking Services Market Opportunity Growth Analysis (US$ Mn) Forecast, 2022 – 2031
Figure 123: The United Arab Emirates SIP Trunking Services Market Opportunity Growth Analysis (US$ Mn) Forecast, 2022 – 2031
Figure 124: South Africa SIP Trunking Services Market Opportunity Growth Analysis (US$ Mn) Forecast, 2022 – 2031
Figure 125: South America SIP Trunking Services Revenue Opportunity Share, by Enterprise Size
Figure 126: South America SIP Trunking Services Revenue Opportunity Share, by End Use
Figure 127: South America SIP Trunking Services Revenue Opportunity Share, by Country
Figure 128: South America SIP Trunking Services Market Value Share Analysis, by Enterprise Size, 2022
Figure 129: South America SIP Trunking Services Market Value Share Analysis, by Enterprise Size, 2031
Figure 130: South America SIP Trunking Services Market Absolute Opportunity (US$ Mn), by Small & Medium Enterprises, 2022 – 2031
Figure 131: South America SIP Trunking Services Market Absolute Opportunity (US$ Mn), by Large Enterprises, 2022 – 2031
Figure 132: South America SIP Trunking Services Market Value Share Analysis, by End-user, 2022
Figure 133: South America SIP Trunking Services Market Value Share Analysis, by End-user, 2031
Figure 134: South America SIP Trunking Services Market Absolute Opportunity (US$ Mn), by Banking, Financial Services, & Insurance, 2022 – 2031
Figure 135: South America SIP Trunking Services Market Absolute Opportunity (US$ Mn), by IT & Telecom, 2022 – 2031
Figure 136: South America SIP Trunking Services Market Absolute Opportunity (US$ Mn), by Government, 2022 – 2031
Figure 137: South America SIP Trunking Services Market Absolute Opportunity (US$ Mn), by Healthcare, 2022 – 2031
Figure 138: South America SIP Trunking Services Market Absolute Opportunity (US$ Mn), by Education, 2022 – 2031
Figure 139: South America SIP Trunking Services Market Absolute Opportunity (US$ Mn), by Retail & Ecommerce, 2022 – 2031
Figure 140: South America SIP Trunking Services Market Absolute Opportunity (US$ Mn), by Travel & Hospitality, 2022 – 2031
Figure 141: South America SIP Trunking Services Market Absolute Opportunity (US$ Mn), by Others, 2022 – 2031
Figure 142: South America SIP Trunking Services Market Value Share Analysis, by Country, 2022
Figure 143: South America SIP Trunking Services Market Value Share Analysis, by Country, 2031
Figure 144: Brazil SIP Trunking Services Market Opportunity Growth Analysis (US$ Mn) Forecast, 2022 – 2031
Figure 145: Argentina SIP Trunking Services Market Opportunity Growth Analysis (US$ Mn) Forecast, 2022 – 2031
Copyright © Transparency Market Research, Inc. All Rights reserved
Trust Online

SIP Trunking Services Market