
Reports
Reports
The growth of disposable income generally improves quality of life and fuels the demand for chilled and frozen food and beverages. Such demand is also affected by changes in consumer habits. Improvements in the standard of living allow more people to eat out. This trend is reinforced by an increase in the number of restaurant chains and the rapid expansion of fast-food networks around the world, particularly in India, China, South East Asia, and Japan. These trends positively affect demand for commercial refrigeration equipment used for the conservation of food and beverage. Over and above the demand generated by the opening of new sales outlets, commercial refrigerators are used as displays, or ice cold merchandisers (ICMs) that offer a platform for visual communication and merchandising, thereby promoting impulse buying and facilitating brand recall. The concentration of populations in major urban centers and the increased participation of women in the labor market contributes to changes in eating habits. One such change is the higher consumption of frozen foods and refrigerated drinks.
Key factors driving growth of the freezer and beverage & wine coolers market include increased consumption of packaged foods and non-alcoholic drinks, growth of modern grocery retailers, and a boom in the tourism industry. With various advancements in refrigeration technology, freezer and beverage cooler products offer energy-efficient consumption and cost-effective energy saving solutions to achieve effective cooling and refrigeration for applications in various end-use sectors.
The market for SEA beverage coolers has been segmented on the basis of product types into beverage coolers and wine coolers. Beverage coolers was the largest segment in 2014, accounting for 58.3% share of the overall SEA beverage coolers market. The wine coolers market is estimated to be the fastest-growing segment, expanding at a CAGR of 7.8% during the forecast period from 2014 to 2022. Due to increased consumption of soft drinks and nonalcoholic cool beverages, there has been massive growth in demand for the installation of beverage coolers across the SEA region. The beverage cooler market is further segmented into beverage coolers and wine coolers. The SEA beverage cooler market was dominated by beverage coolers, with a market share of around 58% in 2014.
Based on the capacity range, the SEA freezer and beverage cooler market is segmented into 500 & above litres, 300 to 500 litres, 200 to 300 litres, and 200 and below litres. The growth of the service and hospitality sectors, including food chains, restaurants, and the tourism industry, as well as a change in consumer habits have led to a rise in the storage of frozen food and food-related products. In order to accommodate increased consumer demand, c-store owners, supermarkets, and other point-of-sale outlets are pitching for higher-capacity freezers, leading to a shift from traditional 200 & below liters to 300 to 500 liters and 500 & above liters capacities. The different door types for beverage coolers are categorized as 4 doors & above, 3 doors, 2 doors, and 1 door. Pubs, bars, and HORECA choose best-fit wine coolers in order to fulfill their requirements, basing their choices on factors such as space and quantity/capacity to hold wines/alcoholic beverages, in order to effectively cater to consumers, including tourists, expatriates, and locals in SEA. At approximately 58%, the beverage coolers segment held the largest market share of the overall SEA beverage cooler market.
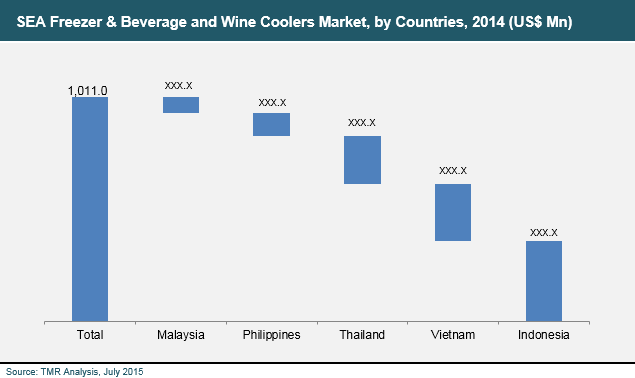
By country, Indonesia was one of the largest contributors to the SEA freezers and beverage & wine coolers market in terms of revenue in 2014. Market growth in Indonesia is likely to be largely driven by increased spending by consumers, changes consumer lifestyles, and more locally manufactured freezers, which has led to affordability and competitiveness. This resulted in faster replacement periods and encouraged freezer end-users to have more than one capacity option to serve growing demand. Leading companies operating in SEA in the freezer and beverage coolers market include AB Electrolux, Concepcion Industrial Corporation (CIC), Frigoglass SA, General Electric Corporation, Hoshizaki Singapore Pte Ltd., Midea Group, Sharp Electronics Co. Ltd., and South East Asia Hamico Export JSC. Domestic manufacturers include PT. Royal Sutan Agung (Indonesia), The Cool Company (Thailand), PT. Indotara Persada (Indonesia), and SAMEMAX Refrigeration Sdn. Bhd. (Malaysia).
Chapter 1 Preface
1.1 Research Scope
1.2 Market Segmentation
1.3 Research Methodology
Chapter 2 Executive Summary
2.1 SEA Freezer and Beverage Coolers Market Snapshot
2.2 SEA Freezer & Beverage Coolers Market Revenue, 2012 – 2022 (US$ Mn) and Year-on-Year Growth (%)
2.3 SEA Freezer Market, by Product Type, 2014 (US$ Mn)
2.4 SEA Freezers Market, by Capacity, 2014 (US$ Mn)
2.5 SEA Freezers Market, by Country, 2014 (US$ Mn)
2.6 SEA Beverage Coolers Market, by Product Type, 2014 (US$ Mn)
2.7 SEA Beverage Coolers Market, by Capacity, 2014 (US$ Mn)
2.8 SEA Beverage Coolers Market, by Door Type, 2014 (US$ Mn)
2.9 SEA Beverage Coolers Market, by Country, 2014 (US$ Mn)
Chapter 3 South East Asia (SEA) Freezer and Beverage Cooler Market, 2012 – 2022 (US$ Mn)
3.1 Overview
3.1.1 SEA Freezer and Beverage Coolers Market, 2012 – 2022, Revenue (US$ Mn) and YoY Growth (%)
3.2 Key Trends Analysis
3.3 Market Dynamics
3.3.1 Market Drivers
3.3.1.1 Increase in packaged foods and non-alcoholic drinks sales
3.3.1.2 Growth of Modern Grocery Retailers
3.3.1.3 Tourism & Stable economic growth promoting Freezers & Beverage Coolers Market
3.3.2 Market Restraints
3.3.2.1 International Regulations-Montreal and Kyoto Protocol
3.3.2.2 High Switching Cost
3.3.3 Market Opportunities
3.3.3.1 Rapid Urbanization, high Industry activity and tendency for healthy and hygienic lifestyle
3.4 Value Chain Analysis
3.5 South East Asia Freezer Market Analysis, 2012 – 2022 (US$ Bn)
3.5.1 South East Asia Freezer Market, 2012 – 2022, Revenue (US$ Mn) and YoY Growth (%)
3.5.2 South East Asia Freezer Market Analysis, By Product Type, 2012 – 2022 (US$ Bn)
3.5.2.1 Overview
3.5.2.1.1 Segment Share, 2012–2022 (%)
3.5.2.2 Ice–cream Freezers
3.5.2.3 Chest Freezers
3.5.2.4 Upright Freezers
3.5.3 South East Asia Freezer Market Analysis, By Capacity, 2012 – 2022 (US$ Bn)
3.5.3.1 Overview
3.5.3.1.1 Segment Share, 2012–2022 (%)
3.5.3.2 500 & Above Litres
3.5.3.3 300 to 500 Litres
3.5.3.4 200 to 300 Litres
3.5.3.5 200 & Below Litres
3.5.4 South East Asia Freezer Market Share Analysis, By Brand, 2014
3.5.5 South East Asia Freezer Market Share Analysis, By Manufacturer, 2014
3.5.6 South East Asia Freezer Market Analysis, By Country, 2012 – 2022 (US$ Bn)
3.5.6.1 Indonesia
3.5.6.2 Vietnam
3.5.6.3 Thailand
3.5.6.4 Philippines
3.5.6.5 Malaysia
3.6 South East Asia Beverage Cooler (BC) Market Analysis, 2012 – 2022 (US$ Bn)
3.6.1 South East Asia Beverage Cooler (BC) Market, 2012 – 2022, Revenue (US$ Mn) and YoY Growth (%)
3.6.2 South East Asia Beverage Cooler Market Analysis, By Product Type, 2012 – 2022 (US$ Bn)
3.6.2.1 Overview
3.6.2.1.1 Segment Share, 2012–2022 (%)
3.6.2.2 Beverage Coolers (Non-Alcoholic Beverages/Soft Drinks)
3.6.2.3 Wine Coolers
3.6.3 South East Asia Beverage Cooler Market Analysis, By Capacity, 2012 – 2022 (US$ Bn)
3.6.3.1 Overview
3.6.3.1.1 Segment Share, 2012–2022 (%)
3.6.3.2 500 & Above Litres
3.6.3.3 300 to 500 Litres
3.6.3.4 200 to 300 Litres
3.6.3.5 200 & Below Litres
3.6.4 South East Asia Beverage Cooler Market Analysis, By Door Type, 2012 – 2022 (US$ Bn)
3.6.4.1 Overview
3.6.4.1.1 Segment Share, 2012–2022 (%)
3.6.4.2 4 Door & Above Type
3.6.4.3 3 Door Type
3.6.4.4 2 Door Type
3.6.4.5 1 Door Type
3.6.5 South East Asia Beverage Cooler Market Share Analysis, By Brand, 2014
3.6.6 SEA Beverage Cooler Market Share Analysis, By Manufacturer, 2014
3.6.7 South East Asia Beverage Cooler Market Analysis, By Country, 2012 – 2022 (US$ Bn)
3.6.7.1 Indonesia
3.6.7.2 Vietnam
3.6.7.3 Thailand
3.6.7.4 Philippines
3.6.7.5 Malaysia
3.7 Competitive Landscape
3.7.1 Market Positioning of Key Players, 2014
3.7.2 Competitive Strategies Adopted by Leading Players
3.7.3 Recommendations
Chapter 4 Indonesia Freezer and Beverage Cooler Market Analysis, 2012 – 2022 (US$ Mn)
4.1 Key Trends Analysis
4.2 Indonesia Freezer Market Analysis, 2012 – 2022 (US$ Mn)
4.2.1 Overview
4.2.2 Indonesia Freezer Market Analysis, By Product Type, 2012 – 2022 (US$ Mn)
4.2.2.1 Overview
4.2.2.2 Indonesia Freezer Market Analysis, By Product Type, 2012–2022 (US$ Mn)
4.2.3 Indonesia Freezer Market Analysis, By Capacity, 2012 – 2022 (US$ Mn)
4.2.3.1 Overview
4.2.3.2 Indonesia Freezer Market Analysis, By Capacity, 2012–2022 (US$ Mn)
4.3 Indonesia Beverage Cooler Market Analysis, 2012 – 2022 (US$ Mn)
4.3.1 Overview
4.3.2 Indonesia Beverage Cooler Market Analysis, By Product Type, 2012 – 2022 (US$ Mn)
4.3.2.1 Overview
4.3.2.2 Indonesia Beverage Cooler Market Analysis, By Product Type, 2012–2022 (US$ Mn)
4.3.3 Indonesia Beverage Cooler Market Analysis, By Capacity, 2012 – 2022 (US$ Mn)
4.3.3.1 Overview
4.3.3.2 Indonesia Beverage Cooler Market Analysis, By Capacity, 2012–2022 (US$ Mn)
4.3.4 Indonesia Beverage Cooler Market Analysis, By Door Type, 2012 – 2022 (US$ Mn)
4.3.4.1 Overview
4.3.4.2 Indonesia Beverage Cooler Market Analysis, By Door Type, 2012–2022 (US$ Mn)
4.4 Indonesia Freezer & Beverage Cooler Market Share, By Manufacturer, 2014
Chapter 5 Vietnam Freezer and Beverage Cooler Market Analysis, 2012 – 2022 (US$ Mn)
5.1 Key Trends Analysis
5.2 Vietnam Freezer Market Analysis, 2012 – 2022 (US$ Mn)
5.2.1 Overview
5.2.2 Vietnam Freezer Market Analysis, By Product Type, 2012 – 2022 (US$ Mn)
5.2.2.1 Overview
5.2.2.2 Vietnam Freezer Market Analysis, By Product Type, 2012–2022 (US$ Mn)
5.2.3 Vietnam Freezer Market Analysis, By Capacity, 2012 – 2022 (US$ Mn)
5.2.3.1 Overview
5.2.3.2 Vietnam Freezer Market Analysis, By Capacity, 2012–2022 (US$ Mn)
5.3 Vietnam Beverage Cooler Market Analysis, 2012 – 2022 (US$ Mn)
5.3.1 Overview
5.3.2 Vietnam Beverage Cooler Market Analysis, By Product Type, 2012 – 2022 (US$ Mn)
5.3.2.1 Overview
5.3.2.2 Vietnam Beverage Cooler Market Analysis, By Product Type, 2012–2022 (US$ Mn)
5.3.3 Vietnam Beverage Cooler Market Analysis, By Capacity, 2012 – 2022 (US$ Mn)
5.3.3.1 Overview
5.3.3.2 Vietnam Beverage Cooler Market Analysis, By Capacity, 2012–2022 (US$ Mn)
5.3.4 Vietnam Beverage Cooler Market Analysis, By Door Type, 2012 – 2022 (US$ Mn)
5.3.4.1 Overview
5.3.4.2 Vietnam Beverage Cooler Market Analysis, By Door Type, 2012–2022 (US$ Mn)
5.4 Vietnam Freezer & Beverage Cooler Market Share, By Manufacturer, 2014
Chapter 6 Thailand Freezer and Beverage Cooler Market Analysis, 2012 – 2022 (US$ Mn)
6.1 Key Trends Analysis
6.2 Thailand Freezer Market Analysis, 2012 – 2022 (US$ Mn)
6.2.1 Overview
6.2.2 Thailand Freezer Market Analysis, By Product Type, 2012 – 2022 (US$ Mn)
6.2.2.1 Overview
6.2.2.2 Thailand Freezer Market Analysis, By Product Type, 2012–2022 (US$ Mn)
6.2.3 Thailand Freezer Market Analysis, By Capacity, 2012 – 2022 (US$ Mn)
6.2.3.1 Overview
6.2.3.2 Thailand Freezer Market Analysis, By Capacity, 2012–2022 (US$ Mn)
6.3 Thailand Beverage Cooler Market Analysis, 2012 – 2022 (US$ Mn)
6.3.1 Overview
6.3.2 Thailand Beverage Cooler Market Analysis, By Product Type, 2012 – 2022 (US$ Mn)
6.3.2.1 Overview
6.3.2.2 Thailand Beverage Cooler Market Analysis, By Product Type, 2012–2022 (US$ Mn)
6.3.3 Thailand Beverage Cooler Market Analysis, By Capacity, 2012 – 2022 (US$ Mn)
6.3.3.1 Overview
6.3.3.2 Thailand Beverage Cooler Market Analysis, By Capacity, 2012–2022 (US$ Mn)
6.3.4 Thailand Beverage Cooler Market Analysis, By Door Type, 2012 – 2022 (US$ Mn)
6.3.4.1 Overview
6.3.4.2 Thailand Beverage Cooler Market Analysis, By Door Type, 2012–2022 (US$ Mn)
6.4 Thailand Freezer & Beverage Cooler Market Share, By Manufacturer, 2014
Chapter 7 Philippines Freezer and Beverage Cooler Market Analysis, 2012 – 2022 (US$ Mn)
7.1 Key Trends Analysis
7.2 Philippines Freezer Market Analysis, 2012 – 2022 (US$ Mn)
7.2.1 Overview
7.2.2 Philippines Freezer Market Analysis, By Product Type, 2012 – 2022 (US$ Mn)
7.2.2.1 Overview
7.2.2.2 Philippines Freezer Market Analysis, By Product Type, 2012–2022 (US$ Mn)
7.2.3 Philippines Freezer Market Analysis, By Capacity, 2012 – 2022 (US$ Mn)
7.2.3.1 Overview
7.2.3.2 Philippines Freezer Market Analysis, By Capacity, 2012–2022 (US$ Mn)
7.3 Philippines Beverage Cooler Market Analysis, 2012 – 2022 (US$ Mn)
7.3.1 Overview
7.3.2 Philippines Beverage Cooler Market Analysis, By Product Type, 2012 – 2022 (US$ Mn)
7.3.2.1 Overview
7.3.2.2 Philippines Beverage Cooler Market Analysis, By Product Type, 2012–2022 (US$ Mn)
7.3.3 Philippines Beverage Cooler Market Analysis, By Capacity, 2012 – 2022 (US$ Mn)
7.3.3.1 Overview
7.3.3.2 Philippines Beverage Cooler Market Analysis, By Capacity, 2012–2022 (US$ Mn)
7.3.4 Philippines Beverage Cooler Market Analysis, By Door Type, 2012 – 2022 (US$ Mn)
7.3.4.1 Overview
7.3.4.2 Philippines Beverage Cooler Market Analysis, By Door Type, 2012–2022 (US$ Mn)
7.4 Philippines Freezer & Beverage Cooler Market Share, By Manufacturer, 2014
Chapter 8 Malaysia Freezer and Beverage Cooler Market Analysis, 2012 – 2022 (US$ Mn)
8.1 Key Trends Analysis
8.2 Malaysia Freezer Market Analysis, 2012 – 2022 (US$ Mn)
8.2.1 Overview
8.2.2 Malaysia Freezer Market Analysis, By Product Type, 2012 – 2022 (US$ Mn)
8.2.2.1 Overview
8.2.2.2 Malaysia Freezer Market Analysis, By Product Type, 2012–2022 (US$ Mn)
8.2.3 Malaysia Freezer Market Analysis, By Capacity, 2012 – 2022 (US$ Mn)
8.2.3.1 Overview
8.2.3.2 Malaysia Freezer Market Analysis, By Capacity, 2012–2022 (US$ Mn)
8.3 Malaysia Beverage Cooler Market Analysis, 2012 – 2022 (US$ Mn)
8.3.1 Overview
8.3.2 Malaysia Beverage Cooler Market Analysis, By Product Type, 2012 – 2022 (US$ Mn)
8.3.2.1 Overview
8.3.2.2 Malaysia Beverage Cooler Market Analysis, By Product Type, 2012–2022 (US$ Mn)
8.3.3 Malaysia Beverage Cooler Market Analysis, By Capacity, 2012 – 2022 (US$ Mn)
8.3.3.1 Overview
8.3.3.2 Malaysia Beverage Cooler Market Analysis, By Capacity, 2012–2022 (US$ Mn)
8.3.4 Malaysia Beverage Cooler Market Analysis, By Door Type, 2012 – 2022 (US$ Mn)
8.3.4.1 Overview
8.3.4.2 Malaysia Beverage Cooler Market Analysis, By Door Type, 2012–2022 (US$ Mn)
8.4 Malaysia Freezer & Beverage Cooler Market Share, By Manufacturer, 2014
Chapter 9 South East Asia (SEA) Wine Cooler Market Analysis, 2012 – 2022 (US$ Mn)
9.1 Key Trends Analysis
9.2 Market Dynamics
9.2.1 Drivers
9.2.2 Restraints
9.2.3 Opportunities
9.3 SEA Wine Cooler Market Analysis, By Capacity Range, 2012 – 2022 (US$ Mn)
9.4 SEA Wine Cooler Market Analysis, By Country, 2012 – 2022 (US$ Mn)
Chapter 10 Company Profiles
10.1 AB Electrolux
10.2 Concepcion Industrial Corporation
10.3 Frigoglass SA
10.4 GE Corporation
10.5 Hoshizaki Singapore Pte Ltd.
10.6 Midea Group
10.7 PT. Royal Sutan Agung
10.8 Samemax Refrigeration Sdn Bhd.
10.9 Sanden Intercool
10.10 Sharp Electronics Co. Ltd.
10.11 South East Asia Hamico Export JSC
10.12 The Cool Company
List of Tables
TABLE 1 Market Snapshot: SEA Freezer and Beverage Coolers Market (2013 – 2022)
TABLE 2 Retail Sales of Packaged Food and Non-Alcoholic Drinks, By Country, 2006 – 2014 (US$ Mn)
TABLE 3 SEA Region: Period Growth (%) of Packaged Food and Non-Alcoholic Beverage Categories Based on Retail Value, 2006 to 2011
TABLE 4 Retail Sales of Packaged Food and Non-Alcoholic Drinks, By Country, 2006 – 2014 (US$ Bn)
TABLE 5 SEA Freezer Market Segment Share, By Product Type, 2012–2022 (%)
TABLE 6 SEA Freezer Market Segment Share, By Capacity, 2012–2022 (%)
TABLE 7 SEA Beverage Cooler Market Segment Share, By Product Type, 2012 – 2022 (%)
TABLE 8 SEA Beverage Cooler Market Segment Share, By Capacity, 2012–2022 (%)
TABLE 9 SEA Beverage Cooler Market Segment Share, By Door Type, 2012–2022 (%)
TABLE 10 Indonesia Freezer Market Analysis, By Product Type, 2012–2022 (US$ Mn)
TABLE 11 Indonesia Freezer Market Analysis, By Capacity, 2012–2022 (US$ Mn)
TABLE 12 Indonesia Beverage Cooler Market Analysis, By Product Type, 2012–2022 (US$ Mn)
TABLE 13 Indonesia Beverage Cooler Market Analysis, By Capacity, 2012–2022 (US$ Mn)
TABLE 14 Indonesia Beverage Cooler Market Analysis, By Door Type, 2012–2022 (US$ Mn)
TABLE 15 Vietnam Freezer Market Analysis, By Product Type, 2012–2022 (US$ Mn)
TABLE 16 Vietnam Freezer Market Analysis, By Capacity, 2012–2022 (US$ Mn)
TABLE 17 Vietnam Beverage Cooler Market Analysis, By Product Type, 2012–2022 (US$ Mn)
TABLE 18 Vietnam Beverage Cooler Market Analysis, By Capacity, 2012–2022 (US$ Mn)
TABLE 19 Vietnam Beverage Cooler Market Analysis, By Door Type, 2012–2022 (US$ Mn)
TABLE 20 Retail Sales of Agri-based Packaged Food and Non-Alcoholic Beverages in Thailand, By Category, 2009 – 2018 (US$ Mn)
TABLE 21 Thailand Freezer Market Analysis, By Product Type, 2012–2022 (US$ Mn)
TABLE 22 Thailand Freezer Market Analysis, By Capacity, 2012–2022 (US$ Mn)
TABLE 23 Thailand Beverage Cooler Market Analysis, By Product Type, 2012–2022 (US$ Mn)
TABLE 24 Thailand Beverage Cooler Market Analysis, By Capacity, 2012–2022 (US$ Mn)
TABLE 25 Thailand Beverage Cooler Market Analysis, By Door Type, 2012–2022 (US$ Mn)
TABLE 26 Philippines Freezer Market Analysis, By Product Type, 2012–2022 (US$ Mn)
TABLE 27 Philippines Freezer Market Analysis, By Capacity, 2012–2022 (US$ Mn)
TABLE 28 Philippines Beverage Cooler Market Analysis, By Product Type, 2012–2022 (US$ Mn)
TABLE 29 Philippines Beverage Cooler Market Analysis, By Capacity, 2012–2022 (US$ Mn)
TABLE 30 Philippines Beverage Cooler Market Analysis, By Door Type, 2012–2022 (US$ Mn)
TABLE 31 Malaysia Freezer Market Analysis, By Product Type, 2012–2022 (US$ Mn)
TABLE 32 Malaysia Freezer Market Analysis, By Capacity, 2012–2022 (US$ Mn)
TABLE 33 Malaysia Beverage Cooler Market Analysis, By Product Type, 2012–2022 (US$ Mn)
TABLE 34 Malaysia Beverage Cooler Market Analysis, By Capacity, 2012–2022 (US$ Mn)
TABLE 35 Malaysia Beverage Cooler Market Analysis, By Door Type, 2012–2022 (US$ Mn)
TABLE 36 SEA Wine Cooler Market Analysis, By Capacity Range, 2012–2022 (US$ Mn)
TABLE 37 SEA Wine Cooler Market Analysis, By Country, 2012–2022 (US$ Mn)
List of Figures
FIG. 1 Market Segmentation: SEA Freezers and Beverage Coolers Market
FIG. 2 SEA Freezer & Beverage Coolers Market, 2012 – 2022, Revenue (US$ Mn) and Y-o-Y Growth (%)
FIG. 3 SEA Freezer Market, by Product Type, 2014 (US$ Mn)
FIG. 4 SEA Freezers Market, by Capacity, 2014 (US$ Mn)
FIG. 5 SEA Freezers Market, by Country, 2014 (US$ Mn)
FIG. 6 SEA Beverage Coolers Market, by Product Type, 2014 (US$ Mn)
FIG. 7 SEA Beverage Coolers Market, by Capacity, 2014 (US$ Mn)
FIG. 8 SEA Beverage Coolers Market, by Door Type, 2014 (US$ Mn)
FIG. 9 SEA Beverage Coolers Market, by Country, 2014 (US$ Mn)
FIG. 10 South East Asia (SEA) Freezer and Beverage Cooler Market, 2012- 2022, Revenue (US$ Mn) and YoY Growth (%)
FIG. 11 Major Retail formats in SEA countries, Market Share, 2014 (%)
FIG. 12 Growth of the gross domestic product in ASEAN, year-on-year (%)
FIG. 13 Tourist Arrival in SEA countries, 2009-2013 (in Million)
FIG. 14 Top 10 Leading countries in Industry activity, By BPO, Voice, KPO, 2014
FIG. 15 Value Chain Analysis of Freezers and Beverage Coolers Market, 2014
FIG. 16 South East Asia Freezer Market, 2012 – 2022, Revenue (US$ Mn) and YoY Growth (%)
FIG. 17 South East Asia Ice-cream Freezers Market, Revenue and Forecast, 2012 – 2022 (US$ Mn)
FIG. 18 South East Asia Chest Freezers Market, Revenue and Forecast, 2012 – 2022 (US$ Mn)
FIG. 19 South East Asia Upright Freezers Market, Revenue and Forecast, 2012 – 2022 (US$ Mn)
FIG. 20 South East Asia 500 & Above Litres Capacity Market, Revenue and Forecast, 2012 – 2022 (US$ Mn)
FIG. 21 South East Asia 300 to 500 Litres Capacity Market, Revenue and Forecast, 2012 – 2022 (US$ Mn)
FIG. 22 South East Asia 200 to 300 Litres Capacity Market, Revenue and Forecast, 2012 – 2022 (US$ Mn)
FIG. 23 South East Asia 200 & Below Litres Capacity Market, Revenue and Forecast, 2012 – 2022 (US$ Mn)
FIG. 24 South East Asia Freezer Market Share Analysis, By Brand, 2014 (%)
FIG. 25 South East Asia Freezer Market Share Analysis, By Manufacturer, 2014 (%)
FIG. 26 Indonesia Freezer Market, 2012 – 2022, Revenue (US$ Mn) and YoY Growth (%)
FIG. 27 Vietnam Freezer Market, 2012 – 2022, Revenue (US$ Mn) and YoY Growth (%)
FIG. 28 Thailand Freezers Market, 2012 – 2022, Revenue (US$ Mn) and YoY Growth (%)
FIG. 29 Philippines Freezers Market, 2012 – 2022, Revenue (US$ Mn) and YoY Growth (%)
FIG. 30 Malaysia Freezers Market, 2012 – 2022, Revenue (US$ Mn) and YoY Growth (%)
FIG. 31 South East Asia Beverage Cooler (BC) Market, 2012 – 2022, Revenue (US$ Mn) and YoY Growth (%)
FIG. 32 South East Asia Beverage Coolers (Non-Alcoholic Beverages/Soft Drinks) Market, Revenue and Forecast, 2012 – 2022 (US$ Mn)
FIG. 33 South East Asia Wine Coolers Market, Revenue and Forecast, 2012 – 2022 (US$ Mn)
FIG. 34 South East Asia 500 & Above Litres Capacity Market, Revenue and Forecast, 2012 – 2022 (US$ Mn)
FIG. 35 South East Asia 300 to 500 Litres Capacity Market, Revenue and Forecast, 2012 – 2022 (US$ Mn)
FIG. 36 South East Asia 200 to 300 Litres Capacity Market, Revenue and Forecast, 2012 – 2022 (US$ Mn)
FIG. 37 South East Asia 200 & Below Litres Capacity Market, Revenue and Forecast, 2012 – 2022 (US$ Mn)
FIG. 38 South East Asia 4 Door & Above Type Market, Revenue and Forecast, 2012 – 2022 (US$ Mn)
FIG. 39 South East Asia 3 Door Type Market, Revenue and Forecast, 2012 – 2022 (US$ Mn)
FIG. 40 South East Asia 2 Door Type Market, Revenue and Forecast, 2012 – 2022 (US$ Mn)
FIG. 41 South East Asia 1 Door Type Market, Revenue and Forecast, 2012 – 2022 (US$ Mn)
FIG. 42 South East Asia Beverage Cooler Market Share Analysis, By Brand, 2014 (%)
FIG. 43 SEA Beverage Cooler Market Share Analysis, By Manufacturer, 2014 (%)
FIG. 44 Indonesia Beverage Cooler Market, 2012 – 2022, Revenue (US$ Mn) and YoY Growth (%)
FIG. 45 Vietnam Beverage Cooler Market, 2012 – 2022, Revenue (US$ Mn) and YoY Growth (%)
FIG. 46 Thailand Beverage Coolers Market, 2012 – 2022, Revenue (US$ Mn) and YoY Growth (%)
FIG. 47 Philippines Beverage Coolers Market, 2012 – 2022, Revenue (US$ Mn) and YoY Growth (%)
FIG. 48 Malaysia Beverage Coolers Market, 2012 – 2022, Revenue (US$ Mn) and YoY Growth (%)
FIG. 49 Market Positioning of Key Players, 2014
FIG. 50 Indonesia Freezer Market, 2012 – 2022, Revenue (US$ Mn) and YoY Growth (%)
FIG. 51 Indonesia Beverage Cooler Market, 2012 – 2022, Revenue (US$ Mn) and YoY Growth (%)
FIG. 52 Indonesia Freezer & BC Market Share, By Manufacturer, 2014
FIG. 53 Vietnam Foodservice Sector Market Value, By Category, 2008 – 2014, (US$ Mn)
FIG. 54 Vietnam Freezer Market, 2012 – 2022, Revenue (US$ Mn) and YoY Growth (%)
FIG. 55 Vietnam Beverage Cooler Market, 2012 – 2022, Revenue (US$ Mn) and YoY Growth (%)
FIG. 56 Vietnam Freezer & BC Market Share, By Manufacturer, 2014
FIG. 57 Thailand Foodservice Sector Market Value, By Category, 2008 – 2014, (US$ Mn)
FIG. 58 Thailand Freezer Market, 2012 – 2022, Revenue (US$ Mn) and YoY Growth (%)
FIG. 59 Thailand Beverage Cooler Market, 2012 – 2022, Revenue (US$ Mn) and YoY Growth (%)
FIG. 60 Thailand Freezer & BC Market Share, By Manufacturer, 2014
FIG. 61 Philippines Freezer Market, 2012 – 2022, Revenue (US$ Mn) and YoY Growth (%)
FIG. 62 Philippines Beverage Cooler Market, 2012 – 2022, Revenue (US$ Mn) and YoY Growth (%)
FIG. 63 Philippines Freezer & BC Market Share, By Manufacturer, 2014
FIG. 64 Malaysia Freezer Market, 2012 – 2022, Revenue (US$ Mn) and YoY Growth (%)
FIG. 65 Malaysia Beverage Cooler Market, 2012 – 2022, Revenue (US$ Mn) and YoY Growth (%)
FIG. 66 Malaysia Freezer & BC Market Share, By Manufacturer, 2014
FIG. 67 Import of Alcoholic Drinks to ASEAN countries, 2014
FIG. 68 South East Asia Distribution Channels for Alcoholic Drinksy Manufacturer, 2014
FIG. 67 Import of Alcoholic Drinks to ASEAN countries, 2014
FIG. 68 South East Asia Distribution Channels for Alcoholic Drinks
Copyright © Transparency Market Research, Inc. All Rights reserved
Trust Online

Freezer and Beverage & Wine Coolers Market